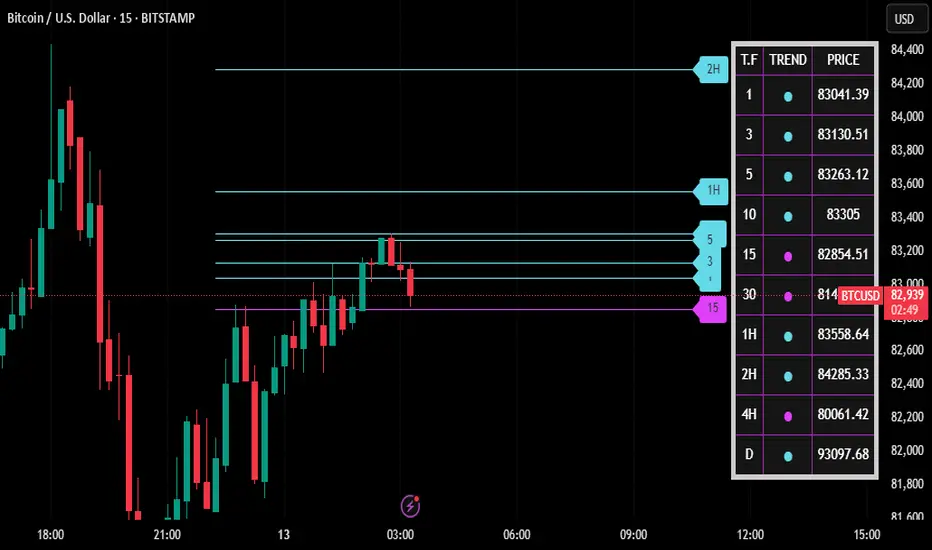
Bitcoin Scalping with Multi-Timeframe Parabolic SAR Bitcoin Scalping with Multi-Timeframe Parabolic SAR – A Smarter Approach 🚀
Scalping Bitcoin can be challenging, especially with rapid fluctuations and false signals. The Multi-Timeframe Parabolic SAR (PSAR) approach helps traders filter out noise by aligning lower and higher timeframe signals. This method ensures better trade accuracy by following the dominant trend before executing scalp trades.
⸻
How It Works 🔍
✅ Parabolic SAR (PSAR): A classic trend-following indicator that places dots above or below the price to signal trend direction.
✅ Multi-Timeframe Confirmation: Instead of relying on a single timeframe, this method overlays higher-timeframe PSAR values (e.g., 15M, 1H) onto a lower timeframe (e.g., 5M).
✅ Trend Alignment: A scalp entry is considered only when both higher and lower timeframes show a matching trend direction.
⸻
Why This Works for Scalping ⚡
🚀 Reduces False Signals: By filtering short-term trades with higher timeframe trends, traders avoid entering counter-trend setups.
🚀 Improves Precision: Entries and exits become more reliable when both timeframes confirm a trend.
🚀 Works in Any Market Condition: Whether Bitcoin is ranging or trending, multi-timeframe PSAR keeps you in sync with momentum.
⸻
Example Setup 📊
🟢 Long Entry: If 15M & 1H PSAR dots appear below price while the 5M chart shows a bullish crossover.
🔴 Short Entry: If 15M & 1H PSAR dots appear above price while the 5M chart flips bearish.
What do you think? Would you integrate multi-timeframe PSAR into your Bitcoin strategy? Let’s discuss below!
(P.S. Keep an eye on TechnoBlooms for more innovative indicators! 🚀)
Trade ideas
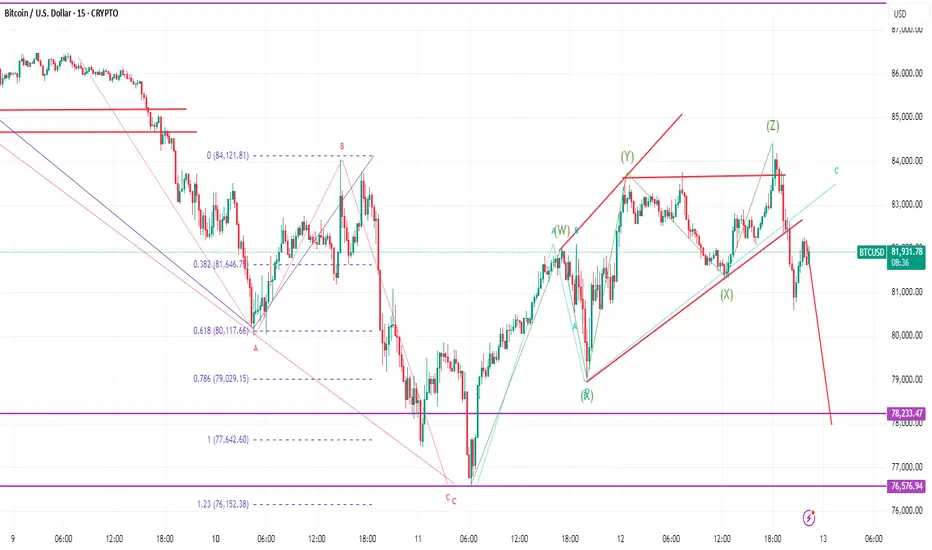
BTC update- next move the downside about started.BTC has completed Major move down and than corrected
Correction started from 76576 low and made high around 82k as a W wave and took abc correction
to the downside & correction completed at. 79k around and price bounced in Y wave,which is a ABC
correction and completed around 83.5K and next wave to the downside completed at. 81.3K and completed
X1 there and price went for next upside and completed triple zigzag pattern to the upside at
84.4K and broke to the downside.
Now if I am correct this move to the downside has to break the low of 76K.
Bitcoin Bybit chart analysis March 11Hello
It's a Bitcoinguide.
If you have a "follower"
You can receive comment notifications on real-time travel routes and major sections.
If my analysis is helpful,
Please would like one booster button at the bottom.
This is the Bitcoin 30-minute chart.
There will be a Nasdaq indicator announcement at 11 o'clock shortly.
As long as the Nasdaq doesn't crash,
it will continue to crash + forced coupling,
so it is not easy to analyze.
In this case, it is recommended to operate with a tight stop loss,
and since Bitcoin broke its previous low with yesterday's movement,
I created a strategy based on the major rebound section of 75,459.5 dollars at the bottom this week.
*When the blue finger moves,
it is a two-way neutral long->short switching strategy
The section from 1 to 83,529 dollars at the top is an autonomous short section.
You can operate based on the center line of the 4-hour chart that will be additionally created at 9 o'clock shortly.
For example, if a rebound is connected before 9 o'clock, it is the purple finger.
If a rebound occurs after 9 o'clock, it is the 1st section.
If it comes down immediately without touching, it is good to operate the long position waiting until the 2nd section at the bottom.
1. 80365 dollar long position entry section / stop loss price when the purple support line is broken
(If it comes down immediately without touching the short position entry section at the top, 83529 dollar long position 1st target -> short position autonomous section)
2. 84965 dollar long position target price -> 83529 dollar autonomous long position operation section
(Since it is the center line of the 6-hour chart, if it reaches this section, it is highly likely to continue to rise.)
After that, the target price is in the order of Gap9 -> Good -> Great,
but short position switching is done from the touch of the center line of the daily chart.
If it comes down right from the current position,
2 -> Look at Bottom
From Gap7, the previous low is broken again
It is good to operate it as a major rebound section up to $75,459.5 this week.
More than anything else, Nasdaq is the problem.
Since Bitcoin has a fast turnover rate
As long as Nasdaq doesn't crash/crash/crash, it's fine.
Please use my analysis up to this point as a reference only
I hope you operate safely with principle trading and stop loss prices.
Thank you.

BTCUSD.P_15Min_ShortIn the 15-minute time frame, we identify the Point of Interest (POI) following a liquidity sweep. Subsequently, we move to a lower time frame to place an entry within a clearly defined order block or POI zone. A target is then set, with the stop loss positioned just below the order block to manage risk effectively.

Very good shorting opportunity in btc. Setup explained Btc is falling from 1hour supply zone. It has failed rmed M pattern also. Good risk reward trade. Manage risk

BTCUSDBased on the chart's current momentum and the possibility of further upside, a bullish strategy might be considered.

Bitcoin updated levels buy near 79200 avoid sell trade buy onlyHow to take trades using Harmonic pattern projection Trade setup is explained below :-
Entry : 1st SL point : 0% is recent top or bottom.
Trailing D: 11.4% is work as trailing SL of buy or sell trade if hit then we have to book profit
.If price goes below 2nd D 21.4% to 23.6% range then early traders can make fresh reversals trade after breaking 1st D 11.4% safe traders can reversal trade after breaking Point D 21.4% to 23.6% range
Targets :
Target T1 : 35.1% to 38.3%
Target T3 : 49.1% to 53.2%
T3: 60.9% to 64.8% is our 3rd Target since this is reversal zone so must book profit if break then take fresh trade again
Target T4 : 76.4% to 79.7%
Next Targets are 100% , 127.2% ,141.4% and final Target 161.8%.
How to take reversal trade :
If price going upside/ downside then then buy or sell levels appear on Chart ( Automatically show when price reach any reversal zone of harmonic projection pattern based .
After showing reversal levels wait for confirmation until 21.4% or 28.3 % level not break if break then exit from current buy / sell trade and take fresh reverse trade buy/ sell .
Trailing SL:
After reach 1st Target trail SL to just above or below cost ( for example we are holding sell trade from 100 1st Target 110 hit then move trailing sl to 104-105 and move SL as price move upside or Downside)
Re- Entry :
For Re-entry in any pull back Point D ( 11.4% ) is used for re-entry then SL recent high or low Point SL ( 0% ) .
Blue Line is 1st support/ Resistance
Green line is 2nd support/ resistance
Red line is 3rd Support/ resistance

BTCBTC appears to be forming a bullish AB=CD pattern. The key support level is at **$79,940**, while resistance is seen at **$81,765**. If BTC remains above **$79,940**, it could continue its bullish momentum. However, a break below this support may trigger further declines.
In the event of a downside move, the next targets could be **$78,724**, **$77,772**, **$76,560**, and **$73,059**. Traders should monitor price action around support and resistance levels to confirm potential trends. A sustained move above resistance could indicate further bullish strength, while a breakdown below support may lead to deeper corrections.
Risk management is crucial, as volatility remains high. Setting stop-loss orders and watching for confirmation signals can help in making informed trading decisions. Keep an eye on market sentiment and external factors, such as macroeconomic events, which could influence BTC's price movement.BTC appears to be forming a bullish AB=CD pattern. The key support level is at **$79,940**, while resistance is seen at **$81,765**. If BTC remains above **$79,940**, it could continue its bullish momentum. However, a break below this support may trigger further declines.
In the event of a downside move, the next targets could be **$78,724**, **$77,772**, **$76,560**, and **$73,059**. Traders should monitor price action around support and resistance levels to confirm potential trends. A sustained move above resistance could indicate further bullish strength, while a breakdown below support may lead to deeper corrections.
Risk management is crucial, as volatility remains high. Setting stop-loss orders and watching for confirmation signals can help in making informed trading decisions. Keep an eye on market sentiment and external factors, such as macroeconomic events, which could influence BTC's price movement.

BTC/USD Breakdown! Bearish Target: $78K🔍 BTC/USD 30-Minute Chart Analysis
📉 Market Structure:
The chart displays an ABCDE corrective pattern, likely a descending wedge or contracting triangle, which has now broken to the downside.
Price action shows a breakout below the wedge, leading to further bearish momentum.
The 200-period moving average (red line) is acting as resistance, reinforcing the downward trend.
📊 Current Price: ~$83,057
🔻 Bearish Target: $78,049 (marked as the potential support level)
🛑 Key Observations:
Rejection from wave E indicates a lack of bullish strength.
Lower highs and lower lows confirm a continuation of the bearish trend.
Potential retest of ~$85,000 before dropping further.
🚀 Trading Insights:
Bearish Bias: Short opportunities on pullbacks toward resistance.
Bullish Reversal? Look for price action near $78,049—if buyers step in, a potential bounce could occur.
⚠️ Watch out for:
Sudden Bitcoin volatility (news-driven moves).
A fake breakdown (if buyers reclaim above ~$85,000).

Bitcoin Bybit chart analysis March 10Hello
It's a Bitcoinguide.
If you have a "follower"
You can receive comment notifications on real-time travel routes and major sections.
If my analysis is helpful,
Please would like one booster button at the bottom.
This is the Bitcoin 30-minute chart.
There is no Nasdaq indicator announcement today.
The trend has been brought forward by one hour due to the application of US Daylight Savings Time.
If only the Nasdaq low is not broken and
It moves sideways, there will be no crash in Bitcoin.
I created today's strategy based on the Gap9 section retracement at the top.
*When the blue finger moves,
It is a two-way neutral strategy.
1. 81826.5 dollars long position entry section / stop loss price when the blue support line is broken
2. 86234 dollars long position target price
After that, from section 1 -> 87428.5 dollars -> Great
As indicated, it would be good to use short->long switching.
Up to this section, it seems more advantageous to liquidate long and then re-enter long than short. (Tether Dominance 4+6+12 MACD Dead Cross Possibility)
The center line of the Bollinger Band daily chart
is the final short position switching point.
(Approximately $90,418)
If the Bottom section is broken today according to the movement of Nasdaq,
Bit will also break the previous low point
and it may fall strongly to 3 -> Gap7.
For those who can check the drawing section,
I have marked today's major rebound section near Gap7, so please refer to it.
Up to this point, please use my analysis as a reference only
Please operate safely with principle trading and stop loss price.
Thank you.

Sell the rally BTC CMP 80900
We know that the 82500 zone will now act as a strong resistance. I needed that one trigger to sell it again there and I found one.
RSI - the support at 41 will now become resistance and also below the two MA's. Its a very good sell around the 82500 zone.
Conclusion - In my view we will see 70k to 67k this time around.
BTCUSDT TRADING POINT UPDATE >READ THE CHPTAIN SMC Trading Signals Update 🗾🗺️ crypto Traders SMC-Trading Point update you on New technical analysis setup for crypto BTC USDT. ) crypto Traders BTC USD ) list time post signals 🚀 Hit sucksfully My target point ) Now update on New analysis setup. BTC USDT still drop 💧. Trend 📉. Technical patterns FVG) 85k. Back down trand target point 78k.
Key Resistance level 85k
Key Support level 81k- 78k
Mr SMC Trading point
Pales support boost 🚀 analysis follow)

Bitcoin Trend Precision – Combining VWAP, MACD, and Parabolic SABitcoin’s price moves erratically, making it tough to catch high-probability entries without getting shaken out. But what if you had a system that combines trend strength, momentum shifts, and key price levels to improve accuracy?
This strategy uses:
🔹 VWAP (Volume Weighted Average Price) – The institutional price benchmark for trend direction.
🔹 MACD (Moving Average Convergence Divergence) – To track momentum shifts.
🔹 Parabolic SAR – For trend continuation confirmation.
⸻
📌 How This Strategy Works for BTC Trading
🔹 Step 1: Identify Trend Using VWAP
• Price above VWAP = Uptrend (Look for longs) ✅
• Price below VWAP = Downtrend (Look for shorts) ❌
🔹 Step 2: Use MACD for Momentum Confirmation
• Bullish Setup: MACD crossover happens above 0, and price is above VWAP → Look for a long entry.
• Bearish Setup: MACD crossover below 0, and price is below VWAP → Look for short setups.
🔹 Step 3: Confirm Entry with Parabolic SAR
• If dots flip below price, it’s a strong confirmation for a long position.
• If dots flip above price, it signals potential downside continuation.
⸻
🚀 Why This Works?
✅ VWAP ensures we only trade with the trend – no more counter-trend traps!
✅ MACD confirms trend momentum, filtering out false entries.
✅ Parabolic SAR gives early signals on when the trend is likely to continue or reverse.
⸻
🔥 Live Example: How This Worked on BTC/USD?
📊 BTC was trading near $42,300, hovering around VWAP.
📌 MACD gave a bullish crossover above 0, and Parabolic SAR flipped bullish at $42,400.
📈 Result? BTC pushed to $43,200 within hours, offering a perfect long entry!
⸻
Final Thought: Are You Using VWAP & MACD Together?
Many traders use MACD in isolation, but when combined with VWAP & Parabolic SAR, it becomes a powerful confirmation system.
📢 How do you filter out fake breakouts in BTC? Let’s discuss below! 👇
Bitcoin Bybit chart analysis March 7Hello
It's a Bitcoinguide.
If you have a "follower"
You can receive comment notifications on real-time travel routes and major sections.
If my analysis is helpful,
Please would like one booster button at the bottom.
Bitcoin 30-minute chart.
There will be a Nasdaq index announcement at 10:30 in a little while,
6-hour chart MACD dead cross is in progress.
*Red finger movement path
Long position strategy
1. 88,624 dollars long position entry section / cut-off price when purple support line is broken
2. 1st section at the top 1st target -> Top 2nd -> Target in order during the weekend
1st section at the top pink resistance line / green support line sideways to 3rd section
There is a possibility of additional decline from bottom breakout
Please check 4th section at the bottom -> 80,118.5 dollars
Thank you.

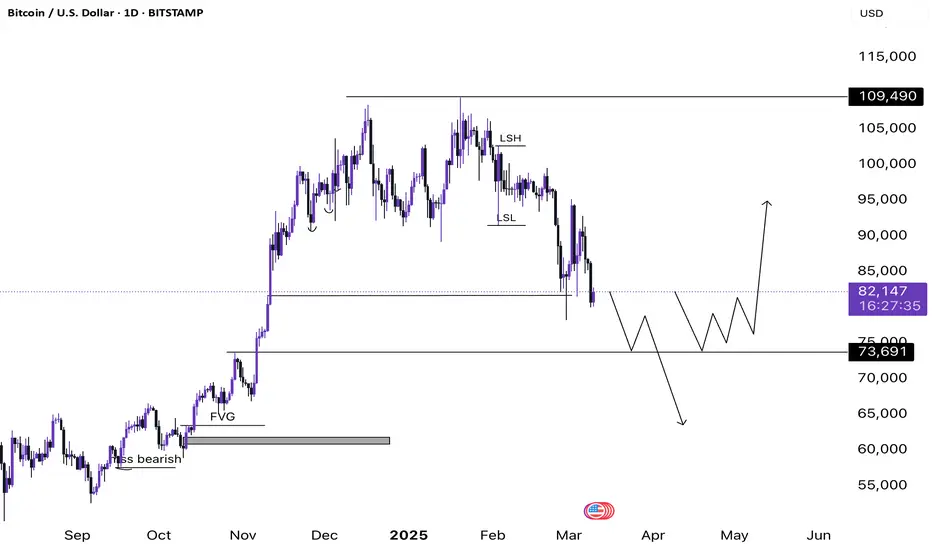
Bitcoin 1D Bear Market Technical Analysis - Bitcoin is currently trading at 82,249$
- Bitcoin has so far erased 24.98% from its All Time Highs and especially after Trump's presidency.
- Market Structure shift looks completely bearish, unless we flip above 96,000$ on a daily timeframe
- We have many inefficiencies left until 73,691$ and I have drawn those paths as well.
- The first path shows price filling the inefficiency and then taking out more liquidity to fall further and clear the fair value gap sitting at about 63,329$
- The second path shows we might not not fall below 73k after filling the inefficiency rather we start building a base before moving towards the upside.
- Market doesn't look good from a structure perspective be very selective when it comes to punching trades.
Sell the rallyBTC CMP 93K
It came down to the support at 83K which i mentioned in my previous post and bounced pretty sharply. Now if it cannot close above 94550 then its again a sell. this time around it will break the 83K as well.
