all you need to knowTHE BULL market is coming to an end
i market the key points of the bear market for now
later on i will update it
i said i will say it again for the alt season to happen
we need a BTC Price range my EXPECTATION is betwenn 65k to 80k
where BTC will rest and the alts will take over but if you want my honest opinion
i dont really see any ALTSEASON happening TO BE HONEST but i just wanted to share my experience and idea.
i will keep you guys updated
stay focused
stay sharp
Trade ideas

BTC Next prediction for 24 hoursPrice is currently hovering near a key support zone, where false breakdowns and whipsaws are common — especially around psychological levels such as $100K.
The descending trendline still suggests a downward bias until a decisive breakout occurs.
A confirmed breakdown below $100K could favor short positions, while a rebound from this level might offer buying opportunities.
According to the 1-hour chart, multiple indicators are showing neutral-to-bullish momentum (Moving Averages: neutral to buy; other indicators: buy).
On the 4-hour timeframe, there’s potential for a hammer or bullish engulfing pattern forming near $100K, signaling possible reversal strength.
Trading Plan (Spot/Leverage):
Buy 1: $99.5K
Buy 2: $96K
Buy 3: $95.5K
Stop Loss: $95K
Target Profit: $105K
Disclaimer:
The information above is for educational and informational purposes only and should not be interpreted as financial, investment, or trading advice. It does not represent a recommendation to buy, sell, or hold any asset. Cryptocurrency trading involves significant risk, including the potential loss of your entire investment. Past performance is not indicative of future results.


Derivatives Trading Strategies and Option Trading ExplainedUnderstanding Derivatives
A derivative is a financial contract whose value depends on the performance of an underlying asset. Common derivatives include:
Futures contracts: Agreements to buy or sell an asset at a future date at a predetermined price.
Forwards: Similar to futures but traded over-the-counter (OTC), meaning they are privately negotiated.
Options: Contracts that give the holder the right, but not the obligation, to buy or sell an asset.
Swaps: Agreements to exchange cash flows or other financial instruments.
Derivatives help investors manage price risk, hedge exposure, or profit from volatility. However, they also carry significant leverage, which can amplify both profits and losses.
Major Derivative Trading Strategies
1. Hedging Strategies
Hedging is a risk management approach used to protect against adverse price movements. For instance, a farmer expecting to sell wheat in three months can use futures contracts to lock in the selling price, ensuring stable revenue even if prices fall later. Similarly, companies dealing in foreign currencies use currency futures or options to protect themselves from exchange rate volatility.
Example:
A portfolio manager holding large equity exposure may use index futures to hedge against a potential market downturn. If the market falls, losses in the stock portfolio can be offset by gains in the futures position.
2. Speculative Strategies
Speculators use derivatives to profit from anticipated price movements. They take positions based on their market outlook without owning the underlying asset.
For example, if a trader expects oil prices to rise, they might buy oil futures to benefit from price appreciation. If the prediction is correct, the trader profits from the difference between the buying and selling price.
Speculative trades are risky but can offer high rewards due to leverage. However, they require careful risk control to avoid substantial losses.
3. Arbitrage Strategies
Arbitrage exploits price discrepancies of the same asset across different markets or forms. Traders buy the asset where it’s undervalued and sell it where it’s overvalued, locking in risk-free profits.
Example:
If a stock’s price in the cash market differs from its futures price beyond theoretical limits, an arbitrageur can simultaneously buy the stock and sell the future, profiting when prices converge.
4. Spread Trading
Spread trading involves taking offsetting positions in related derivatives to profit from the price difference between them rather than outright price movements. Examples include:
Calendar spreads: Buying and selling futures with different expiry dates.
Inter-commodity spreads: Trading between related commodities, like crude oil and heating oil.
Inter-market spreads: Exploiting price differences between similar assets on different exchanges.
These strategies reduce exposure to market direction and focus on relative performance.
Introduction to Option Trading
Options are among the most versatile derivative instruments. An option contract gives the buyer the right, but not the obligation, to buy or sell an asset at a predetermined price (called the strike price) before or at the contract’s expiration date.
There are two main types of options:
Call Option: Gives the holder the right to buy the underlying asset.
Put Option: Gives the holder the right to sell the underlying asset.
The seller (or writer) of the option has the obligation to fulfill the contract if the buyer chooses to exercise it. Option trading strategies range from simple directional bets to complex multi-leg structures designed to profit in various market conditions.
Key Components of Option Trading
Premium: The price paid by the option buyer to the seller for the contract.
Strike Price: The price at which the asset can be bought or sold.
Expiration Date: The date the option contract expires.
Intrinsic Value: The actual value if the option were exercised today.
Time Value: The additional value based on volatility and time remaining until expiration.
Options are influenced by factors such as volatility, interest rates, time decay, and the price of the underlying asset.
Option Trading Strategies
1. Directional Strategies
These strategies aim to profit from a forecasted price move.
a) Long Call
A trader buys a call option expecting the asset’s price to rise.
Profit: Unlimited as price increases.
Loss: Limited to the premium paid.
Example: Buying a call on Nifty at 22,000 strike if you expect it to rise above that level.
b) Long Put
Used when expecting a decline in price.
Profit: Rises as asset price falls.
Loss: Limited to the premium paid.
c) Short Call and Short Put
Writing calls or puts allows traders to collect premiums, but they face potentially unlimited loss if the market moves against them. These are generally used by experienced traders or those with a hedge in place.
2. Neutral Strategies
When traders expect little movement, they use strategies that benefit from time decay or low volatility.
a) Covered Call
The trader holds the underlying asset and sells a call option on it.
Generates income from the premium.
Ideal when expecting limited upside.
b) Iron Condor
Combines both call and put spreads to earn premium income when the asset stays within a range.
Profit: Limited to net premium received.
Loss: Limited if price breaks out of the range.
c) Butterfly Spread
Involves buying one in-the-money option, selling two at-the-money options, and buying one out-of-the-money option. It profits when prices remain stable around the middle strike.
3. Volatility Strategies
These strategies target changes in volatility rather than price direction.
a) Straddle
Buying both a call and put at the same strike price and expiry.
Profits from large price movements in either direction.
Loss occurs if the price remains stable (premium decay).
b) Strangle
Similar to a straddle but uses different strike prices for the call and put. It is cheaper but requires a larger move to profit.
c) Calendar Spread
Involves buying and selling options of the same strike but different expiration dates, betting on changes in time decay or volatility.
Risk Management in Derivative Trading
Derivatives and options can magnify returns but also amplify losses. Therefore, risk management is critical:
Position sizing: Limit exposure to a fixed percentage of total capital.
Stop-loss orders: Automatically exit losing positions.
Diversification: Spread trades across assets and maturities.
Hedging: Use options to protect portfolios against extreme moves.
Greeks management: Monitor option sensitivities—Delta (price movement), Theta (time decay), Vega (volatility), and Gamma (rate of Delta change)—to understand risk dynamics.
Conclusion
Derivatives and option trading represent a sophisticated domain within financial markets, offering vast opportunities for hedging, speculation, and income generation. While derivatives like futures and forwards help manage risk or exploit arbitrage opportunities, options add flexibility through their asymmetrical payoff structure. Mastering derivatives requires understanding market behavior, volatility, and strategic planning. When used responsibly, derivatives can protect portfolios and generate consistent returns. However, due to leverage and complexity, disciplined risk control and continuous learning are essential for long-term success.

BTC live market sell tradeTook Live Btc sell side trade
buy exit?
there is Daily fvg. that might be Btc will turn back


BTC USD ANALYSIS LIVEBTC USD ANALYSIS LIVE
BTC Will also took liquidity beyond and buy bank rang again , tight sl required.

Part 2 How to Draw Accurate Support and Resistance LevelsParticipants in Option Trading
There are four primary participants in the options market:
Buyer of Call Option (Long Call) – Expects the price to rise.
Seller of Call Option (Short Call) – Expects the price to fall or remain flat.
Buyer of Put Option (Long Put) – Expects the price to fall.
Seller of Put Option (Short Put) – Expects the price to rise or remain flat.
Each participant has a specific risk-reward profile. Option buyers have limited risk (the premium paid) and unlimited profit potential. Option sellers, on the other hand, have limited profit (premium received) but potentially unlimited risk.

Option Chain: Powerful Tools for Traders and Investors1. What is an Option Chain?
An option chain, also known as an option matrix, lists all the available call and put options for a specific security. Each row represents an individual option contract with its strike price, expiry date, premium, and other key metrics. It helps traders compare multiple options to make informed decisions about trading strategies.
For example, on the NSE (National Stock Exchange of India), you can view the option chain for NIFTY 50, Bank NIFTY, or any stock. It displays both Call Options (CE) on the left and Put Options (PE) on the right.
2. Basic Terms in an Option Chain
a. Call Option (CE)
A Call Option gives the buyer the right, but not the obligation, to buy the underlying asset at a predetermined price (strike price) before or on the expiration date. Buyers of calls expect the underlying price to rise, while sellers (writers) of calls expect it to stay the same or fall.
b. Put Option (PE)
A Put Option gives the buyer the right, but not the obligation, to sell the underlying asset at a predetermined strike price before or on expiration. Buyers of puts expect the underlying asset’s price to fall, while sellers expect it to stay the same or rise.
c. Strike Price
The strike price is the price at which the option holder can buy (for a call) or sell (for a put) the underlying asset. Option chains list multiple strike prices around the current market price of the asset.
Example:
If NIFTY is trading at 22,000, the option chain may show strikes like 21,900, 22,000, 22,100, etc.
d. Expiry Date
The expiry date (or expiration date) is the date when the option contract ceases to exist. In India, options can have weekly or monthly expiries.
Weekly options expire every Thursday.
Monthly options expire on the last Thursday of the month.
After expiry, the option either becomes worthless (out-of-the-money) or is settled for profit/loss (in-the-money).
e. Option Type
Each contract specifies whether it is a Call (CE) or Put (PE). Traders choose the type based on their market outlook:
Bullish traders buy Calls or sell Puts.
Bearish traders buy Puts or sell Calls.
3. Option Chain Data Columns Explained
Each row in an option chain contains various data points. Let’s decode them one by one.
a. Last Traded Price (LTP)
The Last Traded Price is the most recent price at which the option contract was traded. It indicates the current market value or premium of the option.
Example:
If NIFTY 22,000 CE LTP = ₹120, that means the last buyer paid ₹120 for that call option.
b. Change and % Change
This shows how much the premium has moved compared to the previous trading session.
Change = LTP today – LTP yesterday
% Change = (Change / Previous LTP) × 100
It helps traders track intraday momentum and volatility.
c. Bid Price & Ask Price
Bid Price: The highest price a buyer is willing to pay.
Ask Price: The lowest price a seller is willing to accept.
The difference between them is the Bid-Ask Spread, which shows liquidity—narrow spreads indicate higher liquidity.
d. Bid Quantity & Ask Quantity
These represent how many contracts traders are willing to buy or sell at the bid or ask price.
Example:
If Bid Quantity = 1,200, it means traders want to buy 1,200 contracts at the bid price.
e. Open Interest (OI)
Open Interest is one of the most important metrics in an option chain. It represents the total number of outstanding (open) option contracts that have not been settled yet.
Rising OI indicates new positions being created.
Falling OI means positions are being squared off.
Interpretation Example:
Price ↑ and OI ↑ → Strong trend continuation (bullish).
Price ↓ and OI ↑ → Bearish trend strengthening.
Price ↑ and OI ↓ → Short covering.
Price ↓ and OI ↓ → Long unwinding.
f. Change in Open Interest
This shows how much the OI has changed compared to the previous session. It helps identify whether traders are entering new positions or exiting existing ones.
g. Volume
Volume indicates the number of option contracts traded during the day.
High volume shows active trading and high liquidity.
h. Implied Volatility (IV)
Implied Volatility reflects the market’s expectation of future volatility in the underlying asset.
High IV → Expensive premiums (greater uncertainty).
Low IV → Cheaper premiums (stable markets).
Traders use IV to assess whether options are overpriced or underpriced.
i. LTP vs. IV Relationship
If IV rises, option premiums generally increase (even if the underlying doesn’t move).
If IV falls, premiums tend to decline.
j. Intrinsic Value and Time Value
Each option premium consists of:
Intrinsic Value: The actual value if the option were exercised now.
Time Value: The extra value based on time to expiry and volatility.
Example:
If NIFTY = 22,100 and Call Strike = 22,000,
then Intrinsic Value = 100 (22,100 – 22,000).
4. In-the-Money (ITM), At-the-Money (ATM), Out-of-the-Money (OTM)
a. For Call Options:
ITM: Strike < Current Price
ATM: Strike ≈ Current Price
OTM: Strike > Current Price
b. For Put Options:
ITM: Strike > Current Price
ATM: Strike ≈ Current Price
OTM: Strike < Current Price
Traders often focus on ATM and nearby strikes, as they have higher liquidity.
5. Option Chain Analysis Techniques
a. OI Analysis
By comparing Call OI and Put OI, traders can estimate support and resistance levels:
High Call OI → Resistance zone (sellers active).
High Put OI → Support zone (buyers active).
b. Put-Call Ratio (PCR)
PCR = Total Put OI / Total Call OI
PCR > 1 → More Puts, bullish sentiment.
PCR < 1 → More Calls, bearish sentiment.
Traders use PCR as a contrarian indicator when extreme values appear.
c. Max Pain Theory
The Max Pain point is the strike price where the combined loss for option buyers is maximum and sellers benefit most.
At expiry, the underlying price often gravitates toward this level due to hedging and unwinding activity.
6. Real-World Example (NIFTY Option Chain)
Suppose NIFTY = 22,000, and we analyze the option chain:
Strike Call OI Put OI CE LTP PE LTP
21,900 25,000 10,000 160 70
22,000 30,000 28,000 120 120
22,100 45,000 20,000 80 160
Interpretation:
Strong Call OI at 22,100 → Possible resistance.
Strong Put OI at 22,000 → Possible support.
Market range: 22,000–22,100.
7. Advanced Option Chain Terms
a. Delta
Measures how much an option’s price moves for every ₹1 change in the underlying.
Call Delta: 0 to +1
Put Delta: 0 to –1
Example: Delta = 0.5 means the premium moves ₹0.50 for every ₹1 move in the asset.
b. Theta
Represents time decay—how much the option loses in value each day as expiry nears.
c. Gamma
Shows the rate of change of Delta. High Gamma means Delta will change rapidly with price movements.
d. Vega
Measures sensitivity of an option’s price to changes in volatility. High Vega means the option is more affected by IV changes.
e. Rho
Represents sensitivity of option price to interest rate changes.
8. Conclusion
Understanding option chain terms is essential for anyone involved in derivatives trading. The data helps traders:
Gauge market sentiment (bullish or bearish).
Identify support/resistance zones through OI.
Track volatility via IV.
Recognize trading opportunities through volume and price changes.
A skilled trader doesn’t just read numbers — they interpret the psychology behind them. With consistent analysis, the option chain becomes not just a data sheet, but a strategic roadmap for profitable trading decisions in dynamic markets like India’s NSE.
BTC 8R Sell scenario.........BTC is in downtrend in daily timeframe and shown sniper delivery, now it is in pullback mode. We may anticipate a good short term trade on hourly time frame around hourly FVG
1. HTF MSS is already done and price is reverting to FVG after BOS.
2. Daily quadrant cluster is also falling around FVG. Which is giving us some more critical levels of price reversal.
3. RSI has already shown bearish divergence on hourly TF.
4. Most probably price will take liquidity of FVG and create MSS/CISD/TS/iFVG in LTF.
5. Price should show rejection/reversal in respective LTF (5m/15m) at FVG zone.
6. Take the trade only once clear entry model i.e. turtle soup. iFVG break, CDS or MSS happens on LTF
All these combinations are signalling a high probability and ~8R trade scenario.
Note – if you liked this analysis, please boost the idea so that other can also get benefit of it.
Also follow me for notification for incoming ideas.
Also Feel free to comment if you have any input to share.
Disclaimer – This analysis is just for education purpose not any trading suggestion. Please take the trade at your own risk and with the discussion with your financial advisor.

BTCUSDBitcoin is in a downtrend.
Currently falling off the supply zone, @106 lvl.
Will be monitoring closely the demand, other then that first low is logical target.

BTC current week update and explanation BTC is still inside a short-term downtrend but is showing signs of base formation / potential reversal.
BTC has lower highs and lower lows = still technically bearish.
EMA 20 ≈ slightly below EMA 50 → still bearish crossover. But candles are hovering near the EMAs, meaning bearish momentum is weakening.
Volume is flat to decreasing during price drops — indicating seller exhaustion. If a breakout occurs on strong volume, it’ll be a strong bullish confirmation.
BTC is currently trading below a descending trendline, showing the sellers still in control.
A daily candle close above $107K would signal a potential trend reversal.
The information and analysis provided are for educational and informational purposes only. This does not constitute financial, investment, or trading advice.

Relative Strength Index (RSI) Indicator Secrets1. The Hidden Meaning Behind RSI Levels
Most traders use the 70/30 rule blindly. In reality, RSI levels are relative, not absolute. For instance:
In a strong uptrend, RSI can remain above 70 for a long period — this does not mean the market will immediately reverse. It often indicates strong bullish momentum.
In a downtrend, RSI can stay below 30 for an extended time — signaling strong bearish pressure, not necessarily an immediate bounce.
Secret Tip:
Adjust your RSI levels based on market conditions:
Bullish market: Use RSI zones of 40–80 (support around 40, resistance around 80).
Bearish market: Use RSI zones of 20–60 (resistance around 60, support around 20).
By doing this, you interpret RSI in the context of trend strength rather than treating it as an isolated signal.
2. RSI as a Trend Identifier
One of the most overlooked uses of RSI is trend confirmation. Traders often rely on moving averages or price patterns to identify trends, but RSI can do this more efficiently.
In uptrends, RSI tends to stay above 40 and frequently reach 70–80.
In downtrends, RSI remains below 60 and often hits 20–30.
Secret Insight:
If RSI repeatedly bounces from the 40–50 zone during a price pullback, it suggests that the uptrend is healthy. Conversely, if RSI fails to move above 60 during rallies, it signals weakness in the market.
This method helps traders stay with the trend longer, instead of prematurely exiting a position when RSI crosses traditional overbought or oversold levels.
3. RSI Divergence – The Ultimate Reversal Signal
RSI divergence is one of the strongest signals for trend reversal. It occurs when the price makes a new high or low that isn’t confirmed by the RSI.
Bullish Divergence: Price makes a lower low, but RSI makes a higher low — signaling potential upward reversal.
Bearish Divergence: Price makes a higher high, but RSI makes a lower high — indicating possible downward reversal.
Secret Tip:
For divergence to be effective, it must occur after a strong trend and be confirmed by volume or candlestick patterns (like Doji, hammer, or engulfing). Many traders lose money by trading every small divergence — patience is key.
Additionally, hidden divergence can predict trend continuation:
Hidden Bullish Divergence: RSI makes a lower low, but price makes a higher low → continuation of uptrend.
Hidden Bearish Divergence: RSI makes a higher high, but price makes a lower high → continuation of downtrend.
Combining regular and hidden divergences can give traders early entry signals and improve accuracy.
4. RSI Swing Rejections: The Secret Entry Technique
Welles Wilder’s original writings described an advanced RSI technique called “Swing Rejection”, which most traders overlook.
A bullish swing rejection occurs when:
RSI drops below 30 (oversold zone).
It rises above 30.
Pulls back but stays above 30.
Then breaks its previous high.
This pattern signals a strong bullish reversal — often before the price fully turns up.
A bearish swing rejection is the opposite:
RSI rises above 70.
Falls below 70.
Rebounds but fails to cross 70 again.
Then breaks its prior low — confirming weakness.
Secret Insight:
Swing rejections filter out false overbought/oversold signals and identify high-probability turning points in the market.
5. RSI with Multiple Time Frames
Professional traders rarely rely on a single RSI setting or timeframe. Instead, they confirm RSI signals across multiple timeframes.
For example:
If the daily RSI is oversold but the weekly RSI is still in a downtrend, the bounce may be short-lived.
When both daily and weekly RSI align in the same direction, it indicates a powerful trend reversal or continuation.
Secret Tip:
Use RSI(14) on higher timeframes (daily/weekly) for trend bias, and RSI(7) or RSI(9) on lower timeframes (hourly or 4-hour) for precise entries.
6. RSI and Moving Averages – A Smart Combination
Combining RSI with moving averages creates a more reliable trading system. For example:
Use a 50-period moving average to determine the trend direction.
Trade RSI signals only in the direction of the moving average.
Example:
If the price is above the 50-MA and RSI bounces from 40 → it’s a strong buy signal.
If the price is below the 50-MA and RSI drops from 60 → it’s a strong sell signal.
This combination filters out false signals and aligns trades with the dominant market trend.
7. RSI Range Shifts – The Professional Secret
A rarely discussed RSI secret is the concept of range shifts. In a strong uptrend, RSI tends to move between 40–80 instead of 30–70. In a strong downtrend, it shifts between 20–60. Recognizing this range shift early helps traders identify when the market transitions from sideways to trending behavior.
When RSI consistently fails to fall below 40 and pushes above 70, it confirms that bulls control the market. Conversely, when RSI struggles to rise above 60 and keeps hitting 30, bears dominate.
Spotting a range shift early can help you enter trends sooner and ride them longer.
8. Customizing RSI Periods for Different Assets
Most traders use the default 14-period RSI. However, adjusting the period can dramatically change its responsiveness:
Shorter RSI (5 or 7): More sensitive, gives early signals but more noise.
Longer RSI (20 or 30): Smoother, fewer false signals but more lag.
Secret Tip:
For volatile instruments like cryptocurrencies or small-cap stocks, use a shorter RSI (7–10).
For stable assets like large-cap stocks or indices, use longer RSI (14–21).
Customizing RSI settings according to volatility improves accuracy and reduces whipsaws.
9. Psychological Secrets of RSI
At its core, RSI reflects market psychology — the tug-of-war between buyers and sellers. When RSI rises above 70, it shows traders’ greed; when it falls below 30, it reveals fear. Understanding this helps you trade in the opposite direction of crowd emotions.
The best traders use RSI not just as a technical tool, but as a window into trader sentiment. Combining RSI readings with support/resistance zones or volume analysis offers a powerful edge.
10. Conclusion
The RSI indicator is far more than a simple overbought/oversold tool. Its true strength lies in understanding context, trend structure, divergence, and range behavior. By mastering RSI’s hidden secrets — such as swing rejections, range shifts, and multiple timeframe confirmations — traders can dramatically improve accuracy and timing.
When used intelligently, RSI reveals the rhythm of market momentum and helps traders ride trends, spot reversals, and stay on the right side of price action. Like all tools, it works best when combined with sound risk management, patience, and discipline — the true secrets behind profitable trading.
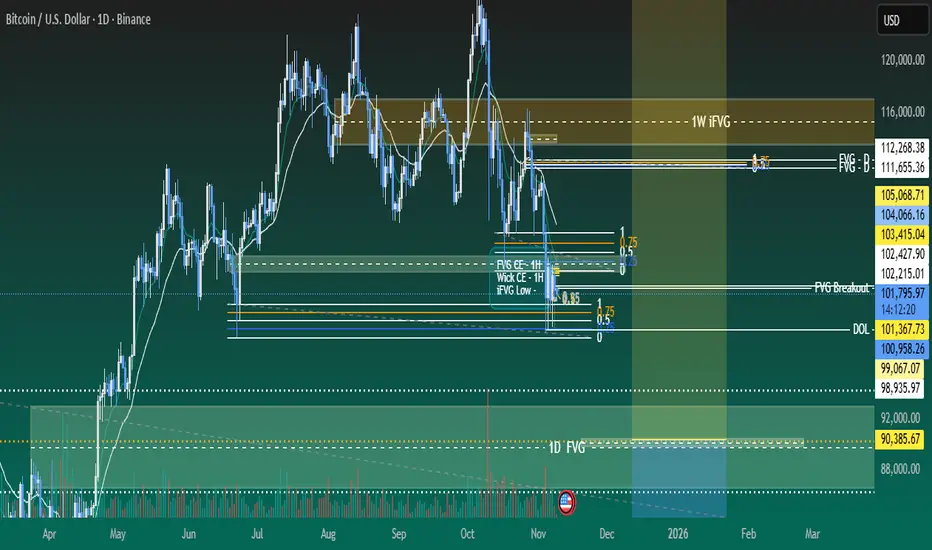
Fair Value Gap Retracements in a Downtrend📈 BTC/USD – Understanding Fair Value Gap Retracements in a Downtrend
The current market structure on the daily timeframe highlights a clear bearish trend, where price continues to form lower highs and lower lows.
After a strong downward impulse, a Fair Value Gap (FVG) has formed — representing an area of imbalance that price may eventually retrace to before deciding its next move.
This setup reflects a potential rebalancing phase within the ongoing downtrend.
⸻⸻⸻⸻⸻⸻⸻⸻⸻⸻
📊 Key Observations
1️⃣ FVG Formation — A bearish Fair Value Gap has emerged following a strong sell-side move, signaling a region of inefficiency left behind by aggressive sellers.
2️⃣ Retracement Possibility — Price may attempt to retrace into the FVG zone to rebalance this inefficiency before continuing its primary downtrend.
3️⃣ Potential Rejection Zone — If price reacts negatively from the FVG, it could confirm continued bearish sentiment and lead to another lower low.
4️⃣ Trend Context — The overall market remains under a descending structure, with sellers maintaining control as long as price stays below the FVG zone.
⸻⸻⸻⸻⸻⸻⸻⸻⸻⸻
📊 Chart Explanation
Symbol → BINANCE:BTCUSD
Timeframe → 1D
This chart illustrates how a Fair Value Gap (FVG) functions as a key retracement zone within a broader bearish structure. The price action shows a sequence of lower highs and lower lows, confirming a prevailing downtrend.
After a strong downward impulse, price created a bearish FVG — highlighted in red — representing an imbalance area where institutional orders may remain unfilled. Price is now retracing upward, likely to fill this inefficiency.
If the market faces rejection from this FVG zone, it could signal the continuation of the ongoing bearish momentum. However, a clean break and close above it might hint at a short-term structural shift.
Below the current price, a liquidity pool zone is marked — an area where stop-losses likely reside. Price often sweeps such zones to collect liquidity before reversing, aligning with Smart Money behavior.
Overall, this setup showcases how identifying FVGs within market structure helps traders anticipate rebalancing phases, retracements, and potential reaction points in trending markets.
⸻⸻⸻⸻⸻⸻⸻⸻⸻⸻
✅ Summary
• The Fair Value Gap acts as a magnet zone where price may retrace to fill inefficiency.
• A rejection from the FVG could resume bearish continuation.
• A confirmed close above the FVG might hint at short-term strength or structural shift.
• Traders should observe price behavior within this zone for potential rebalancing reactions.
⸻⸻⸻⸻⸻⸻⸻⸻⸻⸻
⚠️ Disclaimer:
📘 For educational purposes only.
🙅 Not SEBI registered.
❌ Not a buy/sell recommendation.
🧠 Purely a learning resource.
📊 Not Financial Advice.


BTC/USD Bullish Pennant – Breakout Entry SetupBTC/USD Bullish Pe✅ BTC/USD Pennant Breakout – Technical Analysis
Chart Breakdown
The chart shows Bitcoin forming a bullish pennant pattern on the 45-min timeframe.
A pennant typically forms after a strong impulsive move (pole), followed by price compression between:
Descending trendline (upper)
Ascending/flat trendline (lower)
This usually signals continuation in the direction of the previous trend, which in this case is upward.
Key Levels
Entry Zone: Just above the pennant resistance (breakout zone).
Stop-Loss: Below the pennant support — good risk management.
Target: Projected by measuring the previous impulse (the pennant pole) and extending it upward.
Market Signals
✔ Price is squeezing near the apex — breakout imminent.
✔ Buyers appear to be defending the lower trendline.
✔ If price breaks and closes above resistance, upside continuation becomes likely.
✘ But if price rejects and falls below support, the setup invalidates.
Bias
Bullish Continuation – If breakout occurs with strong volume.

Part 2 Intraday Master ClassParticipants in Option Trading
Option Buyers (Holders):
Pay premium to gain the right to buy/sell.
Risk limited to the premium.
Aim to profit from favorable price movement.
Option Sellers (Writers):
Receive premium from buyers.
Take on potential unlimited risk.
Often use strategies to generate income.

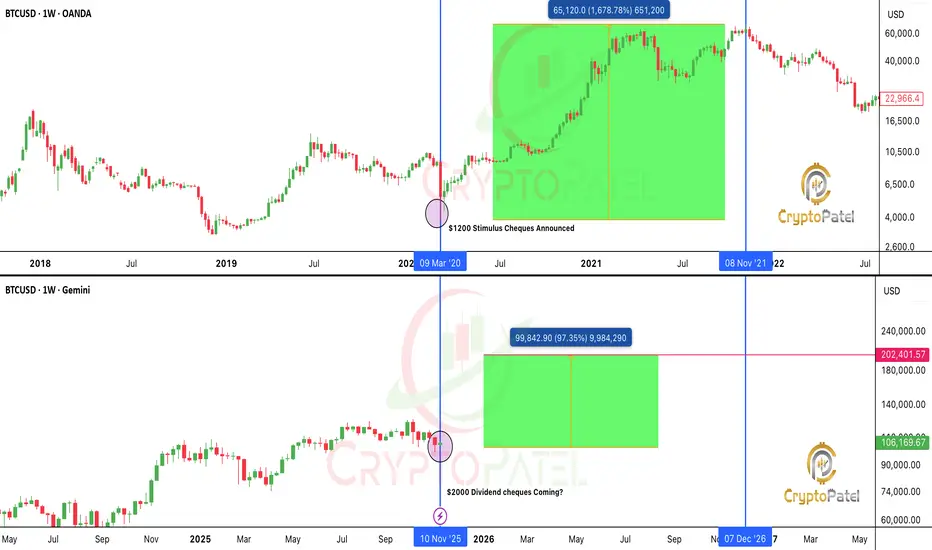
Trump’s $2,000 stimulus = $600B Liquidity: Bitcoin To the Moon?Trump’s $2,000 Stimulus Could Light the Fuse for the Biggest Crypto Rally Ever
This isn’t just another political headline.
If Trump’s plan to send $2,000 stimulus checks funded by tariff dividends actually happens, it could unleash a $600 billion liquidity wave into the economy.
That’s nearly the same scale as the 2020 stimulus, which kicked off one of the most legendary bull runs in history.
🔹 Bitcoin skyrocketed from $3,800 to $69,000
🔹 Ethereum exploded from $90 to $4,800
🔹 Altcoins went absolutely wild, 50x, 100x, even more
But here’s the twist...
This time, the setup is 10x stronger.
In 2020, those checks were about survival, paying rent, buying food, covering bills.
Crypto was new. ETFs didn’t exist. Institutions were on the sidelines.
Now? The game has completely changed.
✅ Crypto is mainstream
✅ Bitcoin ETFs are live
✅ Institutions are ready to buy
✅ Retail access is everywhere
✅ The U.S. economy is growing, not crashing
In 2020, people used stimulus to survive.
In 2025, they’ll use it to invest.
When money flows into a market that’s already primed for risk...
That’s not just bullish, that’s explosive.
The 2020 checks fueled a survival rally.
The 2025 checks could ignite a speculation supercycle.
Imagine $600 billion pouring into a global asset class that’s waiting for liquidity.
Bitcoin. Ethereum. Solana. AI coins. RWA tokens. Meme coins.
History doesn’t repeat but it sure does rhyme.
And this rhyme could make millionaires all over again.
NFA & DYOR
Weekly analysis BTC with 4R trade ideaLast weeks’ trade has performed well and already moved ~15K points and still going on. Further to this week analysis, we expect good reversal trade from the zone of 89700 to 90385. Still we have ~11k points movement pending to reach to this level. Price would be showing weakness in sell side and reversal pattern. We should patiently wait for entry model and confirmation as price is in sell side.
1. 1D FVG and wick is creating strong cluster of their relevant CE levels.
2. We would see exaction in sell side movement and reversal pattern.
3. RSI will also show oversold or bearish divergence on HTF.
4. Most probably price will take liquidity of FVG and create MSS/CISD/TS/iFVG in LTF.
5. Price should show rejection/reversal in respective LTF (1H/15m) at FVG zone.
6. Take the trade only once clear entry model i.e. turtle soup. iFVG break, CDS or MSS happens on LTF
All these combinations are signalling a high probability and ~4R trade scenario.
Note – if you liked this analysis, please boost the idea so that other can also get benefit of it.
Also follow me for notification for incoming ideas.
Also Feel free to comment if you have any input to share.
Disclaimer – This analysis is just for education purpose not any trading suggestion. Please take the trade at your own risk and with the discussion with your financial advisor.
,
Buying start buying on dip risk reward good on buy trade 112k Bitcoin start buying on dip 112k to 114k upside possible, levels given on chart.
How My Harmonic pattern projection Indicator work is explained below :
Recent High or Low :
D-0% is our recent low or high
Profit booking zone ( Early / Risky entry) : D 13.2% -D 16.1 % is
range if break them profit booking start on uptrend or downtrend but only profit booking, trend not changed
SL reversal zone (Safe entry ) : SL 23.1% and SL 25.5% is reversal zone if break then trend reverse and we can take reverse trade
Target : T1, T2, T3, T4 and .
Are our Target zone
Any Upside or downside level will activate only if break 1st level then 2nd will be active if break 2nd then 3rd will be active.
Total we have 7 important level which are support and resistance area
Until , 16% not break uptrend will continue if break then profit booking will start.
If break 25% then fresh downtrend will start then T1, T2,T3 will activate
1,3,5,10,15,20 minutes are short term levels.
30 minutes 60 minutes , 2 hours,3 hours, ... 1 day and 1 week chart positional and long term levels

Retest to 100000-99500 possible for BTC Observing the previous price action a retest of 99500-100000 is possible before further bullish momentum
Price below 98500 is invalid and volatility to be unleashed
#onetradeaday
