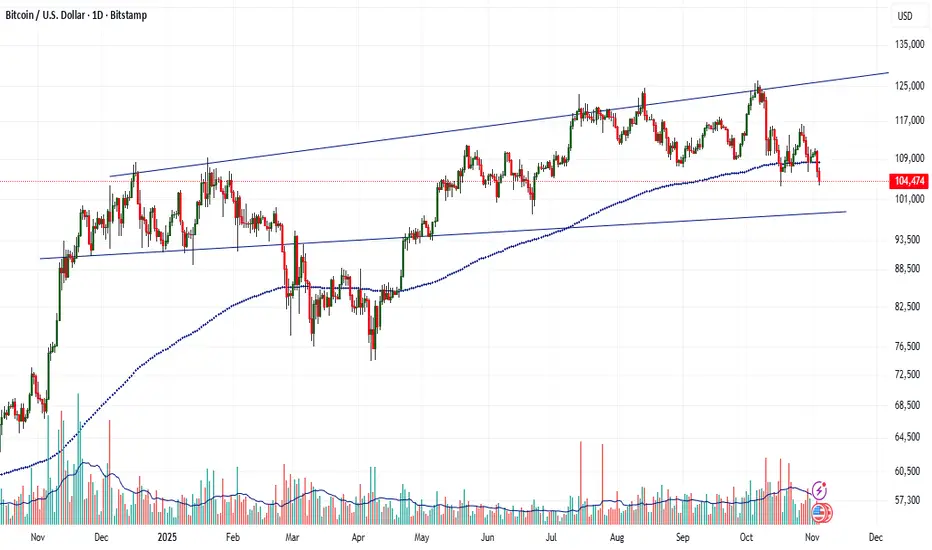
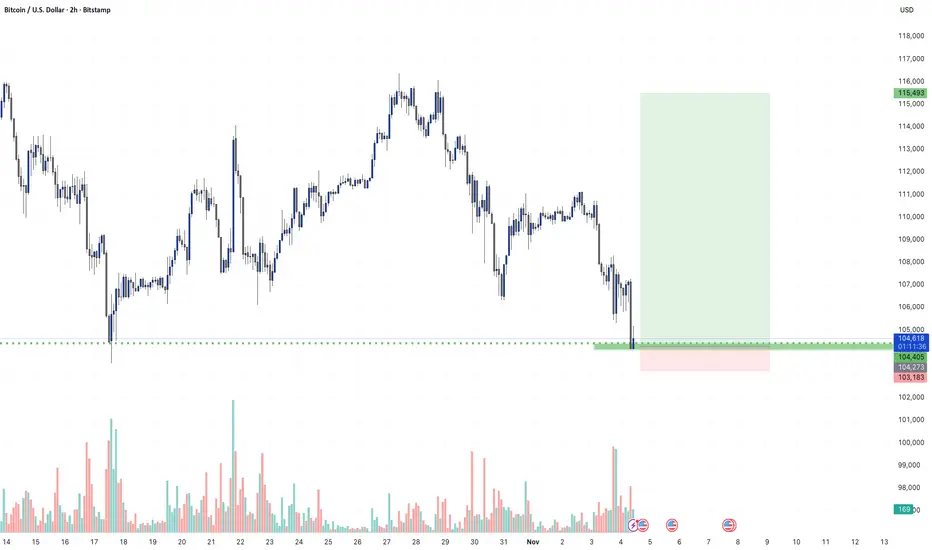
Retest to 100000-99500 possible for BTC Observing the previous price action a retest of 99500-100000 is possible before further bullish momentum
Price below 98500 is invalid and volatility to be unleashed
#onetradeaday
Trade ideas

BTC declining towards 98800scalping from 102350 to 98800
SL is 103250
around 3000 point down move possible
1:4 Ratio

Btc signals at it peak even on weekends This chart setup gives you best intraday setups for bitcoin with a min of 70% accuracy
One trade a day keeps poverty away and a lambo in your lawn ✅

AI-Driven Economies: Boon or Inflation Trap?1. The Economic Boon of AI
a. Productivity Revolution
One of AI’s most powerful contributions lies in its ability to enhance productivity. Unlike previous technological shifts that replaced physical labor, AI enhances cognitive productivity. Algorithms can analyze massive datasets, make real-time decisions, and optimize operations that humans could never process at similar speed or accuracy.
For instance, AI-driven automation in manufacturing reduces downtime, minimizes errors, and lowers production costs. In the service sector, AI chatbots and recommendation engines improve customer experiences while cutting operational costs. As a result, output per worker increases — a key driver of GDP growth.
b. Innovation and New Industry Creation
AI is not just optimizing existing industries but creating entirely new ones. The rise of autonomous vehicles, robotics, healthcare analytics, and smart agriculture represents multibillion-dollar markets built around AI innovation. These new sectors attract massive investment, stimulate entrepreneurship, and create high-value jobs in data science, engineering, and software development.
The global AI market, projected to surpass $2 trillion by 2030, has become a cornerstone of modern industrial policy. Nations investing early in AI infrastructure, like the U.S., China, and India, are positioning themselves as leaders in the next phase of the digital economy.
c. Efficiency in Resource Allocation
AI systems enable more efficient use of resources — energy, raw materials, and capital. In agriculture, AI optimizes irrigation and fertilizer use; in finance, it reduces bad loans through predictive risk models; and in logistics, it minimizes fuel consumption by optimizing routes. These efficiencies reduce costs and environmental impact simultaneously — a win-win scenario for businesses and governments alike.
d. Deflationary Forces in the Short Term
Interestingly, AI can initially act as a deflationary force. As automation increases, the cost of goods and services tends to drop because of higher productivity and lower labor costs. For example, AI-driven manufacturing allows companies to produce more at lower costs, passing savings on to consumers. This short-term price stability often supports economic expansion and higher consumer spending.
2. The Inflation Trap: Hidden Risks of AI-Driven Economies
While the short-term gains from AI appear promising, long-term structural challenges could create inflationary pressures and social imbalances.
a. Unequal Distribution of Wealth
AI-driven productivity gains do not always benefit everyone equally. Large corporations that own AI technologies and data infrastructure accumulate significant economic power, while smaller firms and low-skilled workers struggle to keep up. This wealth concentration leads to income inequality, which indirectly fuels inflationary cycles.
When profits are concentrated in a few hands, consumer demand may become skewed — luxury goods prices rise, while basic goods and wages stagnate. As the middle class shrinks, governments may increase fiscal spending and social programs to stabilize consumption, adding inflationary pressure to the system.
b. Wage Polarization and Cost-Push Inflation
AI often automates repetitive, low-skill jobs while creating demand for high-skill technical roles. This “job polarization” leads to wage growth at the top and stagnation at the bottom. Over time, this could produce cost-push inflation, especially in sectors like healthcare, education, and housing — where human labor remains essential and costs cannot easily be automated.
Moreover, displaced workers may require retraining or government support, which increases fiscal spending. This government-driven stimulus, though necessary, can also be inflationary if not managed carefully.
c. Overreliance on Technology and Supply Constraints
AI systems depend on complex supply chains — semiconductors, rare earth elements, and high computing infrastructure. If supply disruptions occur (like during the 2020–2022 global chip shortage), the cost of AI deployment could spike dramatically. Such shortages can trigger supply-side inflation, as companies raise prices to offset rising input costs.
d. Productivity Paradox and the Lag Effect
Historically, major technological innovations take years to translate into widespread productivity gains. While AI promises long-term efficiency, short-term disruptions — such as job losses, retraining costs, and restructuring — can slow growth. If governments and central banks anticipate faster gains than reality delivers, they may overstimulate the economy through loose monetary or fiscal policy, unintentionally fueling inflation.
e. Data Monopoly and Market Power
Another inflationary risk comes from AI-driven monopolies. As large tech firms dominate AI data and computing ecosystems, competition declines. With fewer players controlling markets, they gain pricing power. For instance, if a handful of companies control AI chips or cloud computing, they can increase prices with little resistance — embedding inflation within critical digital infrastructure.
3. The Policy Balancing Act
The challenge for policymakers is to harness AI’s growth potential without allowing it to destabilize inflation and inequality.
a. Investing in Human Capital
Education and reskilling programs are essential to help workers adapt to AI-driven changes. By closing the skill gap, governments can prevent mass unemployment and wage stagnation — two key sources of inflationary pressure. Encouraging AI literacy at all education levels ensures that the workforce evolves alongside technology.
b. Strengthening Competition and Regulation
To prevent monopolistic practices, policymakers must enforce antitrust laws and promote open data ecosystems. Encouraging small and medium enterprises (SMEs) to adopt AI through subsidies or shared platforms can democratize productivity gains, spreading benefits more evenly across the economy.
c. Smart Monetary Policy
Central banks face a unique challenge: distinguishing between AI-driven deflation (from productivity) and AI-driven inflation (from inequality or bottlenecks). Adaptive monetary policies — including real-time data analysis powered by AI itself — could help maintain balance.
d. Sustainable AI Infrastructure
AI consumes significant energy and computing resources. Building green, efficient data centers and investing in renewable energy reduces the risk of cost-driven inflation tied to energy usage.
4. The Long-Term Outlook
If managed wisely, AI could usher in a new era of sustainable, inclusive growth. Imagine economies where AI predicts demand accurately, minimizes waste, and boosts productivity across industries — from healthcare diagnostics to energy optimization. However, without careful regulation and equitable access, AI could deepen divides, distort price structures, and trap economies in persistent inflation.
The real test will be governance — how nations balance innovation with fairness. Economies that combine AI adoption with strong education systems, ethical regulation, and transparent competition policies will likely emerge as winners. Those that allow monopolies, inequality, and resource inefficiencies to spread may find themselves facing an inflationary storm masked as progress.
Conclusion
AI-driven economies are neither pure blessings nor inherent traps — they are complex ecosystems shaped by human choices. Artificial Intelligence can unlock enormous wealth and efficiency, but it can also magnify inflationary risks if benefits are unevenly distributed or poorly regulated.
The future of AI in economics depends not only on technological progress but on policy foresight. Governments, corporations, and societies must collaborate to ensure that AI serves as a tool for inclusive growth rather than a catalyst for inflationary instability. The question, therefore, is not whether AI will reshape economies — it already is — but whether we can guide its power wisely enough to ensure prosperity without falling into the inflation trap.

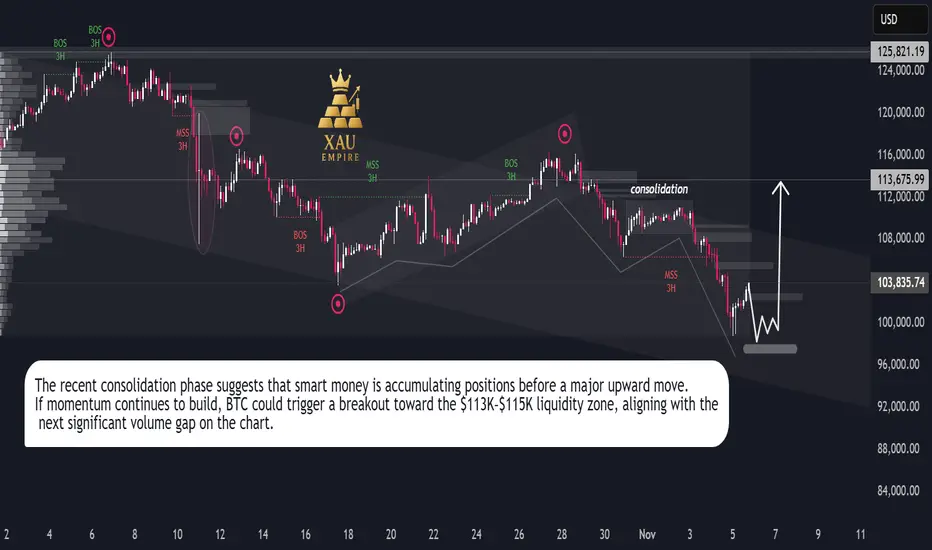
Bitcoin Bulls Target $113K**Bitcoin (BTC/USD) Analysis — November 2025**
Bitcoin has been moving within a controlled downtrend channel, facing continuous lower highs since late October. The market recently went through a **liquidity sweep**, followed by a minor **market structure shift (MSS)** on the 3-hour timeframe. This suggests exhaustion in the current bearish leg.
After a period of **sideways consolidation**, price is testing a strong accumulation zone near the **$100K–$97K** region. This zone aligns with prior demand and high-volume nodes, making it a potential base for a bullish reversal.
A clean rebound from this level could drive Bitcoin toward the **$113K–$115K** area, where the next liquidity cluster sits. If buyers regain momentum, this move could accelerate into a **V-shaped recovery**, confirming the start of a fresh mid-term bullish cycle.
Overall sentiment remains **bullish**, supported by renewed buyer activity and potential macro-driven inflows ahead. Traders should watch for volatility spikes as the market transitions from accumulation to breakout mode.
**Key Takeaway:**
BTC is stabilizing near key demand, eyeing a rebound toward $113K+. Momentum confirmation above the short-term consolidation zone could trigger a strong upward continuation.
**#Bitcoin #BTCUSD #CryptoAnalysis #BitcoinForecast #BTCPricePrediction #CryptoTrading #BullishReversal #CryptoMarket #TradingViewAnalysis**
BTCUSD Nice Price Action!!!!!!Patterns explain way more than words do....
Just look the chart....it explains!!!
Just my view!!!
Thank you!!!!

BITCOIN SHORTlooking for short on BTC since higher time frame took the liquidity and made a LL on HTF. and LTF now aligns with HTF

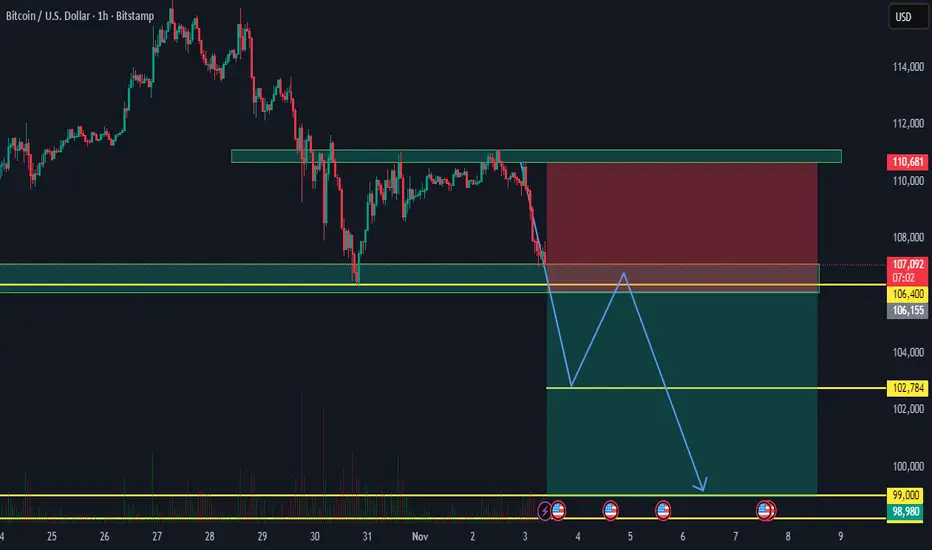
BTC is showing bullish momentum and eyeing further upside.Hi traders! 👋
Wishing you a profitable trading day ahead 💪
Bitcoin is showing signs of recovery after a local pullback.
If the bullish momentum continues, the next targets are:
🎯 TP1: 107,000
🎯 TP2: 110,500
As long as the price stays above 103,000, the bullish scenario remains valid.
A break below this level would cancel the upward setup.
🧠 Stay patient, follow your plan, and let the market come to you.

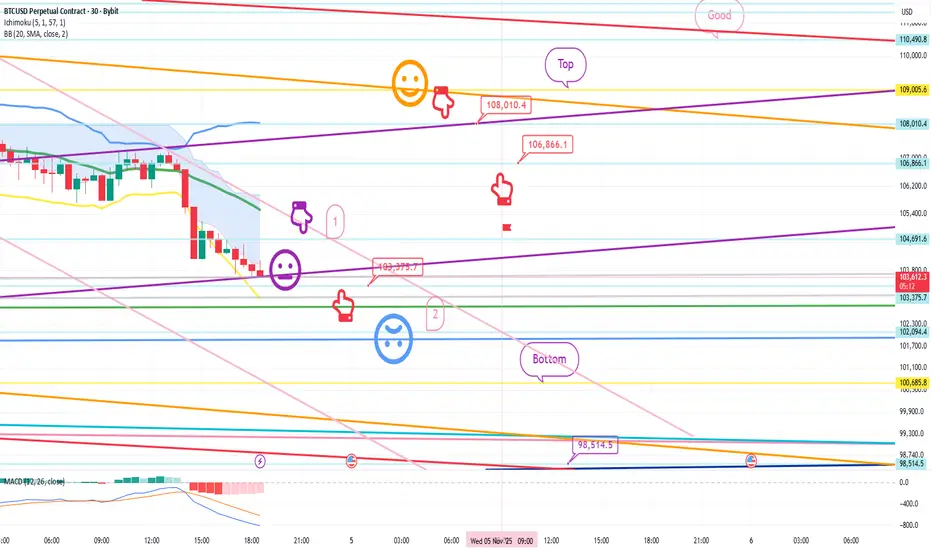
Bitcoin Bybit chart analysis November 4Hello
It's a Bitcoin Guide.
If you "follow"
You can receive real-time movement paths and comment notifications on major sections.
If my analysis was helpful,
Please click the booster button at the bottom.
This is the Bitcoin 30-minute chart.
The Nasdaq indicators will be released shortly at noon.
Due to the end of Daylight Savings Time, we need to move back an hour from the previous chart.
Based on the pattern, the weekly chart reached the Bollinger Band support line,
which is a major support line.
However,
there's also pressure from the MACD dead cross on the monthly chart,
and the possibility of a Nasdaq coupling appears high during a decline.
So,
I developed today's strategy centered on the Nasdaq's lower gap retracement.
*When the red finger moves,
this is a conditional long position strategy.
1. Confirm that the purple finger touches the first section (autonomous short).
$103,375.7 long position entry point / stop loss if the light blue support line is broken.
2. $108,010.4 long position primary target -> Target prices are set at Top, then Good in that order. If the strategy is successful, 106.8K will be the point where you can re-enter a long position.
If the price falls immediately without touching the first point at the top, then the second point is the final long position.
The second point is a double bottom based on the low of this uptrend.
Based on the lower tail, the price is open from the bottom to 98.5K.
It would be wise to prepare for a failure of the Nasdaq decline and rebound.
Please use my analysis to this point for reference only.
I hope you operate safely, with a strict trading strategy and stop-loss orders.
Thank you.
BITCOIN 1HRSWING TRADE
- EARN WITH ME DAILY 10K-20K –
BITCOIN Looking good for Downside..
When it break level 106400 and sustain.. it will go Downside...
SELL @ 106400
Target
1st 102784
2nd 99000
Enjoy trading traders.. Keep add this STOCK in your watch list..
Big Investor are welcome..
Like this Post??? Hit like button..!!!
Follow me for FREE Educational Post and Alert..
Part 1 Intraday Master ClassIntroduction to Options
Option trading is a type of financial trading that gives investors the right—but not the obligation—to buy or sell an underlying asset, such as stocks, indices, commodities, or currencies, at a predetermined price before or on a specific date. Unlike owning the asset itself, an option allows traders to speculate on price movements or hedge against potential risks in the market.
Options are powerful financial instruments because they can be used for leverage, income generation, and risk management. However, they also carry complexity and risk, making education essential for anyone interested in trading them.

BTC New ATH or Low??BTC bounced around the 0.236 level ($98K) — a healthy retracement zone in a strong uptrend.
The corrective structure from ~$125K to ~$95K looks like a wave-4 correction.
The dotted trendline in your chart shows strong ascending support, which has held since early 2023. No major distribution signs yet — volume dips on red candles suggest profit-taking, not panic selling.
Historically, BTC enters a supply squeeze rally 6–12 months post-halving.
Miners’ supply drops, while demand from institutions rises.
Primary short-term support (Fib 0.236)- $98K–$100K
Trendline + previous breakout area- $93K–$95K
Fib 0.382 retracement zone- $82K–$85K
What should be the next goal.

the set up im gonna call this episode the set up
check the trendline
check the overbought
the same scenario same as 2021 i still say idk about the alt season maybe i have zero knowledge but slowly slowly gotta get ready for the bears to take over
also calm down we still have new years eve.
P.S: the only play out i gave for the altseason was 2 3 posts before you can check it out on how i think it will be and where will be bitcoin located at , at that time.
stay focused
stay sharp
sina

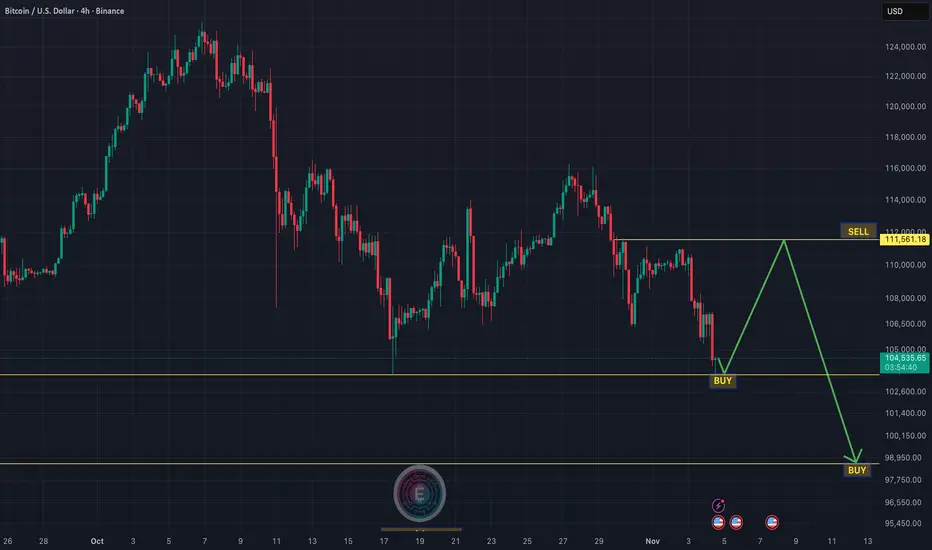
Bitcoin (BTCUSDT) Analysis - 4H TimeframeBitcoin is currently trading near a strong support zone ($104,000–$102,500), which has previously acted as a major accumulation area.
From a technical perspective, BTC seems to be completing the final leg of a correction phase, and I’m expecting a possible bounce from this region toward the upper resistance levels.
I’m taking a long position from current levels ($104,453) with an expectation of a short-term recovery.
My target zone lies near the next resistance area around $112,000, where I’ll look to book partial or full profit and re-analyze the market structure for the next move.
On the 4H chart, BTC appears to be forming the micro wave 5 of the main corrective wave C, which usually signals the end of a downtrend phase.
If the price holds above the PRZ, we could see a strong reversal in the coming sessions.
⚠️ Risk Note:
If BTC breaks below $101,900 with strong momentum, it could invalidate the long setup, and further downside might continue — avoid adding fresh longs below this level.
This is just my analysis idea — not financial advice.
ATTENTION: Bitcoin May Revisit $55K?⚠️ ATTENTION: Bitcoin May Revisit $55K: Here's The HTF Order Block You Need To Know
Don’t panic, this is not a bear market, just a retracement before the next leg up. My current plan:
▶️ Buy Zone: $65,000 – $55,000 (strong support)
▶️ Previous Exit: $122,000 (if you followed my earlier call)
*Chart Insight:*
▶️ 3W timeframe forming an Inverse Head & Shoulders, usually bullish.
▶️ But this pattern is forming near the top, not the bottom → high probability trap.
*Why I’m confident:*
▶️ Strong FVG & Order Block between $65k–$55k = prime re-accumulation zone.
▶️ Next target: $200k – $300k in the medium term.
Patience + strategy > chasing tops. Let the market come to your zones.
NFA & DYOR

Part 12 Trading Master Class With Experts Risks in Option Trading
While options can enhance profits, they also carry risks:
Time Decay (Theta Risk) – Options lose value as they near expiration.
Volatility Risk – Sudden drops in volatility can erode option premiums.
Liquidity Risk – Illiquid options may have wide bid-ask spreads, leading to slippage.
Unlimited Loss Potential for Sellers – Writing naked options can result in huge losses.
Complexity – Understanding the interplay of Greeks and pricing models requires skill and experience.

Bitcoin From $49k to $126k Target Achieved 📢 Hope you didn’t miss this…
On April 7, 2024, I posted my CRYPTOCAP:BTC chart calling for buys below $50K.
Bids filled perfectly at $49K, and price exploded to a new ATH at $126K.
That’s a +157% move, level-to-level, exactly as projected.
No hype: Just pure technical precision and liquidity flow mastery.

Bitcoin from $49k to $126k Target Achieved 📢 Hope you didn’t miss this…
On April 7, 2024, I posted my CRYPTOCAP:BTC chart calling for buys below $50K.
Bids filled perfectly at $49K, and price exploded to a new ATH at $126K.
That’s a +157% move, level-to-level, exactly as projected.
No hype: Just pure technical precision and liquidity flow mastery.

LONG TERM GOALS WITH BTC After analyzing BTC data over the past 0 TO ATH, this level stands out as the true zone for a potential pullback — a key area where the market shows genuine reaction and accumulation before the next move.
Currency Trading in India (USD/INR, EUR/INR, GBP/INR, JPY/INR)1. Overview of the Indian Currency Market
The Indian currency market is regulated by the Reserve Bank of India (RBI) and the Securities and Exchange Board of India (SEBI). Unlike global forex markets that operate 24 hours a day, the Indian forex trading market follows specific timings—from 9:00 AM to 5:00 PM IST, Monday to Friday.
Currency trading in India takes place on recognized exchanges such as:
National Stock Exchange (NSE)
Bombay Stock Exchange (BSE)
Multi Commodity Exchange (MCX-SX, now known as MSEI)
Trading is done in currency futures and options contracts rather than spot markets. This allows traders to speculate on future currency movements, hedge foreign exchange exposure, and manage import-export risks.
2. Importance of Currency Trading
Currency trading in India serves several crucial purposes:
Hedging against exchange rate risk: Importers, exporters, and multinational companies use currency derivatives to protect their profits from adverse currency movements.
Speculative opportunities: Traders and investors speculate on price changes to make profits from small fluctuations in currency rates.
Diversification: For retail and institutional investors, the forex market provides an alternative asset class beyond equities, commodities, and bonds.
Global exposure: Currency trading connects the Indian economy to global capital flows and helps stabilize balance of payments.
3. Major Currency Pairs Traded in India
Let’s look closely at the four major INR-based currency pairs:
a) USD/INR – The Most Active Pair
The USD/INR pair is the most traded and liquid currency pair in India. It represents how many Indian Rupees are required to purchase one US Dollar. The exchange rate is influenced by various factors such as:
RBI’s monetary policy
India’s trade deficit with the US
Interest rate differentials between India and the US
Global crude oil prices (since India imports most of its oil in USD)
Foreign portfolio investment inflows/outflows
USD/INR is widely used by corporates for hedging and by traders for speculation. The Rupee’s value against the Dollar is also a key indicator of India’s economic strength.
b) EUR/INR – The Euro-Rupee Pair
The EUR/INR pair reflects the exchange rate between the Euro and the Indian Rupee. It is the second-most traded currency pair in India. Europe is one of India’s major trading partners, and fluctuations in the Euro impact sectors like pharmaceuticals, engineering goods, and textiles.
Factors affecting EUR/INR include:
Eurozone’s economic data (GDP, inflation, trade balance)
European Central Bank (ECB) policies
Crude oil prices and global demand
Cross-currency movements between Euro and Dollar
The EUR/INR pair often exhibits higher volatility than USD/INR, providing good trading opportunities for short-term traders.
c) GBP/INR – The British Pound-Rupee Pair
The GBP/INR pair tracks the value of the British Pound in terms of the Indian Rupee. The Pound is known for its high volatility, making it attractive for experienced traders.
Key drivers of GBP/INR include:
Bank of England’s monetary policy
Political developments in the UK (like Brexit or elections)
Trade and investment flows between India and the UK
Global risk sentiment and capital movement
Because of its volatility, GBP/INR can generate both higher profits and higher risks, so traders often apply strict stop-loss strategies.
d) JPY/INR – The Japanese Yen-Rupee Pair
The JPY/INR pair represents how many Rupees are needed for 100 Japanese Yen. The Yen is often considered a safe-haven currency, meaning it tends to strengthen during global economic uncertainty.
Important factors influencing JPY/INR include:
Japan’s interest rate policy and inflation trends
Global risk appetite (Yen rises in risk-off scenarios)
India-Japan trade and investment relations
JPY/INR tends to move slower than GBP/INR or EUR/INR, making it suitable for conservative traders seeking stable movements.
4. How Currency Trading Works in India
In India, you cannot trade global forex pairs like EUR/USD or GBP/USD directly due to RBI restrictions. Instead, you can trade INR-based pairs and cross-currency pairs such as EUR/USD, GBP/USD, and USD/JPY introduced later by SEBI.
Each currency futures contract on NSE or BSE has:
Lot size: Typically 1,000 units for USD/INR, EUR/INR, and GBP/INR; 100,000 units for JPY/INR.
Tick size: 0.0025 or 0.25 paise.
Expiry: Monthly contracts expiring two working days before the last business day of the month.
Margin requirement: Around 3–5% of the contract value.
Trading is done through a registered broker, similar to equity trading, and all trades are settled in cash—no physical delivery of currencies.
5. Factors Influencing Currency Movements
Several global and domestic factors influence INR-based currency pairs:
Interest Rate Differentials: Higher interest rates in one country attract foreign capital, strengthening its currency.
Inflation Rates: Lower inflation tends to appreciate the currency’s value.
Trade Deficits: A high trade deficit leads to currency depreciation due to higher demand for foreign currencies.
Foreign Investment Flows: FII and FDI inflows support the Rupee, while outflows weaken it.
Crude Oil Prices: Rising oil prices increase India’s import bill, pressuring the Rupee.
Geopolitical Events: Global tensions, wars, and trade sanctions create volatility in currency markets.
RBI Intervention: The RBI regularly buys or sells dollars to maintain stability in the forex market.
6. Advantages of Currency Trading in India
Low Capital Requirement: Currency futures require smaller margins than equity derivatives, making it affordable for retail traders.
High Liquidity: Especially in USD/INR, which ensures easy entry and exit.
Leverage: Traders can control large positions with relatively small capital.
Diversification: Adds a new dimension to a trader’s portfolio beyond stocks and commodities.
Regulated Environment: Trading through NSE/BSE ensures transparency and security for participants.
7. Risks Involved in Currency Trading
While lucrative, forex trading also carries risks:
High Volatility: Currency pairs can move sharply in reaction to global news.
Leverage Risk: Leverage amplifies both profits and losses.
Political and Economic Events: Sudden government decisions or geopolitical crises can cause unpredictable movements.
Interest Rate Announcements: Central bank decisions can lead to overnight gaps and stop-loss hits.
Traders must therefore manage risk carefully using stop losses, position sizing, and diversified strategies.
8. Future of Currency Trading in India
India’s currency trading market is expanding rapidly due to growing globalization, digital platforms, and increased awareness among retail investors. The introduction of cross-currency pairs and potential expansion into 24-hour trading could further align India’s forex market with global standards.
Technological advancements, algorithmic trading, and integration with platforms like GIFT City (Gujarat International Finance Tec-City) are also paving the way for offshore rupee trading to return to Indian shores.
Conclusion
Currency trading in India offers a dynamic avenue for both hedgers and speculators. The four key INR pairs—USD/INR, EUR/INR, GBP/INR, and JPY/INR—reflect the nation’s integration with the global economy. Backed by SEBI and RBI regulation, the Indian forex market is evolving into a sophisticated and secure ecosystem.
For traders, mastering the fundamentals of global economics, risk management, and technical analysis is essential to succeed in currency trading. With discipline, knowledge, and proper strategy, the forex market can serve as a rewarding segment of India’s financial landscape.

BTCUSD SHORT bitcoin is strong bearish on higher time frame and doesnt have any support yet so this analysis aligns with the higher time frame for sell on rise.
ed purposes, sharing my thoughts for curious community.

BTCUSD Technical Analysis – Imp Levels to WatchBitcoin (BTC/USD) Technical Analysis – Key Levels to Watch (Nov 2025 Update)
Bitcoin is currently showing a sideways-to-weak trend as the price struggles to stay above the $107,000 zone. After reaching its recent high near $125,000, BTC faced selling pressure and started moving lower. Let’s look at the important support and resistance levels that can guide traders in the coming days.
Current Price Action
Bitcoin is trading near **$107,700**, and this area is becoming a key decision zone. The chart shows that buyers are trying to defend the support around **$106,976**, but so far, they are not able to push prices strongly upward. On the other hand, sellers are active near the resistance zone of **$111,000–$112,000**.
This indicates that Bitcoin is stuck in a short-term range between **$107,000 and $111,500**, and a breakout from this range will decide the next move.
Resistance Levels (Upside Targets)
1. Resistance 1 – $110,974 to $111,545:
This is the first barrier BTC needs to cross for any upward momentum. If Bitcoin breaks this level with strong volume, it can move higher toward the next targets.
2. Resistance 2 – $116,500 (First Target):
Once the first resistance is cleared, BTC could aim for this level. This area has seen heavy selling earlier, so bulls will need strong buying power to move above it.
3. Resistance 3 – $125,000 (Third Target):
This is the upper resistance and the recent swing high. If Bitcoin manages to break and close above $125,000, it will confirm a strong bullish trend, and we could see new highs later.
Support Levels (Downside Targets)
1. Immediate Support – $106,976:
This level is acting as the first support for now. If it holds, BTC might bounce back toward $110,000.
2. Downside First Target – $103,500:
If Bitcoin breaks below $106,000, the next target on the downside could be around $103,500. This will show short-term weakness in the market.
3. Latest Support – $98,600 to $99,700:
This zone is very important because it acted as a strong base in the past. Many buyers may re-enter the market here.
4. Demand Zone / Support 2 – $89,000 to $90,700:
This area is called the “Demand Zone.” If prices fall this low, we can expect a strong buying reaction as long-term investors might find this level attractive.
5. Final Support – $78,600 to $79,700:
This is the last strong support on the chart. A fall below this level would signal a major trend reversal from bullish to bearish.
"Summary"
Right now, Bitcoin’s short-term trend is sideways to slightly bearish** until it breaks above $111,500. If BTC holds above $107,000 and breaks the first resistance, we can expect recovery toward $116,000 and then $125,000.
However, if it slips below $106,000, the price may test $103,500 or even $99,700 in the coming sessions.
Traders should watch these levels carefully and avoid over-leveraging during sideways market conditions.
