Currency Trading in India (USD/INR, EUR/INR, GBP/INR, JPY/INR)1. Overview of the Indian Currency Market
The Indian currency market is regulated by the Reserve Bank of India (RBI) and the Securities and Exchange Board of India (SEBI). Unlike global forex markets that operate 24 hours a day, the Indian forex trading market follows specific timings—from 9:00 AM to 5:00 PM IST, Monday to Friday.
Currency trading in India takes place on recognized exchanges such as:
National Stock Exchange (NSE)
Bombay Stock Exchange (BSE)
Multi Commodity Exchange (MCX-SX, now known as MSEI)
Trading is done in currency futures and options contracts rather than spot markets. This allows traders to speculate on future currency movements, hedge foreign exchange exposure, and manage import-export risks.
2. Importance of Currency Trading
Currency trading in India serves several crucial purposes:
Hedging against exchange rate risk: Importers, exporters, and multinational companies use currency derivatives to protect their profits from adverse currency movements.
Speculative opportunities: Traders and investors speculate on price changes to make profits from small fluctuations in currency rates.
Diversification: For retail and institutional investors, the forex market provides an alternative asset class beyond equities, commodities, and bonds.
Global exposure: Currency trading connects the Indian economy to global capital flows and helps stabilize balance of payments.
3. Major Currency Pairs Traded in India
Let’s look closely at the four major INR-based currency pairs:
a) USD/INR – The Most Active Pair
The USD/INR pair is the most traded and liquid currency pair in India. It represents how many Indian Rupees are required to purchase one US Dollar. The exchange rate is influenced by various factors such as:
RBI’s monetary policy
India’s trade deficit with the US
Interest rate differentials between India and the US
Global crude oil prices (since India imports most of its oil in USD)
Foreign portfolio investment inflows/outflows
USD/INR is widely used by corporates for hedging and by traders for speculation. The Rupee’s value against the Dollar is also a key indicator of India’s economic strength.
b) EUR/INR – The Euro-Rupee Pair
The EUR/INR pair reflects the exchange rate between the Euro and the Indian Rupee. It is the second-most traded currency pair in India. Europe is one of India’s major trading partners, and fluctuations in the Euro impact sectors like pharmaceuticals, engineering goods, and textiles.
Factors affecting EUR/INR include:
Eurozone’s economic data (GDP, inflation, trade balance)
European Central Bank (ECB) policies
Crude oil prices and global demand
Cross-currency movements between Euro and Dollar
The EUR/INR pair often exhibits higher volatility than USD/INR, providing good trading opportunities for short-term traders.
c) GBP/INR – The British Pound-Rupee Pair
The GBP/INR pair tracks the value of the British Pound in terms of the Indian Rupee. The Pound is known for its high volatility, making it attractive for experienced traders.
Key drivers of GBP/INR include:
Bank of England’s monetary policy
Political developments in the UK (like Brexit or elections)
Trade and investment flows between India and the UK
Global risk sentiment and capital movement
Because of its volatility, GBP/INR can generate both higher profits and higher risks, so traders often apply strict stop-loss strategies.
d) JPY/INR – The Japanese Yen-Rupee Pair
The JPY/INR pair represents how many Rupees are needed for 100 Japanese Yen. The Yen is often considered a safe-haven currency, meaning it tends to strengthen during global economic uncertainty.
Important factors influencing JPY/INR include:
Japan’s interest rate policy and inflation trends
Global risk appetite (Yen rises in risk-off scenarios)
India-Japan trade and investment relations
JPY/INR tends to move slower than GBP/INR or EUR/INR, making it suitable for conservative traders seeking stable movements.
4. How Currency Trading Works in India
In India, you cannot trade global forex pairs like EUR/USD or GBP/USD directly due to RBI restrictions. Instead, you can trade INR-based pairs and cross-currency pairs such as EUR/USD, GBP/USD, and USD/JPY introduced later by SEBI.
Each currency futures contract on NSE or BSE has:
Lot size: Typically 1,000 units for USD/INR, EUR/INR, and GBP/INR; 100,000 units for JPY/INR.
Tick size: 0.0025 or 0.25 paise.
Expiry: Monthly contracts expiring two working days before the last business day of the month.
Margin requirement: Around 3–5% of the contract value.
Trading is done through a registered broker, similar to equity trading, and all trades are settled in cash—no physical delivery of currencies.
5. Factors Influencing Currency Movements
Several global and domestic factors influence INR-based currency pairs:
Interest Rate Differentials: Higher interest rates in one country attract foreign capital, strengthening its currency.
Inflation Rates: Lower inflation tends to appreciate the currency’s value.
Trade Deficits: A high trade deficit leads to currency depreciation due to higher demand for foreign currencies.
Foreign Investment Flows: FII and FDI inflows support the Rupee, while outflows weaken it.
Crude Oil Prices: Rising oil prices increase India’s import bill, pressuring the Rupee.
Geopolitical Events: Global tensions, wars, and trade sanctions create volatility in currency markets.
RBI Intervention: The RBI regularly buys or sells dollars to maintain stability in the forex market.
6. Advantages of Currency Trading in India
Low Capital Requirement: Currency futures require smaller margins than equity derivatives, making it affordable for retail traders.
High Liquidity: Especially in USD/INR, which ensures easy entry and exit.
Leverage: Traders can control large positions with relatively small capital.
Diversification: Adds a new dimension to a trader’s portfolio beyond stocks and commodities.
Regulated Environment: Trading through NSE/BSE ensures transparency and security for participants.
7. Risks Involved in Currency Trading
While lucrative, forex trading also carries risks:
High Volatility: Currency pairs can move sharply in reaction to global news.
Leverage Risk: Leverage amplifies both profits and losses.
Political and Economic Events: Sudden government decisions or geopolitical crises can cause unpredictable movements.
Interest Rate Announcements: Central bank decisions can lead to overnight gaps and stop-loss hits.
Traders must therefore manage risk carefully using stop losses, position sizing, and diversified strategies.
8. Future of Currency Trading in India
India’s currency trading market is expanding rapidly due to growing globalization, digital platforms, and increased awareness among retail investors. The introduction of cross-currency pairs and potential expansion into 24-hour trading could further align India’s forex market with global standards.
Technological advancements, algorithmic trading, and integration with platforms like GIFT City (Gujarat International Finance Tec-City) are also paving the way for offshore rupee trading to return to Indian shores.
Conclusion
Currency trading in India offers a dynamic avenue for both hedgers and speculators. The four key INR pairs—USD/INR, EUR/INR, GBP/INR, and JPY/INR—reflect the nation’s integration with the global economy. Backed by SEBI and RBI regulation, the Indian forex market is evolving into a sophisticated and secure ecosystem.
For traders, mastering the fundamentals of global economics, risk management, and technical analysis is essential to succeed in currency trading. With discipline, knowledge, and proper strategy, the forex market can serve as a rewarding segment of India’s financial landscape.
Trade ideas

BTCUSD SHORT bitcoin is strong bearish on higher time frame and doesnt have any support yet so this analysis aligns with the higher time frame for sell on rise.
ed purposes, sharing my thoughts for curious community.

BTCUSD Technical Analysis – Imp Levels to WatchBitcoin (BTC/USD) Technical Analysis – Key Levels to Watch (Nov 2025 Update)
Bitcoin is currently showing a sideways-to-weak trend as the price struggles to stay above the $107,000 zone. After reaching its recent high near $125,000, BTC faced selling pressure and started moving lower. Let’s look at the important support and resistance levels that can guide traders in the coming days.
Current Price Action
Bitcoin is trading near **$107,700**, and this area is becoming a key decision zone. The chart shows that buyers are trying to defend the support around **$106,976**, but so far, they are not able to push prices strongly upward. On the other hand, sellers are active near the resistance zone of **$111,000–$112,000**.
This indicates that Bitcoin is stuck in a short-term range between **$107,000 and $111,500**, and a breakout from this range will decide the next move.
Resistance Levels (Upside Targets)
1. Resistance 1 – $110,974 to $111,545:
This is the first barrier BTC needs to cross for any upward momentum. If Bitcoin breaks this level with strong volume, it can move higher toward the next targets.
2. Resistance 2 – $116,500 (First Target):
Once the first resistance is cleared, BTC could aim for this level. This area has seen heavy selling earlier, so bulls will need strong buying power to move above it.
3. Resistance 3 – $125,000 (Third Target):
This is the upper resistance and the recent swing high. If Bitcoin manages to break and close above $125,000, it will confirm a strong bullish trend, and we could see new highs later.
Support Levels (Downside Targets)
1. Immediate Support – $106,976:
This level is acting as the first support for now. If it holds, BTC might bounce back toward $110,000.
2. Downside First Target – $103,500:
If Bitcoin breaks below $106,000, the next target on the downside could be around $103,500. This will show short-term weakness in the market.
3. Latest Support – $98,600 to $99,700:
This zone is very important because it acted as a strong base in the past. Many buyers may re-enter the market here.
4. Demand Zone / Support 2 – $89,000 to $90,700:
This area is called the “Demand Zone.” If prices fall this low, we can expect a strong buying reaction as long-term investors might find this level attractive.
5. Final Support – $78,600 to $79,700:
This is the last strong support on the chart. A fall below this level would signal a major trend reversal from bullish to bearish.
"Summary"
Right now, Bitcoin’s short-term trend is sideways to slightly bearish** until it breaks above $111,500. If BTC holds above $107,000 and breaks the first resistance, we can expect recovery toward $116,000 and then $125,000.
However, if it slips below $106,000, the price may test $103,500 or even $99,700 in the coming sessions.
Traders should watch these levels carefully and avoid over-leveraging during sideways market conditions.

Market Microstructure and Institutional Trading Strategies1. Introduction
Financial markets appear to be simple arenas where buyers and sellers exchange assets like stocks, bonds, or derivatives. However, beneath the surface lies a complex and dynamic framework known as market microstructure, which governs how trades occur, how prices are formed, and how information flows. Understanding this structure is crucial for institutional traders—large entities such as hedge funds, mutual funds, and investment banks—who move massive volumes of capital and rely on sophisticated strategies to minimize costs, manage risks, and exploit inefficiencies.
Market microstructure analysis goes beyond economics—it involves studying trading mechanisms, order types, liquidity dynamics, and the behavior of participants within electronic trading systems. Institutions, equipped with technology, algorithms, and data, use this knowledge to execute trades strategically and discreetly.
2. Defining Market Microstructure
Market microstructure refers to the study of the processes and outcomes of exchanging assets under explicit trading rules. It focuses on how a market operates rather than why it operates. It examines:
Trading mechanisms: How buyers and sellers interact (e.g., order-driven vs. quote-driven markets).
Price formation: How transaction prices reflect supply, demand, and information.
Information asymmetry: How private and public information affect prices and trading behavior.
Liquidity: How easily assets can be bought or sold without significantly impacting prices.
Transaction costs: The total cost of trading, including spreads, commissions, and slippage.
In modern financial markets, most trades occur electronically, through exchanges such as the NSE, BSE, NYSE, or NASDAQ, and also through dark pools and alternative trading systems (ATS). Each venue has unique microstructural characteristics that influence trade execution quality.
3. Core Components of Market Microstructure
a) Order Types and Book Dynamics
Orders are instructions to buy or sell. They can be market orders (executed immediately at the best available price) or limit orders (executed at a specified price or better).
The aggregation of limit orders forms the order book, showing real-time supply (asks) and demand (bids). The best bid and ask form the bid-ask spread, a key measure of market liquidity.
Institutional traders carefully analyze order book depth to detect hidden liquidity and avoid market impact.
b) Price Discovery and Efficiency
Price discovery is the process through which the market determines the fair value of a security based on new information and trading activity. A highly efficient market quickly incorporates information into prices. However, inefficiencies often exist due to human behavior, latency, or fragmented liquidity—creating opportunities for algorithmic exploitation.
c) Liquidity and Market Impact
Liquidity describes how easily large orders can be executed without moving prices. High liquidity lowers trading costs, while low liquidity leads to higher market impact—the adverse price movement caused by large trades. Institutions often break large orders into smaller ones to reduce this impact, a technique called order slicing.
d) Information Asymmetry
Not all market participants have equal access to information. Informed traders (e.g., institutions with research insights or advanced models) have an edge over uninformed traders. Market microstructure models like the Glosten-Milgrom or Kyle’s model explain how market makers set prices based on the likelihood of trading with informed participants.
4. Institutional Trading Landscape
Institutional traders dominate global markets, accounting for over 70% of total volume in major exchanges. Their goals differ from retail investors—they focus on minimizing execution costs, preserving anonymity, and optimizing returns through strategic execution.
The main categories of institutional players include:
Mutual funds and pension funds: Long-term investors prioritizing cost efficiency.
Hedge funds: Short-term and opportunistic traders using leverage and derivatives.
Proprietary trading desks: Institutions trading for their own profits.
High-frequency traders (HFTs): Using algorithms to exploit microsecond-level inefficiencies.
5. Institutional Trading Strategies
Institutional strategies are designed around execution quality, liquidity access, and market microstructure insights. Some key strategies include:
a) Algorithmic Trading
Algorithmic trading automates order execution using pre-programmed rules based on time, volume, or price. Algorithms minimize human error and allow precision in execution. Major algorithmic strategies include:
VWAP (Volume Weighted Average Price): Executes trades to match the day’s average traded price by volume.
TWAP (Time Weighted Average Price): Executes evenly over a set time period to reduce market impact.
POV (Percentage of Volume): Trades as a fixed percentage of total market volume.
Implementation Shortfall: Balances execution speed and price impact to minimize total trading costs.
These methods ensure discretion and reduce detection by other traders or algorithms.
b) Statistical Arbitrage
Statistical arbitrage exploits short-term mispricings between correlated securities. By using mathematical models and historical data, institutions identify temporary price divergences—for example, between two companies in the same sector—and trade to profit when prices revert to equilibrium.
c) Market Making and Liquidity Provision
Institutional market makers continuously quote buy and sell prices, profiting from the bid-ask spread while providing liquidity. In exchange, they bear inventory and adverse selection risks if trading against informed participants. Many HFT firms specialize in market making, balancing massive order flows across venues.
d) Dark Pool Trading
To avoid signaling their intentions, institutions use dark pools—private trading venues where large orders are executed anonymously. Prices are typically derived from public exchanges, but the details of participants and order sizes remain hidden. This reduces market impact and helps institutions accumulate or unwind positions quietly.
e) Smart Order Routing (SOR)
SOR technology scans multiple exchanges and trading venues simultaneously to find the best prices and liquidity. For example, if the same stock trades on NSE, BSE, and alternative systems, the router splits the order to achieve optimal execution based on latency, volume, and fees.
6. Role of Technology and High-Frequency Trading
The fusion of technology, speed, and data analytics has redefined institutional trading. High-frequency trading (HFT) algorithms now operate in microseconds, reacting to price changes faster than human perception. They exploit minuscule price discrepancies across markets or react to order book imbalances.
While HFTs improve liquidity and narrow spreads, they also raise concerns about market stability, flash crashes, and predatory behavior—where algorithms anticipate and exploit slower traders.
To stay competitive, institutions invest heavily in:
Co-location services (placing servers near exchange data centers).
Low-latency networks and fiber-optic cables.
Artificial intelligence and machine learning for predictive analytics.
7. Transaction Cost Analysis (TCA)
Every institutional trade generates explicit (fees, commissions) and implicit (spread, market impact, timing) costs. TCA is a systematic approach to measure and minimize these costs.
By comparing execution prices to benchmarks (like VWAP or arrival price), traders assess their execution performance and refine future strategies.
8. Regulation and Market Transparency
Market microstructure is heavily influenced by regulation, ensuring fairness and stability.
In India, SEBI enforces transparency, monitors algorithmic trading, and prevents manipulation. Globally, frameworks like MiFID II (Europe) and Reg NMS (U.S.) promote best execution and transparency across fragmented markets.
However, regulators must constantly adapt to technological advancements such as AI-driven trading and decentralized finance (DeFi).
9. Challenges and Evolving Trends
Institutional trading faces emerging challenges, including:
Data Overload: Massive real-time data streams require advanced analytics.
Latency Arbitrage: Millisecond advantages can create unfair competition.
Regulatory Complexity: Compliance across multiple jurisdictions increases costs.
AI and Quantum Trading: The next frontier involves predictive modeling and ultra-fast computation.
Trends like blockchain-based settlement, tokenized securities, and ESG-integrated trading models are reshaping the future of market microstructure.
10. Conclusion
Market microstructure provides the foundation for understanding how financial markets function at their most granular level. For institutional traders, mastering it is not optional—it’s essential.
By analyzing order flow, liquidity patterns, and execution mechanics, institutions craft strategies that optimize performance while minimizing costs and risks.
In an era where technology defines speed and information defines power, successful institutional trading lies at the intersection of data, discipline, and deep microstructural insight. The future belongs to those who can blend quantitative intelligence with strategic precision—turning market complexity into competitive advantage.
BTC(bearish for short term) ??Trendline: Long-term ascending trendline starting from mid-2023, still intact and respected.
Pullback into $100,000–$99,500 support
Bounce toward $109,000–$111,000
Final retest of the trendline (approx. $100,000 again)
Major upside breakout leg aiming for $124K–$136K
Current Phase: Short-term correction (wave (1)-(3) leg) inside a long-term uptrend.
Critical Level-
If BTC breaks below $99,000 weekly, trendline support fails → possible deeper retrace to $90K.
As long as $100K holds, this remains a healthy correction before wave (5) continuation.
What are your opinion? Comment below.

Btc buying side preparing for liquidity sweep SMC ICT appliedAs per recent structure BTC has taken support at previous order block and also 200 ema, with hammer. So seems like going for liquidity sweep of sellers.

Look great for small target Continued Consolidation (Most Likely Short-Term)
This is a range-bound market. Short-term traders might "buy near support" and "sell near resistance." For a directional move, you must wait for a breakout as described above.

Best Intraday SET UP for BTC for today Optimal trading strategy for Bitcoin today.
Initiate a long position above the 110,463 level, targeting 111,597. Conversely, should resistance be encountered near 110,227, anticipate a downward price movement, with a target of 108,759. Furthermore, consider short positions below 109,804 due to a break in market structure, aiming for a target of 108,759.

Part 7 Trading Master Class With Experts Option Pricing: Understanding the Premium
Option prices are determined by several variables, most famously modeled using the Black-Scholes formula. The main components are:
Underlying Price: The current price of the asset.
Strike Price: The agreed-upon price for the option.
Time to Expiry: Longer durations increase premium due to higher uncertainty.
Volatility: Measures how much the underlying asset’s price fluctuates; higher volatility increases option prices.
Interest Rates and Dividends: Minor but relevant factors affecting option pricing.
Option premium = Intrinsic Value + Time Value
As expiration approaches, the time value declines—this is called time decay (Theta). This is why option sellers often benefit from the passage of time if prices remain stable.

Weekly & Daily BTC analysis of 10R Opportunity........On HTF weekly and daily BTC is forming good scenarios for bearish trade. Price is consolidating at higher levels for last couple of weeks and showing value adjustment in BTC. Price already shot up a lot and we may see a short term pull back.
1. BTC has created CISD after taking liquidity at weekly level and tested weekly iFVG.
2. It has also created 1D FVG and 4H FVG and iFVG over lapping. creating cluster of CEs. Which might be a Good POI for sell side opportunity.
3. Technically we are already into a weekly down side scenario. Further price is approaching Daily and 4 Hourly FVGs for possible re-entry opportunities.
4. RSI has also already shown a bearish divergence on weekly level.
5. Most probably price will take liquidity of FVG and create MSS/CISD/TS/iFVG in LTF.
6. Price should show rejection/reversal in respective LTF (1H/15m) at FVG zone.
7. Take the trade only once clear entry model i.e. turtle soup. iFVG break, CDS or MSS happens on LTF
All these combinations are signalling a high probability and ~10R trade scenario.
Note – if you liked this analysis, please boost the idea so that other can also get benefit of it. Also follow me for notification for incoming ideas.
Also Feel free to comment if you have any input to share.
Disclaimer – This analysis is just for education purpose not any trading suggestion. Please take the trade at your own risk and with the discussion with your financial advisor.

AI, Big Data & Predictive Analytics in TradingIntroduction: The Fusion of Technology and Markets
Over the last two decades, the world of trading has evolved from simple human-driven decisions to a technologically advanced ecosystem powered by artificial intelligence (AI), big data, and predictive analytics. Financial markets today generate an immense volume of data every second—from stock prices, news feeds, social media sentiment, and macroeconomic indicators to even satellite imagery and alternative data sources.
The challenge for traders and investors is no longer about accessing information, but rather about interpreting and utilizing it effectively. This is where AI, Big Data, and Predictive Analytics step in. They collectively empower traders to identify opportunities, manage risk, and execute strategies faster and more accurately than ever before.
1. Understanding the Core Concepts
Before diving deeper, it’s important to define the three core components transforming trading:
Artificial Intelligence (AI)
AI refers to computer systems that can perform tasks requiring human-like intelligence—such as recognizing patterns, making decisions, and learning from experience. In trading, AI systems can analyze historical data, detect anomalies, and even make autonomous buy/sell decisions.
Big Data
Big Data represents the massive and complex sets of information generated from multiple sources—market feeds, economic reports, tweets, and even sensor data. This data is often characterized by the three Vs: Volume (massive size), Velocity (speed of generation), and Variety (different data types). Traders use big data analytics tools to uncover hidden correlations and market insights that traditional models often miss.
Predictive Analytics
Predictive analytics involves using statistical algorithms, data mining, and machine learning to forecast future outcomes. In trading, predictive models analyze historical price behavior, market sentiment, and macroeconomic indicators to predict price movements, volatility spikes, or trend reversals.
Together, these three technologies form the backbone of quantitative and algorithmic trading in modern markets.
2. How Big Data Fuels Modern Trading
Every tick, trade, and transaction in the financial market adds to a sea of information. Big Data allows traders to capture this data and extract actionable intelligence.
Key Sources of Big Data in Trading:
Market Data: Price feeds, order book data, volume profiles, and volatility indices.
Fundamental Data: Corporate earnings, balance sheets, macroeconomic indicators.
Alternative Data: Social media sentiment, Google search trends, web traffic analytics.
Geospatial and Satellite Data: Used by hedge funds to monitor industrial activity or crop yields.
Transactional Data: Payment records and credit card spending patterns reflecting consumer sentiment.
How It’s Used:
Big Data analytics tools process petabytes of information to detect correlations—for example, how rising oil prices might affect airline stocks or how social media mentions of a company could influence its short-term price.
For instance, quant funds like Renaissance Technologies or Two Sigma rely heavily on structured and unstructured data sets to find non-obvious relationships that traditional analysis would overlook.
The Competitive Edge:
In today’s markets, possessing more data is not enough; it’s about who can analyze it faster and smarter. Traders equipped with real-time analytics can identify shifts in sentiment or volatility before the rest of the market reacts—turning milliseconds of advantage into millions in profit.
3. The Role of Artificial Intelligence in Trading
AI takes data analysis one step further by enabling systems that learn from experience and adapt to changing market conditions.
Key AI Applications in Trading:
Machine Learning Models
These algorithms train on historical data to recognize patterns—such as when a stock is likely to break out of a price range.
Models like Random Forests, Gradient Boosting, and Neural Networks are frequently used to predict asset prices, volatility, and correlations.
Deep Learning and Neural Networks
Deep learning networks simulate human brain behavior to find intricate nonlinear patterns.
In trading, deep learning models are used for image recognition (chart pattern identification), natural language processing (news sentiment), and time-series forecasting.
Natural Language Processing (NLP)
NLP allows AI systems to “read” and “understand” text-based data—such as earnings reports, news headlines, and tweets.
For example, algorithms can instantly gauge whether a CEO’s statement is positive, neutral, or negative and trade accordingly.
Reinforcement Learning
A type of AI that learns optimal strategies through trial and error.
Used in portfolio optimization, automated trading bots, and dynamic risk management systems.
Robo-Advisors
AI-driven investment platforms that automatically allocate portfolios based on user goals and risk appetite.
They continuously rebalance portfolios as market conditions change—offering accessibility to retail investors at minimal cost.
AI in Decision-Making:
Unlike human traders, AI doesn’t suffer from fatigue or emotions. It executes based purely on logic and data-driven signals. This reduces bias and improves trading consistency, though it introduces new risks, such as algorithmic errors or overfitting.
4. Predictive Analytics: The Power of Forecasting
Predictive analytics bridges the gap between past and future by transforming historical patterns into forecasts.
Techniques Used in Predictive Analytics for Trading:
Regression Models: Estimate the relationship between variables (e.g., GDP growth and stock index performance).
Time-Series Analysis: Forecast price trends using historical data patterns, volatility clustering, and seasonal effects.
Monte Carlo Simulations: Model multiple possible future price paths to estimate risk.
Sentiment Analysis: Assess the emotional tone behind market chatter to predict short-term volatility.
Event-Driven Modeling: Predict market reactions to upcoming earnings, interest rate decisions, or geopolitical events.
For example, predictive analytics might identify that when gold prices rise by 2% and the dollar index falls by 1%, emerging market equities tend to outperform within two weeks. Such insights help traders position themselves ahead of time.
5. Real-World Examples of AI and Data-Driven Trading
High-Frequency Trading (HFT):
Firms like Citadel Securities and Jump Trading use AI-powered algorithms to execute thousands of trades per second. These systems react to micro-changes in prices faster than any human could.
Quantitative Hedge Funds:
Funds such as Renaissance Technologies, Two Sigma, and AQR Capital Management rely on massive datasets and machine learning models to identify repeatable patterns. Their edge lies in continuously retraining models to adapt to new data.
Retail Trading Platforms:
Apps like Robinhood, Zerodha, and eToro integrate AI tools to recommend trades, provide risk alerts, or forecast trends using sentiment indicators and pattern recognition.
Sentiment Analysis Tools:
AI-driven analytics platforms (like Dataminr or Accern) scan millions of online data points in real-time to alert traders to breaking news before it hits mainstream outlets.
6. Advantages of AI, Big Data & Predictive Analytics in Trading
Speed and Efficiency:
Automated systems process millions of data points in milliseconds—far beyond human capability.
Data-Driven Objectivity:
Decisions are made on logic and data, not emotion or intuition.
Pattern Recognition:
AI can detect complex, nonlinear relationships that traditional models miss.
Risk Management:
Predictive analytics can forecast potential drawdowns and volatility spikes, allowing traders to hedge in advance.
Cost Reduction:
AI and automation reduce manual analysis time and the cost of large research teams.
Scalability:
Models can be applied across multiple asset classes and markets simultaneously.
7. Challenges and Limitations
Despite the benefits, AI and Big Data in trading come with certain limitations:
Data Quality and Noise:
Massive datasets often contain errors or irrelevant data, leading to false signals.
Overfitting:
Models trained too specifically on past data may fail in changing market conditions.
Black-Box Models:
Deep learning models often lack transparency—making it hard to explain why a trade was made.
Ethical and Regulatory Risks:
The use of AI raises questions about fairness, accountability, and compliance with financial regulations.
Market Crowding:
When many algorithms follow similar patterns, it can lead to sudden flash crashes or liquidity imbalances.
8. The Future of AI and Predictive Trading
The future of trading lies in integration—where AI, big data, and predictive analytics merge seamlessly to create adaptive, self-learning trading ecosystems.
Emerging Trends:
Explainable AI (XAI): Focus on improving transparency and interpretability of AI decisions.
Quantum Computing: Expected to revolutionize predictive analytics with faster, more complex computations.
Hybrid Models: Combining human intuition with AI precision for balanced decision-making.
Alternative Data Expansion: Use of geolocation, climate, and sentiment data for edge prediction.
Automated Risk Assessment: Real-time portfolio stress testing through predictive algorithms.
Human-AI Collaboration:
While AI excels at processing data, human traders still play a vital role in understanding macro context, ethics, and judgment calls. The most successful trading models of the future will combine human experience with machine intelligence.
9. Conclusion: Data Is the New Alpha
In the modern trading world, data is the new form of “alpha”—the edge that separates winning strategies from the rest. The combination of AI, Big Data, and Predictive Analytics is redefining not just how markets are analyzed, but how decisions are made, risks are managed, and profits are realized.
Traders who harness these technologies gain access to a level of precision, speed, and foresight that was once unimaginable. Yet, the true success lies in balance—using data-driven insights while maintaining human oversight and adaptability.
In essence, the trading floor of the future isn’t just about human intuition or machine learning—it’s about intelligent collaboration between the two, powered by algorithms that see the unseen and predict the unpredictable.
Market Structure and Volume Profile Analysis1. What is Market Structure?
Market structure refers to the framework or layout of price movements on a chart. It’s the foundation of technical analysis and represents how price transitions between different phases — uptrends, downtrends, and consolidations.
In simple terms, market structure is the “story” that price tells. It reveals the ongoing battle between bulls and bears, showing where momentum shifts occur and where the next possible move could be.
1.1 The Core Elements of Market Structure
Swing Highs and Swing Lows:
These are the turning points of the market.
Swing High: A peak where price reverses downward.
Swing Low: A trough where price reverses upward.
Higher Highs (HH) and Higher Lows (HL):
These define an uptrend. Each new high surpasses the previous one, and each low remains above the previous low — signaling strength in buying pressure.
Lower Highs (LH) and Lower Lows (LL):
These define a downtrend. Each new low is lower than the previous one, and each high fails to reach the prior peak — showing selling dominance.
Range or Consolidation:
When price moves sideways between defined boundaries, it indicates equilibrium — a pause before a breakout or breakdown.
2. The Three Phases of Market Structure
Market structure often unfolds in three broad phases, forming a continuous cycle:
2.1 Accumulation Phase
Occurs after a prolonged downtrend.
Smart money (institutional traders) quietly accumulate positions at discounted prices.
Price typically moves sideways within a range with low volatility.
Volume gradually increases near the lower end of the range.
2.2 Markup Phase
Begins when price breaks above resistance of the accumulation range.
Market starts forming higher highs and higher lows.
Retail traders begin to notice the trend, and participation increases.
This phase is characterized by momentum, volume expansion, and trend continuation.
2.3 Distribution Phase
After an extended uptrend, large players begin to distribute (sell) their holdings to late entrants.
Price moves sideways again, showing exhaustion.
The structure gradually shifts from higher highs to equal or lower highs, signaling a potential reversal.
After distribution, the market transitions into a markdown phase, starting the next downtrend cycle — mirroring the opposite of the markup phase.
3. Identifying Market Structure Shifts
A Market Structure Shift (MSS) occurs when price action breaks the pattern of highs and lows, signaling a potential change in direction.
For instance:
In an uptrend, if price forms a lower low, it suggests weakening buyer momentum.
In a downtrend, a higher high can indicate the first sign of reversal.
Practical Example:
Suppose price is making consistent higher highs and higher lows. Suddenly, it fails to make a new high and breaks below the last higher low.
➡️ This indicates a break in structure (BOS) — a possible start of a bearish trend.
Such breaks are crucial for traders as they provide early reversal signals and opportunities to align trades with the new direction.
4. Understanding Volume Profile Analysis
While market structure shows where price has moved, Volume Profile reveals why it moved there — by showing the distribution of traded volume across price levels rather than time.
Unlike traditional volume bars that appear at the bottom of the chart, Volume Profile is plotted horizontally along the price axis. This gives a clear picture of where the most buying and selling activity occurred, and hence, where strong support and resistance zones exist.
5. Key Components of Volume Profile
A Volume Profile typically consists of several important zones and metrics:
5.1 Point of Control (POC)
The price level with the highest traded volume.
It represents the fairest price or value area equilibrium where both buyers and sellers agreed most.
Acts as a magnet for price; markets often revisit the POC after deviations.
5.2 Value Area (VA)
The range covering roughly 70% of the total traded volume.
Divided into:
Value Area High (VAH): The upper boundary.
Value Area Low (VAL): The lower boundary.
Price movement above or below this zone suggests overbought or oversold conditions relative to value.
5.3 Low-Volume Nodes (LVN)
Price levels with very low traded volume.
These act as rejection zones or imbalance areas, often leading to sharp moves when revisited.
5.4 High-Volume Nodes (HVN)
Clusters of heavy trading activity.
They act as strong support/resistance levels and areas where the market is likely to consolidate.
6. Interpreting Volume Profile for Trading
Volume Profile provides context for market structure by helping traders answer key questions:
Where is the market balanced (value area)?
Where did price previously face acceptance or rejection?
Is current price above or below value?
Here’s how to interpret common scenarios:
6.1 Price Above Value Area
The market is overextended to the upside.
If volume is weak, a mean reversion toward the POC is likely.
If volume increases, it may signal acceptance of higher value, suggesting trend continuation.
6.2 Price Below Value Area
Indicates potential undervaluation.
A bounce back toward value (POC) is possible if buyers step in.
6.3 Single Prints or Volume Gaps
These represent inefficient auction areas where price moved too fast.
Market tends to revisit and fill these gaps to balance the order flow later.
7. Combining Market Structure and Volume Profile
When used together, these tools create a powerful framework for understanding price behavior.
7.1 Structure Confirms Direction, Volume Confirms Value
Market Structure shows the direction of the trend.
Volume Profile confirms where the value is being built.
For instance:
If market structure forms higher highs and higher lows (uptrend) and Volume Profile shifts upward (value moving higher), this confirms a healthy bullish trend.
Conversely, if price rises but volume value areas shift lower, it signals weakness — a potential reversal.
7.2 Trading Strategy Example
Scenario: Market is in an uptrend with clear HH-HL structure.
Observation: Volume Profile shows strong buying at higher value areas and rejection below the POC.
Action:
Wait for a pullback to VAL or POC.
Enter long when price shows bullish confirmation (e.g., bullish engulfing candle).
Target the previous high or next HVN.
Place stop-loss below the recent swing low or LVN.
This combination ensures trades are aligned with trend structure and supported by volume confirmation, improving accuracy and reducing noise.
8. Practical Applications in Different Timeframes
Market Structure and Volume Profile are timeframe-independent, but interpretation differs across timeframes.
8.1 Intraday Trading
Focus on session volume profiles to identify daily value shifts.
Identify volume imbalances and trade breakouts or rejections around them.
Structure shifts (like BOS or CHoCH — Change of Character) often provide early intraday reversals.
8.2 Swing Trading
Use composite volume profiles covering several weeks/months to spot long-term value zones.
Identify accumulation and distribution phases.
Align trades with larger structural trends and institutional footprints.
8.3 Position Trading
Evaluate macro structure across weekly and monthly charts.
Focus on long-term POCs, high-volume nodes, and trend phases.
Use volume confirmation to identify areas of institutional accumulation or exit.
9. The Psychology Behind Market Structure and Volume
Every structure and volume zone represents trader psychology:
High Volume Areas: Consensus zones — comfort areas where both sides transact heavily.
Low Volume Areas: Fear or indecision zones — markets move quickly through them.
Structure Breaks: Emotional points where one side capitulates, shifting control.
Understanding this behavioral context helps traders not only react to price but anticipate moves before they happen.
10. Common Mistakes Traders Make
Ignoring Higher Timeframe Structure:
Trading against the dominant trend often leads to false entries.
Overusing Indicators Instead of Price Context:
Indicators lag — market structure gives real-time insights.
Misinterpreting Volume:
Not all high-volume zones mean strength; sometimes they signal distribution.
Neglecting Balance and Imbalance:
Failing to differentiate between a balanced (ranging) and imbalanced (trending) market causes confusion.
11. Key Tips for Effective Market Structure and Volume Analysis
Always start with higher timeframes to establish trend context.
Mark key POC, VAH, VAL, and swing levels.
Watch for Market Structure Shifts (BOS/CHoCH) near volume extremes.
Combine with liquidity concepts — price often reacts around previous highs/lows.
Use Volume Delta and Cumulative Volume Delta (CVD) for deeper order flow confirmation.
12. Real-World Example: A Typical Trade Setup
Context:
Nifty Futures on a 1-hour chart.
Market structure: Higher highs and higher lows (uptrend).
Volume Profile: Value area shifting upward, with a new POC forming higher.
Price retraces to the previous VAL, showing bullish rejection candles.
Trade Execution:
Entry: Long at VAL with confirmation candle.
Stop-Loss: Below swing low or LVN.
Target: Next HVN or previous high.
This approach aligns trend structure, volume value, and entry precision — the essence of professional trading logic.
Conclusion
Market Structure and Volume Profile Analysis form the backbone of modern price action trading. While market structure reveals the rhythm of price, Volume Profile uncovers the hidden story of participation and value.
By mastering both, traders can move beyond mere patterns and indicators to understand the true mechanics of market movement — where orders flow, where value builds, and where opportunity lies.
In essence, the market is a dynamic auction — and those who can read its structure and volume footprints gain a powerful edge. When used together with discipline and patience, these tools transform trading from guesswork into a structured, data-driven process.
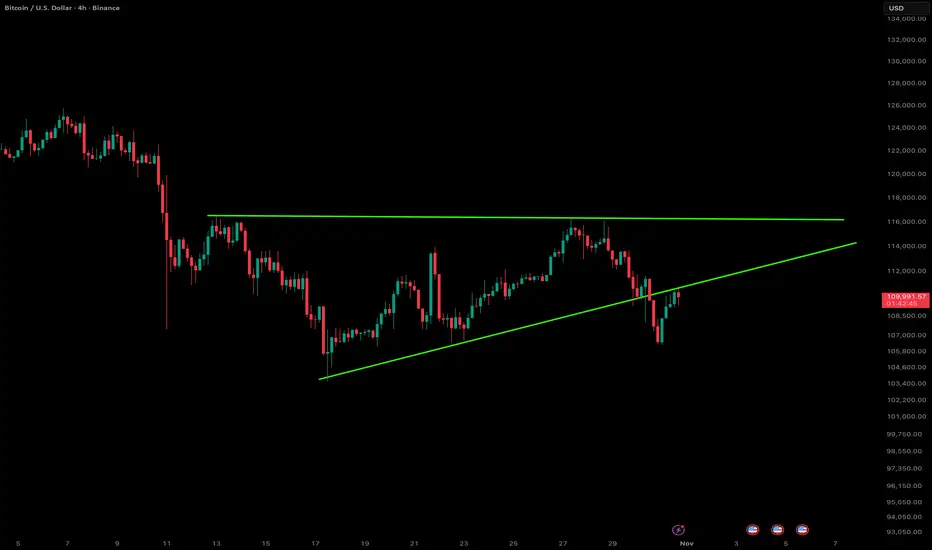
Bitcoin – Breakdown from the Ascending TriangleBitcoin just slipped below the ascending triangle support on the 4-hour chart, signaling a potential shift in short-term momentum. The structure had been forming higher lows toward the $115K resistance zone, but sellers stepped in hard near the top, breaking the trendline that’s been guiding the uptrend since mid-October.
The move comes amid broader weakness across the crypto market — BTC has shed about 3.7% this month, while altcoins like XRP and ETH are also struggling. Despite the pullback, Bitcoin still holds an impressive 18% gain for the year, so the bigger picture remains constructive.
Macro pressure seems to be weighing on sentiment — investor caution around interest rates, inflation, and the Fed’s next move is keeping volatility elevated. If upcoming data tilts toward another rate cut, we could see renewed upside momentum. But for now, price action suggests a possible retest of lower zones before bulls can re-establish control.
Overall, a clean technical breakdown in the near term, but the broader trend isn’t broken yet. Let’s see if bulls can reclaim that triangle support in the next few sessions.
DONT FORGET TO CHECK MY PROFILE BELOW 👇👇👇
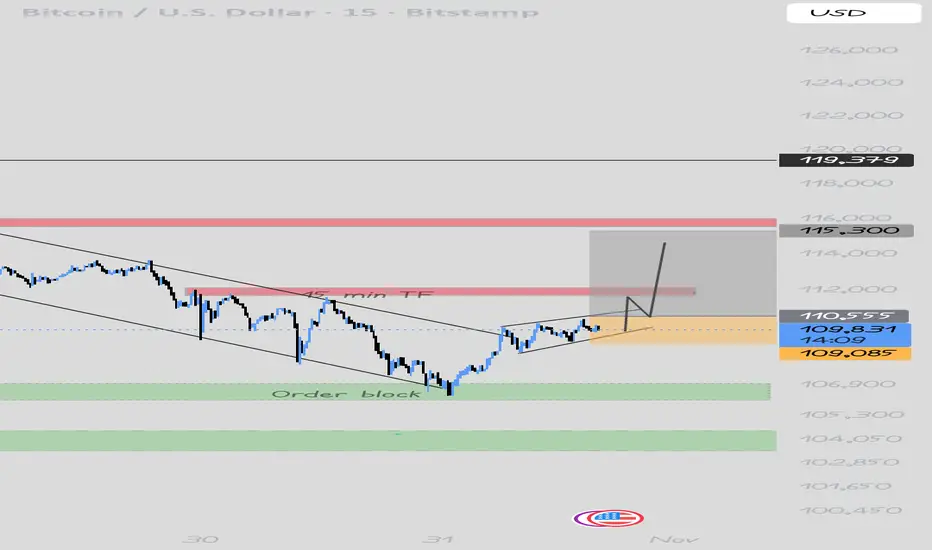
Btc current chart structure btc test the support at 106550 cBtc consolidated in 15 min TF around 110000 to 109000 and break this zone my target is 115000 previous resistance i look for
Swing according to 1 hour TF
This financial advice this is only my opinion my thoughts keep do your own anylise
Part 1 Support and Resistance Introduction to Option Trading
Option trading is a type of derivative trading where investors buy and sell contracts that give them the right—but not the obligation—to buy or sell an underlying asset (such as stocks, indices, or commodities) at a predetermined price within a specified period. The two basic types of options are Call Options and Put Options. A Call Option gives the holder the right to buy an asset, while a Put Option gives the holder the right to sell. Unlike futures, options provide flexibility and limited risk for buyers because they can choose not to exercise the contract if the market moves against them. This characteristic makes options one of the most versatile financial instruments in modern markets.

The Role of Sub-Brokers in India’s Financial MarketIntroduction
India’s financial market is one of the fastest-growing in the world, driven by rising participation from retail investors, a robust regulatory framework, and increasing digitalization. Within this ecosystem, sub-brokers have historically played a vital role as intermediaries who connect investors to the stock market through registered stockbrokers.
Although technological advancements and new regulatory norms have transformed their traditional role, sub-brokers continue to be significant, especially in expanding the reach of capital markets into smaller towns and rural areas. Their contribution lies not only in client acquisition but also in investor education, market accessibility, and financial inclusion.
Who is a Sub-Broker?
A sub-broker is an individual or entity who acts as an agent on behalf of a stockbroker to facilitate buying, selling, and trading of securities for clients. They do not hold direct membership of a stock exchange but work under a registered stockbroker who has that membership.
Essentially, a sub-broker serves as a bridge between the investor and the main broker. Before 2018, sub-brokers were directly registered with the Securities and Exchange Board of India (SEBI). However, SEBI later discontinued new registrations under this category, directing intermediaries to register instead as Authorised Persons (APs) under brokers.
Evolution of Sub-Brokers in India
The journey of sub-brokers in India is tied closely to the growth of the Indian stock market.
1. Pre-Demat Era
Before the introduction of electronic trading in the 1990s, the stock market was largely paper-based and operated through physical share certificates. Investors relied heavily on personal connections and local agents—who acted as early sub-brokers—to execute trades and manage portfolios.
2. Post-Demat and Online Trading
With the establishment of National Stock Exchange (NSE) and Central Depository Services (CDSL) in the 1990s, trading moved online. Sub-brokers began using digital platforms provided by brokers to execute client trades more efficiently, allowing them to serve a wider base of investors.
3. SEBI’s Regulatory Transformation
SEBI introduced strict norms to bring transparency to sub-broker operations. However, as technology simplified client onboarding, SEBI decided in 2018 to merge the “sub-broker” category into Authorised Persons to streamline supervision and compliance under brokers. Despite the name change, the function remains nearly identical — connecting clients to brokers and markets.
Registration and Compliance Framework
A sub-broker (or now an Authorised Person) must be associated with a SEBI-registered trading member or broker.
Key Requirements:
Broker Association: Must have a written agreement with a SEBI-registered broker.
Education and Experience: Generally, a graduate with sound knowledge of the stock market is preferred.
Infrastructure: Should have office space, internet access, and client service capacity.
KYC and AML Compliance: Must ensure all clients undergo Know-Your-Customer verification and follow Anti-Money Laundering norms.
Revenue Sharing Agreement: Income is typically commission-based, agreed mutually between the sub-broker and the broker.
Transition to Authorised Persons (APs):
After SEBI discontinued the sub-broker category, all existing sub-brokers were required to migrate to the AP model. This made regulatory control more streamlined and reduced duplication in supervision.
Functions of Sub-Brokers in the Financial Market
Sub-brokers perform several crucial functions that contribute to the health and expansion of India’s capital markets.
1. Client Acquisition and Onboarding
One of the most vital roles of sub-brokers is identifying potential investors, guiding them through account opening procedures, and ensuring compliance with KYC requirements. They help new investors, especially in smaller cities, understand trading basics and invest safely.
2. Trade Execution Support
Sub-brokers assist clients in executing trades through the broker’s platform. They explain market orders, stop-loss mechanisms, and portfolio diversification strategies, ensuring investors make informed decisions.
3. Investor Education
For many first-time investors, the sub-broker acts as a teacher. They provide insights into how the stock market works, how to interpret trends, and how to avoid common pitfalls. Their role as educators has been crucial in spreading market literacy across semi-urban and rural regions.
4. Advisory and Relationship Management
Sub-brokers often offer personalized guidance on stock selection, mutual funds, derivatives, or IPOs based on client risk profiles. They maintain long-term relationships by providing continuous portfolio updates and market insights.
5. Expanding Market Reach
Sub-brokers are instrumental in expanding the capital market’s reach. Many investors in Tier II and Tier III cities access stock markets for the first time through local sub-brokers, bridging the urban-rural investment gap.
6. After-Sales and Customer Service
Beyond trade execution, sub-brokers handle client grievances, documentation, and other service issues. Their local presence ensures clients receive quick and reliable support.
Revenue Model of Sub-Brokers
Sub-brokers primarily earn through commission-sharing with the broker. The typical structure involves:
Brokerage Sharing: A certain percentage (ranging from 40% to 80%) of the brokerage charged to clients is shared with the sub-broker.
Incentives: Brokers may offer incentives for achieving higher trading volumes or for onboarding a specific number of clients.
Advisory Fees: In some cases, sub-brokers may charge clients directly for financial advisory or portfolio management services (if authorized).
This model allows sub-brokers to scale their income with client activity while maintaining flexibility in operations.
Technological Transformation and Its Impact
The digital revolution in India’s financial services has redefined the role of sub-brokers.
1. Rise of Discount Brokers
Discount brokers such as Zerodha, Groww, and Upstox have simplified trading through mobile apps and zero-commission models. This reduced dependence on human intermediaries, impacting the traditional sub-broker structure.
2. Digital Client Onboarding
Online KYC, e-signatures, and instant account openings have made it easier for clients to join directly through digital platforms. Sub-brokers now use digital tools for faster onboarding and data management.
3. Hybrid Model Emergence
While online platforms dominate in metros, sub-brokers have adopted a hybrid model—using technology to execute trades but maintaining personal relationships to guide clients, especially those uncomfortable with technology.
4. Data-Driven Advisory
Modern sub-brokers use analytical tools, AI-based platforms, and CRM systems to provide smarter investment advice, track client portfolios, and generate better returns.
Challenges Faced by Sub-Brokers
Despite their importance, sub-brokers face several challenges in the evolving market environment.
1. Regulatory Changes
The shift from sub-broker to Authorised Person created confusion initially, requiring re-registration and adjustment to new norms.
2. Reduced Commissions
With the advent of discount brokers offering low-cost trading, sub-brokers have faced declining commission margins, affecting their income potential.
3. Technological Competition
Automated trading platforms and robo-advisors are reducing the need for manual guidance, especially among tech-savvy investors.
4. Compliance Burden
Strict KYC, reporting, and data privacy requirements demand administrative and technological investments that small sub-brokers may struggle to afford.
5. Market Volatility
Income of sub-brokers is linked to trading volumes. During market downturns, when investor participation drops, their revenue can fall sharply.
Regulatory Oversight by SEBI
SEBI has established a robust framework to ensure that sub-brokers or authorised persons operate transparently.
Key Regulations Include:
Mandatory association with SEBI-registered brokers.
Clear disclosure of revenue-sharing arrangements.
Strict prohibition against unauthorized trading or mis-selling.
Maintenance of investor grievance redressal mechanisms.
Continuous compliance audits and reporting.
These measures safeguard investor interests and maintain trust in the capital market.
Role in Financial Inclusion
Sub-brokers are essential in extending financial inclusion by:
Introducing stock market participation in smaller towns.
Encouraging investments in mutual funds and IPOs.
Helping individuals understand long-term wealth creation through equities.
Assisting in systematic investment planning (SIPs) and retirement planning.
Their local presence and personalized service have helped thousands of first-time investors navigate the complexities of financial markets.
The Future of Sub-Brokers in India
The future of sub-brokers lies in adaptation and evolution.
1. Shift to Advisory and Wealth Management
Instead of relying solely on trade commissions, many sub-brokers are transitioning to financial advisory, mutual fund distribution, and insurance services to diversify income.
2. Partnership with Digital Platforms
Collaborations with online brokers and fintech firms allow sub-brokers to leverage technology while maintaining a local relationship-driven model.
3. Focus on Tier II and Tier III Cities
As India’s smaller cities witness growing disposable income, sub-brokers will play a key role in onboarding new investors and expanding the financial ecosystem.
4. Upskilling and Certification
Continuous training in financial products, regulatory compliance, and technology will help sub-brokers remain competitive in the evolving landscape.
Conclusion
Sub-brokers have been a cornerstone of India’s financial market journey — from paper-based trading floors to digital stock exchanges. Their role as connectors, educators, and facilitators has expanded access to the market, empowered retail investors, and strengthened the foundation of financial inclusion.
Even though the structure has evolved into the Authorised Person model, the essence of their contribution remains unchanged. As India moves toward deeper capital market participation and digital finance, sub-brokers who embrace technology, transparency, and advisory-based services will continue to play an irreplaceable role in shaping the next phase of India’s financial growth.

Bitcoin Bybit chart analysis October 29 (FOMC)Hello
It's a Bitcoin Guide.
If you "follow"
You can receive real-time movement paths and comment notifications on major sections.
If my analysis was helpful,
Please click the booster button at the bottom.
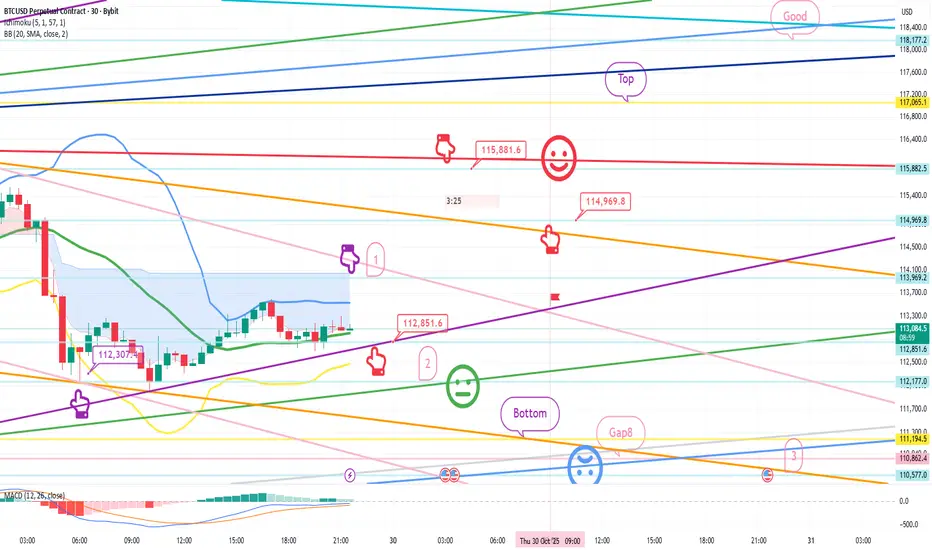
Here's a 30-minute Bitcoin chart.
Shortly, at 11 AM, there will be Nasdaq data releases.
At 3 AM, the FOMC releases data.
Unfortunately, yesterday's BTC move, which involved long and short positions, led to a strategy failure, so today's analysis will be completely public.
I ask for your support.
On the left, the purple finger connects yesterday's final long position entry point, the third section at $112,307.4.
While the interest rate cut is fundamentally positive,
I calculated the Nasdaq price fluctuations and implemented my strategy.
While there may be significant movements early in the morning,
BTC has many important elements, so I recommend reading carefully.
*Conditional Long Position Strategy: When the Red Finger Moves
1. After confirming that the purple finger touches the first section at the top,
the red finger marks the entry point for a long position at $112,851.6.
/ If the green support line is broken, set a stop loss price at $115,881.6.
1st target for a long position: $115,881.6 -> Target price at Top, Good, in that order.
If the strategy succeeds until the first target is touched, $114,969.8 is the point where the long position can be re-entered.
If the red resistance line is broken,
an uptrend could immediately resume.
If the price fails,
there's a possibility of another strong correction.
If the top section is touched before tomorrow's daily candlestick formation,
since this is the resistance line on the daily Bollinger Band chart,
a strong correction is likely,
it would be a good idea to enter a short position and then wait for a long position.
From the first section at the top to the orange resistance line,
a strong rebound is possible, so I don't recommend shorting.
If the price drops immediately without touching the first section,
then I recommend waiting for a final long position in the second section. If the green support line is broken,
then a pullback to the Gap 8 section at the bottom is highly likely.
Please note that if the green support line is broken,
then a pullback to the Gap 8 section at the bottom is highly likely.
Up to section 3 is open,
but this section is connected to the medium-term uptrend line,
so long positions should be held at all costs.
Yesterday's move also broke the first and fourth sections without any support,
breaking the medium-term pattern.
Since the 12-hour MACD dead cross isn't yet considered risky,
I proceeded as safely as possible, as the Nasdaq's movements were in line with it.
Please use my analysis to this point for reference only.
I hope you operate safely, adhering to principled trading and a stop-loss system.
Thank you.
Understanding Modern Consumption PatternsIntroduction: The Changing Face of Consumption
The way people consume goods and services has changed dramatically over the past few decades. Modern consumption is not just about purchasing necessities—it’s about experiences, identity, convenience, sustainability, and technology. Globalization, digitalization, and shifting cultural values have transformed the psychology and behavior of consumers worldwide. Today’s buyers are more informed, more connected, and more value-conscious than ever before. Understanding modern consumption patterns is crucial for businesses, policymakers, and economists, as these patterns influence production systems, marketing strategies, and even national economic growth.
1. The Shift from Ownership to Experience
One of the most striking trends in modern consumption is the transition from owning products to seeking experiences. Millennials and Gen Z consumers, in particular, are driving this shift. Instead of investing heavily in durable goods like cars or houses, many prefer spending on travel, entertainment, dining, and digital experiences.
This behavioral transformation is often described as the “experience economy.” Platforms such as Airbnb, Spotify, and Netflix exemplify this trend—offering access and enjoyment without ownership. The idea of “access over ownership” resonates with modern lifestyles that value flexibility and minimalism.
This shift also reflects deeper psychological and social changes. Experiences often provide emotional satisfaction and personal stories that physical goods cannot. Social media amplifies this effect by allowing consumers to share their experiences, creating a loop of social validation and aspirational living.
2. The Role of Digital Transformation
The rise of e-commerce and digital ecosystems has revolutionized consumption patterns. From Amazon to Alibaba, online shopping has made purchasing convenient, borderless, and data-driven. The 24/7 availability of products, along with quick delivery and easy returns, has made online buying the new normal.
Moreover, AI-driven personalization plays a critical role. Algorithms analyze browsing habits, purchase histories, and even search keywords to offer tailor-made product recommendations. Consumers are no longer passive participants—they interact with brands through reviews, ratings, and social feedback, shaping market trends in real time.
Mobile commerce is another force reshaping consumption. With smartphones in every hand, shopping happens everywhere—from metro rides to coffee breaks. Social commerce, where purchases are made directly via platforms like Instagram or TikTok, blurs the line between social interaction and consumerism.
3. Conscious and Sustainable Consumption
Modern consumers are increasingly environmentally aware and socially responsible. The rise of sustainable consumption is a direct response to climate change, resource depletion, and ethical concerns over labor practices.
Buyers today ask questions like:
Is this product eco-friendly?
Is it made ethically and locally?
Can it be recycled or reused?
Brands such as Patagonia, Tesla, and IKEA have successfully aligned themselves with sustainability narratives, attracting loyal customers who want their spending to reflect their values. This trend has led to the growth of circular economies, emphasizing reuse, repair, and recycling rather than linear production and disposal.
Greenwashing, however, is a growing concern. Some brands market themselves as sustainable without making substantial environmental commitments. This has pushed consumers to demand transparency through product labeling, supply chain visibility, and third-party certifications.
4. The Influence of Social Media and Influencer Culture
Social media has turned consumption into a social activity rather than a private decision. Platforms like Instagram, YouTube, and TikTok influence purchasing decisions by showcasing lifestyles, trends, and products through creators and influencers.
Influencers—often seen as relatable figures—shape consumer opinions more powerfully than traditional advertisements. Their reviews and endorsements make products appear authentic and attainable. This peer-based trust model has redefined how marketing works, especially among younger demographics.
However, the same ecosystem can lead to overconsumption and status anxiety. The constant exposure to curated images of luxury lifestyles encourages impulsive purchases and material comparison. The rise of “de-influencing” movements—where creators encourage minimalism or mindful spending—shows that even within social media, there is a countercurrent toward responsible consumption.
5. Demographic and Generational Shifts
Different generations exhibit distinct consumption behaviors shaped by their economic and technological environments.
Baby Boomers (born 1946–1964) still represent significant purchasing power, especially in real estate, healthcare, and luxury goods.
Generation X (born 1965–1980) values practicality, brand reliability, and work-life balance.
Millennials (born 1981–1996) prioritize experiences, convenience, and sustainability.
Generation Z (born after 1996) are digital natives—highly connected, socially aware, and experimental with brands.
Gen Z’s rise as a consumer force is particularly influential. They prefer brands with authenticity, inclusivity, and social responsibility. They also value digital-first interactions and expect seamless integration between online and offline experiences.
6. The Data-Driven Consumer Economy
In the modern age, data is the new currency. Every click, purchase, and search contributes to a consumer data trail that companies analyze to forecast trends and personalize offers.
From predictive analytics to AI-powered marketing, businesses can now anticipate consumer needs even before they are consciously expressed. Subscription models and loyalty programs use behavioral data to create recurring revenue streams.
However, this also raises serious privacy and ethical concerns. Consumers are becoming more aware of how their personal data is used. The introduction of regulations like GDPR (Europe) and DPDP (India) reflects growing efforts to protect user privacy. Future consumption models will need to balance personalization with transparency and consent.
7. The Rise of Convenience and Instant Gratification
Modern consumers live in an age of speed and convenience. Food delivery apps, one-click payments, same-day shipping, and on-demand entertainment all feed the desire for instant gratification.
This culture has redefined expectations—waiting is no longer tolerated. Retailers and service providers compete not only on price or quality but also on delivery speed, ease of use, and customer support efficiency.
However, this convenience culture also contributes to unsustainable consumption patterns, as the demand for instant products often leads to excessive packaging, high carbon footprints from logistics, and impulse purchases that result in waste.
8. Localization and Personal Identity in Global Markets
While globalization has expanded access to international goods, there is also a resurgence of local consumption. Consumers increasingly value products that represent local culture, authenticity, and craftsmanship. This trend is seen in the popularity of farm-to-table restaurants, handmade goods, and regional brands.
In countries like India, “vocal for local” campaigns have encouraged support for domestic industries and artisans. Similarly, many Western consumers seek unique, personalized products instead of mass-produced items.
Modern consumption is thus becoming glocal—a mix of global access and local identity. It reflects the desire for individuality in a world dominated by mass production.
9. The Subscription and Sharing Economy
The subscription model—from Netflix to meal kits to SaaS tools—represents a fundamental shift from one-time purchases to continuous relationships between brands and consumers. It creates predictable revenue for businesses and convenience for consumers who prefer flexibility over ownership.
Similarly, the sharing economy—typified by Uber, Airbnb, and community tool-sharing platforms—has transformed consumption into collaborative access. Instead of owning a car, you can share one; instead of buying a power drill you use once a year, you can rent it.
This shift is both economically efficient and environmentally beneficial, reducing waste and optimizing resource use. However, it also creates challenges in regulation, taxation, and labor rights, as seen in the gig economy debates.
10. Economic and Psychological Drivers
Understanding consumption patterns also requires exploring economic and psychological motives.
Economically, rising disposable incomes in emerging markets, coupled with easy credit and digital payment systems, have accelerated spending. Psychologically, consumption is deeply tied to identity formation and emotional fulfillment. Buying behavior often reflects aspirations, social belonging, and even self-expression.
The concept of “retail therapy”—shopping as a mood enhancer—shows the emotional side of consumption. However, post-pandemic behavioral studies reveal a growing shift toward mindful spending and financial caution, especially as inflation and global uncertainties affect household budgets.
11. Post-Pandemic Consumer Behavior
The COVID-19 pandemic marked a turning point in global consumption. Lockdowns accelerated e-commerce adoption, remote work increased demand for home improvement and digital gadgets, and health-consciousness soared.
Consumers became more selective, focusing on essential goods, health, and wellness. Simultaneously, digital payment systems, contactless delivery, and virtual experiences (such as online fitness or education) became mainstream.
Even after the pandemic, many of these habits have persisted, forming a hybrid consumption model—a blend of physical and digital experiences known as phygital retail.
12. The Future of Consumption: Personalization, Ethics, and Technology
Looking ahead, modern consumption will be shaped by three powerful forces:
Hyper-personalization through AI and machine learning, where products and services are tailored to individual needs.
Ethical and inclusive consumerism, focusing on equality, diversity, and transparency.
Technological integration, with AR/VR shopping experiences, blockchain-based product authentication, and the growth of virtual goods in digital worlds (metaverse consumption).
Consumers will expect brands not only to sell but also to stand for something—values, sustainability, or community engagement.
Conclusion: Toward Mindful Modern Consumption
Modern consumption patterns reflect a complex interplay of technology, psychology, and social values. Consumers today are informed, connected, and empowered—but also more demanding and conscious of their impact.
Businesses that thrive in this environment are those that understand why people buy, not just what they buy. The future of consumption lies in balancing convenience with sustainability, personalization with privacy, and global access with local authenticity.
In essence, modern consumption is a mirror of modern life—dynamic, digital, and deeply human. Understanding it means understanding how society itself evolves.

BTCUSDlook great Previous trend down Shortterm down trade We can plan
keep in mind also that FED meeting Today so plan according to this

BTC SUPPORT, RESISTANCE & TRENDLINE ANALYSIS Just follow the levels and the trendline.
I am travelling so just follow the levels for good and positive returns.
The bias remains Bullish.
Only if it breaks 111730 then we can plan for 110380 and 1095750.

Bitcoin Bybit chart analysis October 28Hello
It's a Bitcoin Guide.
If you "follow"
You can receive real-time movement paths and comment notifications on major sections.
If my analysis was helpful,
Please click the booster button at the bottom.
This is Bitcoin's 30-minute chart.
There's a Nasdaq indicator release coming up at 11:00 AM.
Bit has broken its short-term pattern by touching the center line of the 3-hour Bollinger Bands chart.
On the left, the purple finger indicates the entry point for the long position at $114,507.8, which we entered yesterday.
I've followed the same strategy. *Red Finger Movement Path:
Long Position Strategy
1. Confirm that the purple finger touches the first section at the top.
Red finger: $113,799.4 is the entry point for a long position.
/ If the green support line is broken, set a stop loss.
2. $117,065.1 is the first target for a long position. Target prices are set at Top and Good in that order.
If the strategy is successful, 115.9K is the point where the long position can be re-entered.
If the good section is reached before tomorrow's daily candlestick formation,
a correction may occur at the daily Bollinger Band resistance line.
A short position switch can be made.
If the price touches Section 1 at the top and rebounds strongly,
or if Section 2 is touched and rebounds within the purple support line,
a vertical rise is expected.
When the green support line breaks,
I've marked the support line from Bottom to up to Section 3.
Those who entered long yesterday at 114.5K should follow the same stop-loss order today when the green support line breaks.
I hope you'll continue to operate effectively, starting with Section 1 above.
By organizing this,
those who are long, those without a position, and those who are short
will all be able to utilize it.
Please use my analysis to this extent for reference only.
I hope you operate safely, adhering to principled trading and stop-loss orders.
Thank you.

Part 2 Support and ResistanceOption Pricing – The Black-Scholes Model
The price of an option (premium) is determined using models like the Black-Scholes Model, which considers several factors:
Underlying Asset Price
Strike Price
Time to Expiry
Volatility of the Underlying Asset
Risk-Free Interest Rate
Dividends (if applicable)
Of these, volatility and time decay have the most significant influence. As expiry approaches, options lose value due to time decay, especially for out-of-the-money contracts.

EMA Ribbon - Trend Strength & Reversal insight🧭 1. Overview
The EMA Ribbon is a set of multiple Exponential Moving Averages (EMAs) layered together to visualize the trend strength, direction, and possible reversals.
It helps traders identify when the market is trending strongly or losing momentum.
In this chart,
• Yellow lines = Short-term EMAs (react quickly to price)
• White lines = Long-term EMAs (show overall market direction)
When used together, they form a ribbon-like structure that acts as both dynamic support and resistance.
⸻⸻⸻⸻⸻⸻⸻⸻⸻⸻⸻⸻
📊 2. EMA Ribbon on Chart
• When the ribbon expands, it shows trend strength increasing — momentum is strong.
• When the ribbon contracts (becomes narrow), momentum is cooling, often leading to consolidation or reversal.
• The slope and crossover behavior of short and long EMAs reveal bullish or bearish momentum.
⸻⸻⸻⸻⸻⸻⸻⸻⸻⸻⸻⸻
🟢 3. Bullish Momentum
When short-term EMAs (yellow) stay above the long-term EMAs (white):
• EMA ribbon slopes upward → confirms an ongoing uptrend.
• Ribbon acts as a dynamic support zone — price often bounces from it.
• Indicates strong buying pressure and trend continuation.
• The wider the ribbon, the stronger the bullish momentum.
⸻⸻⸻⸻⸻⸻⸻⸻⸻⸻⸻⸻
🔴 4. Bearish Momentum
When short-term EMAs (yellow) fall below long-term EMAs (white):
• EMA ribbon slopes downward → confirms a downtrend.
• Ribbon acts as a dynamic resistance zone — price struggles to break above it.
• Indicates strong selling pressure and bearish control.
• Ribbon expansion during a downtrend suggests momentum strength from sellers
⸻⸻⸻⸻⸻⸻⸻⸻⸻⸻⸻⸻
📘 5. Summary
✅ Bullish Phase: Short EMAs above long EMAs → strong uptrend & support zone.
❌ Bearish Phase: Short EMAs below long EMAs → strong downtrend & resistance zone.
⚙️ Neutral / Reversal Phase: EMAs narrow together → momentum cooling, await breakout.
The EMA Ribbon is not just a visual trend indicator — it’s a dynamic momentum tool that adapts with price, helping traders identify both trend continuation and early reversal signs.
____________________________________________________________
⚠️ Disclaimer
📘 For educational purposes only.
🙅 Not SEBI registered.
❌ Not a buy/sell recommendation.
🧠 Purely a learning resource.
📊 Not Financial Advice.
