BTCUSDTBitcoin retracement is almost over. There is shift in Orders. Now it can start going down probably.
Trade ideas

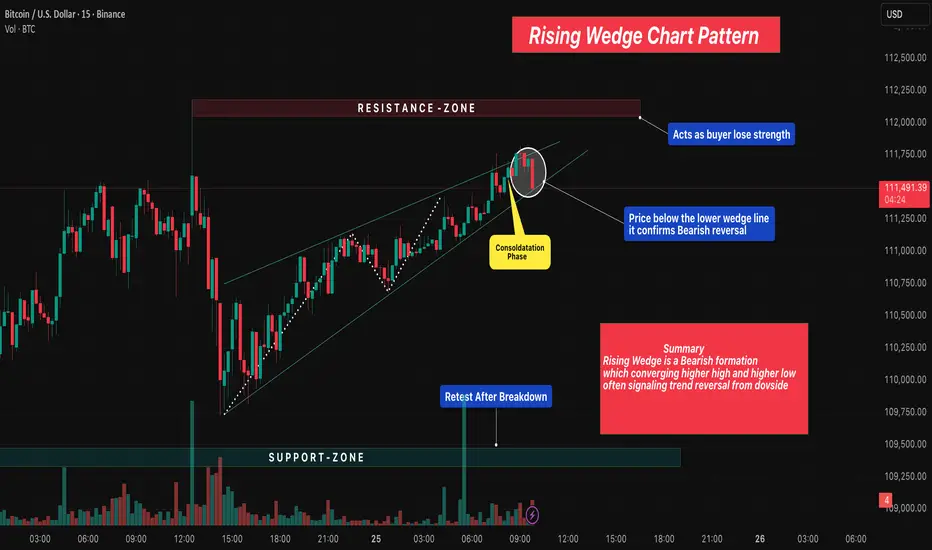
Rising Wedge Chart Pattern 🔎 Overview
The Rising Wedge Pattern is a bearish reversal setup that forms when price moves within a narrowing upward channel — creating higher highs and higher lows that converge toward the top.
It often appears after an uptrend, signaling that bullish momentum is weakening and sellers may soon take control.
As price rises inside the wedge, volume usually decreases, showing fading buyer strength before a potential breakdown .
____________________________________________________________
📔 Concept
• The pattern develops between two converging trendlines sloping upward.
• Each new swing high becomes smaller, showing exhaustion in buyers.
• A break below the lower wedge line confirms the bearish reversal.
• The expected move often equals the height of the wedge projected downward.
____________________________________________________________
📊 Chart Explanation
• Pattern Name → Rising Wedge Chart Pattern
• Resistance Zone → Acts as seller territory where buyers begin losing strength.
• Support Zone → Serves as the final defense; breakdown confirms bearish trend reversal.
• Consolidation Phase → Price compresses within the wedge before breakdown, showing indecision.
• Breakdown Confirmation → When price closes below the lower wedge line, it confirms bearish reversal.
• Retest After Breakdown → Price often retests the wedge from below before continuing downward.
• Summary → Rising Wedge is a bearish pattern of converging higher highs & higher lows, often signaling trend reversal from the upside.
____________________________________________________________
👀 Observation
The Rising Wedge shows weakening bullish pressure as the market climbs with smaller candles and lower volume.
Breakout traders monitor this setup for early reversal opportunities.
The most reliable setups occur near resistance zones or after extended rallies.
____________________________________________________________
💡 Conclusion
A confirmed breakdown below the wedge structure indicates sellers gaining control.
Using proper stop-loss, target projection, and volume confirmation can improve accuracy when trading this reversal formation.
____________________________________________________________
⚠️ Disclaimer
📘 For educational purposes only.
🙅 Not SEBI registered.
❌ Not a buy/sell recommendation.
🧠 Purely a learning resource.
📊 Not Financial Advice.
Part 12 Trading Master ClassOption Pricing Factors
The price (premium) of an option depends on multiple factors, including:
Underlying asset price
Strike price
Time to expiry
Volatility of the underlying asset
Interest rates and dividends
Two main pricing models used are the Black-Scholes Model and the Binomial Model.

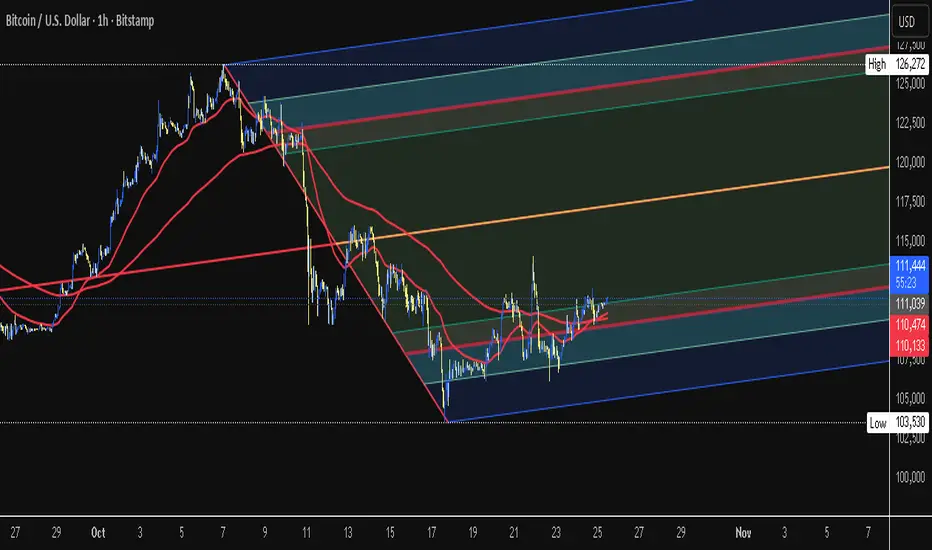
BTCUSD 1H Chart Analysis Using Pitchfox:BTCUSD 1H Chart Analysis Using Pitchfox:
Analyzing the BTCUSD 1-hour chart with the Pitchfork tool (Andrews Pitchfork), we observe that Bitcoin is currently consolidating just above the lower median of the projected pitchfork channel after a recent recovery from the $103,530 low. Price action is fluctuating between the median and lower bands, indicating a period of accumulation within a broader corrective structure.
Key levels for this setup:
- **Target (Take Profit):** $115,000 — aligning with the upper boundary of the channel, this zone coincides with recent resistance and the next projected reaction line as per the Pitch Fox model. [
- **Stop Loss:** $110,000 — just below the recent moving average ribbon and lower channel support to manage downside risk in case of a bearish reversal.
Expectations: A decisive breakout above the median could confirm further upside momentum toward the target, while a breakdown below support warns of a return to the $107,500–$103,500 area. Adjust SL/TGT as volatility develops.
**Risk Warning:** Crypto markets are volatile. Always use stop losses and manage your risk accordingly.
The Market Doesn’t Hate You — It’s Just Doing Its JobEvery trader at some point feels attacked by the market.
You take a trade, it hits your stop loss by one pip… and then runs perfectly in your direction.
You think, “The market is against me.”
But the truth is — the market doesn’t hate you.
It’s simply doing its job: collecting liquidity before moving to its real destination.
💡 Here’s What’s Really Happening
The market is a liquidity machine.
It moves where money is resting — not where traders wish it would go.
When you see price sweeping highs or lows before reversing, that’s not manipulation against you —
it’s Smart Money doing what it’s built to do:
Hunt liquidity
Fill institutional orders
Create displacement before the next move
Your stop loss isn’t being targeted personally —
it’s sitting where millions of other traders’ stops are clustered.
The market simply clears those levels before delivering the real move.
🧠 The Lesson
Stop trading emotionally and start thinking structurally.
Ask yourself before every setup:
Where is liquidity resting?
Has the market collected it yet?
Is structure confirming the new direction?
When you learn to think like Smart Money, you stop blaming the market and start understanding it.
You’ll realize every loss was a lesson pointing you toward better timing, discipline, and patience.
📊 Final Thought
The market is not your enemy — it’s your teacher.
Once you align with how liquidity and structure truly work,
you’ll stop feeling trapped and start trading with clarity and confidence.
💬 Follow for more institutional-based educational posts.
No signals. No hype.
Just pure trading knowledge and Smart Money insights that help you grow.

Bitcoin updated levels until 107000 not break and sustain buy onBitcoin updated levels bu on dip until 107000 not break
How My Harmonic pattern projection Indicator work is explained below :
Recent High or Low :
D-0% is our recent low or high
Profit booking zone ( Early / Risky entry) : D 13.2% -D 16.1 % is
range if break them profit booking start on uptrend or downtrend but only profit booking, trend not changed
SL reversal zone (Safe entry ) : SL 23.1% and SL 25.5% is reversal zone if break then trend reverse and we can take reverse trade
Target : T1, T2, T3, T4 and .
Are our Target zone
Any Upside or downside level will activate only if break 1st level then 2nd will be active if break 2nd then 3rd will be active.
Total we have 7 important level which are support and resistance area
Until , 16% not break uptrend will continue if break then profit booking will start.
If break 25% then fresh downtrend will start then T1, T2,T3 will activate
1,3,5,10,15,20 minutes are short term levels.
30 minutes 60 minutes , 2 hours,3 hours, ... 1 day and 1 week chart positional and long term levels

BTCMarket Structure
A clear Break of Market Structure (BMS) occurred to the upside, confirming a shift from bearish to bullish momentum.
The chart shows a sequence of Higher Highs (HH) and Higher Lows (HL) — classic uptrend confirmation.
The latest HH was formed around 111,800–112,000, and price is consolidating just below that zone — a sign of accumulation before a potential continuation.
Key Zones
Demand Zones (Potential Reentry Areas):
110,400 – 110,000 USD
109,800 – 109,600 USD
These zones represent unmitigated order blocks where bulls may defend positions if price retraces.
Resistance / Liquidity Area:
111,800 – 112,000 USD — short-term liquidity above current price; a breakout here could lead to another impulse leg toward 113,200 – 113,600 USD.
Outlook
As long as the structure maintains higher lows, bias remains bullish.
Price may retest the 110,400 – 110,000 zone before continuation.
A confirmed break and close above 112,000 can trigger momentum toward 113,600–114,000.
Summary
✅ Bias: Bullish
📈 Possible Long Entry: Around 110,400 – 110,000 (on bullish reaction)
🎯 Targets: 112,000 → 113,200 → 114,000
❌ Invalidation: Break below 109,600 would weaken the bullish structure.

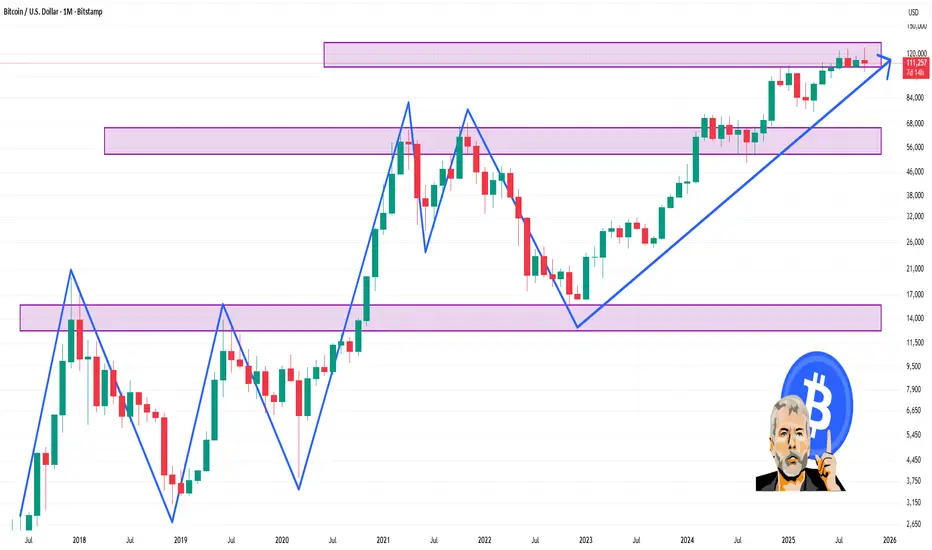
BTC 1 Month Time Frame 📊 1-Month Price Overview
Current Price: $110,933 USD
1-Month Change: Approximately -1.60%
Recent High: $126,272 USD on October 5, 2025
Recent Low: $103,632.70 USD
Average Price: $114,099 USD
🔮 Market Sentiment & Forecast
Analyst Sentiment: Despite recent declines, the overall sentiment remains bullish, with many analysts anticipating a potential rebound.
Price Forecast: Analysts predict that Bitcoin may reach approximately $115,340 within the next week and around $104,618 within four weeks
Bitcoin Bybit chart analysis October 23
Hello
It's a Bitcoin Guide.
If you "follow"
You can receive real-time movement paths and comment notifications on major sections.
If my analysis was helpful,
Please click the booster button at the bottom.
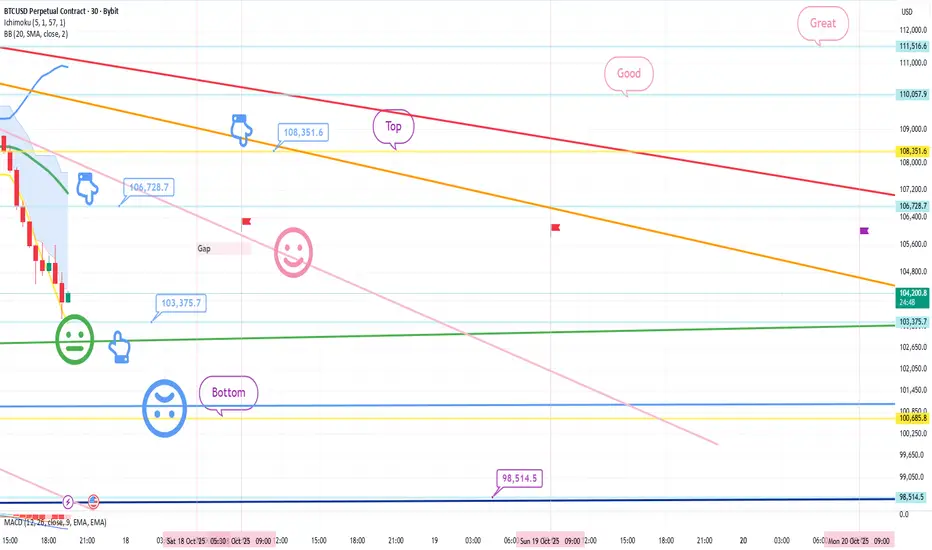
This is Bitcoin's 30-minute chart.
There's a Nasdaq release coming up at 11:00 AM.
At the bottom left, with the purple finger,
I've linked the strategy to yesterday's long position entry point, $107,146.8.
The Nasdaq is correcting after its medium-term pattern has broken,
and Bitcoin is on track for a golden cross on the 4-hour and daily MACD charts.
XAUUSD is losing strength in gold,
and yesterday, there was some decoupling on the Nasdaq.
It will be important to see whether Bitcoin gains strength.
*When the red finger moves,
I'm considering a one-way long position strategy.
1. $108,136.7 long position entry point / Stop loss price if the green support line is broken
2. $110,837.9 long position primary target -> Top, Good, in that order.
If the strategy is successful, 110.2K is the long position re-entry point.
If a successful rebound occurs within the purple support line of the first section above, a vertical rise is possible, so please keep this in mind.
Due to the Nasdaq correction today,
we will operate a little more safely.
If the bottom section is pushed today,
the mid-term uptrend line will also break,
which is not good for a long position.
Since points 2 and 3 are both double bottoms, they can be risky.
Since a touchdown could trigger a variable,
we recommend utilizing a 5-minute trend reversal.
Please note that my analysis so far is for reference only.
I hope you operate safely, adhering to principled trading and stop loss orders.
Thank you.

Part 3 Learn Institutional TradingHow Option Trading Works
Let’s say you believe that the stock of XYZ Ltd., currently trading at ₹100, will rise in the next month. Instead of buying 100 shares (which would cost ₹10,000), you could buy one call option that gives you the right to buy 100 shares at ₹100 (the strike price) within a month.
If this option costs ₹5 per share, your total cost is only ₹500 (₹5 × 100).
If the stock price rises to ₹120, you can exercise your call and buy the shares at ₹100, making a profit of ₹20 per share minus the ₹5 premium = ₹15 per share.
If the stock stays below ₹100, you simply let the option expire worthless, losing only your ₹500 premium.
This leverage — the ability to control ₹10,000 worth of stock with just ₹500 — is what makes options powerful but also risky.

Short-Term vs Long-Term Trading: Which Is Better?1. Understanding Short-Term Trading
Short-term trading refers to buying and selling financial instruments within a relatively brief period—ranging from seconds and minutes (scalping), hours (intraday trading), or a few days (swing trading). The primary goal is to capitalize on price fluctuations in the short run. Traders often use technical analysis, charts, patterns, and market indicators to predict price movements.
1.1 Types of Short-Term Trading
Scalping: This is the fastest form of trading, where traders take advantage of very small price changes, often multiple times in a day. Trades last seconds to minutes.
Intraday Trading: Positions are opened and closed within the same trading day to avoid overnight risks. Traders focus on volatility and liquidity.
Swing Trading: Positions are held for a few days or weeks to capture short- to medium-term trends. Swing traders rely on both technical and fundamental analysis.
1.2 Advantages of Short-Term Trading
Quick Returns: Traders can make profits faster since trades are closed within a short time.
Flexibility: Traders can enter and exit positions based on market opportunities without long-term commitment.
Leverage Opportunities: Short-term traders often use margin trading to increase exposure, potentially magnifying gains.
Avoid Long-Term Market Risk: Short-term trading avoids the uncertainty of long-term market cycles, such as recessions or geopolitical events.
1.3 Challenges of Short-Term Trading
High Stress: Frequent decision-making can be psychologically taxing, requiring discipline and emotional control.
Transaction Costs: High trading frequency leads to higher commissions, spreads, and slippage, which can reduce profitability.
Need for Constant Monitoring: Short-term traders must monitor markets continuously, often requiring advanced tools and software.
Market Noise: Short-term price movements can be erratic and influenced by speculation, rumors, or temporary trends, increasing the risk of losses.
1.4 Skills Required
Short-term trading demands a strong grasp of technical analysis, understanding of market sentiment, and the ability to act quickly on signals. Traders must have risk management strategies, such as stop-loss orders, to protect capital.
2. Understanding Long-Term Trading
Long-term trading, also referred to as investing, involves holding positions for months, years, or even decades. The focus is on the fundamental value of assets rather than short-term price movements. Investors aim to benefit from capital appreciation, dividends, and compounding returns over time.
2.1 Types of Long-Term Trading
Position Trading: Investors hold assets for months to years based on macroeconomic trends and company performance.
Value Investing: Investors analyze financial statements, management quality, and intrinsic value to identify undervalued assets.
Growth Investing: Focuses on companies with high potential for revenue and earnings growth, even if current valuations are high.
2.2 Advantages of Long-Term Trading
Reduced Stress: Long-term investors are less affected by daily market fluctuations.
Lower Transaction Costs: Fewer trades mean reduced brokerage fees and taxes.
Potential for Compounding: Reinvested profits and dividends can grow significantly over time.
Less Time-Consuming: Investors don’t need to monitor markets constantly.
Alignment with Economic Growth: Over long periods, markets generally trend upward, benefiting patient investors.
2.3 Challenges of Long-Term Trading
Capital Commitment: Long-term trading requires locking funds for extended periods, which may reduce liquidity.
Market Cycles: Investments may face downturns due to recessions, policy changes, or global crises.
Slower Returns: Compared to short-term trading, profits accumulate gradually.
Emotional Discipline: Staying invested during market volatility demands patience and confidence in one’s analysis.
2.4 Skills Required
Long-term trading requires fundamental analysis, understanding of macroeconomic trends, and the ability to evaluate a company’s financial health and competitive position. Emotional discipline is also crucial to resist panic selling during downturns.
3. Factors Determining Which Approach is Better
3.1 Risk Tolerance
Short-term trading suits those with a higher risk appetite and ability to handle volatility.
Long-term trading is preferable for conservative investors who prioritize stability and compounding.
3.2 Time Availability
Short-term trading demands active monitoring, sometimes for hours each day.
Long-term trading allows investors to spend minimal time, focusing on periodic analysis.
3.3 Capital Requirements
Short-term trading may require higher capital if leverage is used but also exposes traders to potential margin calls.
Long-term trading can start with moderate capital and gradually grow through compounding.
3.4 Market Knowledge
Technical skills are critical for short-term trading, as decisions depend on patterns and signals.
Understanding macroeconomics, industry trends, and company fundamentals is key for long-term trading.
3.5 Psychological Factors
Short-term trading requires mental toughness to cope with losses and avoid impulsive decisions.
Long-term trading requires patience and confidence to stick to an investment thesis despite market fluctuations.
4. Practical Examples
Short-Term Trading Example
A swing trader spots a stock in a strong uptrend due to positive earnings announcements. They buy at $100, set a stop-loss at $95, and target $110. Within a week, the stock hits $110, generating a 10% gain. The trader exits quickly, avoiding potential market reversals. This demonstrates the speed and tactical nature of short-term trading.
Long-Term Trading Example
An investor purchases shares of a stable technology company at $50, believing in its long-term growth. Over five years, the stock grows to $150, and dividends compound annually. Despite short-term market drops, the investor earns a 200% gain, illustrating the power of patience and compounding in long-term trading.
5. Integrating Both Approaches
Many experienced traders and investors combine short-term and long-term strategies to balance risk and returns:
Core-Satellite Approach: Maintaining a long-term portfolio (core) while taking short-term trades (satellite) to capture market opportunities.
Hedging: Short-term trades can hedge risks in a long-term portfolio during periods of volatility.
Diversification: Allocating capital to both strategies allows exposure to quick profits and long-term growth.
6. Conclusion: Which is Better?
There is no one-size-fits-all answer. The choice between short-term and long-term trading depends on individual goals, personality, capital, time availability, and risk appetite:
Short-term trading is suitable for active individuals seeking quick profits, with the skill and discipline to manage risk.
Long-term trading is ideal for investors seeking stability, compounding growth, and minimal daily stress.
Ultimately, combining elements of both approaches often yields the most balanced and effective strategy. The key is understanding personal priorities and aligning trading decisions accordingly. Short-term trading may offer excitement and rapid returns, but long-term trading delivers stability, growth, and peace of mind over time.
Part 2 Ride The Big Moves American vs. European Options
Options can be American-style or European-style. American options can be exercised any time before expiry, while European options can be exercised only on the expiry date. In India, stock options are American, while index options are European.
In-the-Money, At-the-Money, and Out-of-the-Money
These terms describe an option’s relationship to the current market price:
In-the-Money (ITM): Option has intrinsic value.
At-the-Money (ATM): Strike price equals the current price.
Out-of-the-Money (OTM): Option has no intrinsic value yet.

BTC 1 Week Time Frame 📊 1-Week Timeframe: Key Support & Resistance Levels
🔼 Resistance Levels
1st Resistance: $114,106
2nd Resistance: $117,201
3rd Resistance: $120,485
🔽 Support Levels
1st Support: $107,728
2nd Support: $104,445
3rd Support: $101,349
These levels are derived from Barchart's technical analysis.
PCR Trading Strategies Option Greeks – Risk Indicators
“Greeks” like Delta, Gamma, Theta, Vega, and Rho measure how sensitive an option’s price is to factors such as the underlying asset’s price, volatility, time decay, and interest rates. They help traders assess risk precisely.
Strategies and Combinations
Traders combine calls and puts to create option strategies such as straddles, strangles, spreads, and iron condors. These allow profit from different market conditions—rising, falling, or even sideways trends.

Part 1 Candle Stick PatternDefinition of Options
Options are financial contracts that give traders the right, but not the obligation, to buy or sell an underlying asset (like stocks, indices, or commodities) at a predetermined price within a specific time frame. They are a type of derivative since their value depends on the price of another asset.
Types of Options – Call and Put
There are two main types:
Call Option: Gives the right to buy the asset at a fixed price.
Put Option: Gives the right to sell the asset at a fixed price.
Traders use calls when expecting prices to rise and puts when expecting prices to fall.

BTC : RISING CHANNEL BREAK DOWN WITH 1:4 RR• BTC is trading inside upward trending channel from 17th October.
• Tried to break the channel top at 8.30 P.M. 21th October IST however breakout failed
• Big boys use this fake BO as liquidity trap and entered short.
continuous selling there after and now market testing the channel low.
• Underlying volume confirms the big boy's signature.
• At IST 11 a.m. market is trading near channel bottom.
• Go short if a candle close below 107450 with a sl 108250.
• All the three-target mentioned in the chart
• Trade with position sizing and psychology.
• Education purpose only.
• Happy trading.

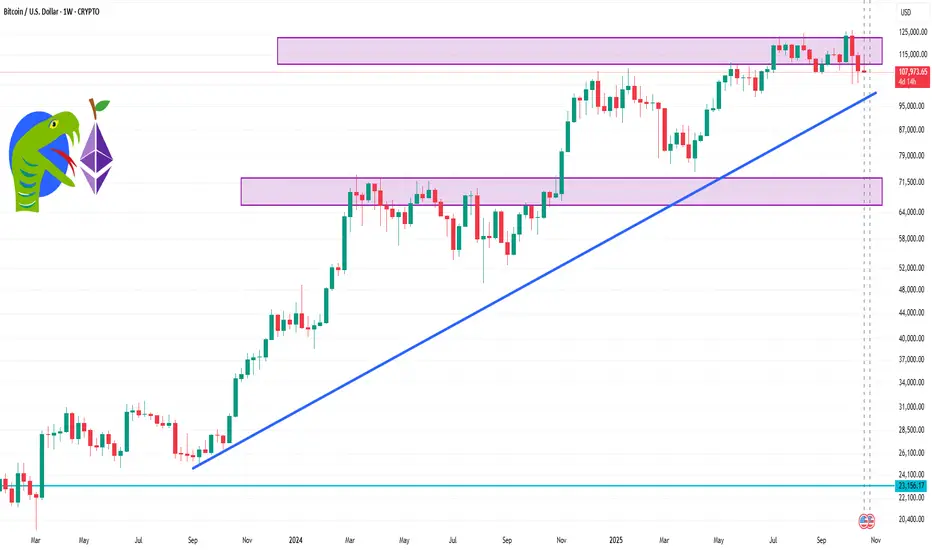
Bitcoin – Buying the Trendline, Not the HypeBitcoin (BTCUSD) continues to respect its rising trendline structure , showing consistent demand on every retest. This type of price action often reveals where smart money is quietly adding positions, not chasing, but accumulating near support.
Each of the highlighted points shows how price has respected this trendline multiple times, forming a clean series of higher lows. As long as this level holds, the broader direction remains bullish.
Currently, BTC is testing this key support once again. I’m positioning near the trendline because the risk is clearly defined , and the potential reward toward 111K+ remains wide open.
Short-term volatility can still appear, but structure beats emotions . As long as buyers defend this zone, we may see another impulsive leg forming soon.
Disclaimer: This analysis is for educational purposes only. It’s not investment advice. Always do your own research before trading.

BTCUSD SHOWING A GOOD UP MOVE WITH 1:10 RISK REWARD BTCUSD SHOWING A GOOD
UP MOVE WITH 1:10 RISK REWARD
DUE TO THESE REASON
A. its following a rectangle pattern that stocked the market
which preventing the market to move any one direction now it trying to break the strong resistant lable
B. after the break of this rectangle it will boost the market potential for break
C. also its resisting from a strong neckline the neckline also got weeker ald the price is ready to break in the outer region
all of these reason are indicating the same thing its ready for breakout BREAKOUT trading are follws good risk reward
please dont use more than one percentage of your capitalfollow risk reward and tradeing rules
that will help you to to become a bettertrader
thank you

BTC Key Levels in 15M and 1HCRYPTO:BTCUSD
15M and 1H Market Analysis
Currently, BTC is showing a steady recovery structure, holding well above its short-term supports and gradually approaching the Resistance Zone. The market has been consolidating in a controlled range after reclaiming key support levels, indicating that momentum is slowly shifting back in favor of buyers.
The Consolidation/Support Zone around $110,385 – $109,385 has played a crucial role in maintaining stability after the earlier correction. This zone has acted as a base for buyers to re-enter, confirming renewed demand at lower levels. As long as price remains above this range, the overall short-term sentiment stays constructive and tilted toward bullish continuation.
The next key challenge for BTC lies near the 1st Resistance at $112,377. This level represents the initial supply area, where the market might experience minor rejection or a brief pause before attempting continuation. A confirmed breakout above $112,377, backed by sustained candle closures, could open the path toward the 2nd Resistance zone around $113,191.
If BTC manages to push through both resistance zones, the structure would complete its short-term bullish breakout, setting up the move toward the Target at $115,096 — a level that aligns with higher-timeframe resistance and the upper boundary of the recent structural range.
On the downside, immediate structural support lies at the 1st Support around $110,385 and Second Support near $109,385, both of which align with previous breakout points and liquidity zones. A breakdown below these levels could lead to a retest of the Major Support at $108,602, which serves as the broader structural floor for the current recovery phase.
For now, BTC continues to trade constructively, maintaining higher lows and showing consistent absorption of sell pressure near the support zones. As long as the market sustains above $109,385, the bias remains bullish, with resistance breakouts being the key to unlocking further upside momentum toward the $115K target.
---
🧭 Summary:
Target: $115,096
2nd Resistance: $113,191
1st Resistance: $112,377
Consolidation/Support Zone: $110,385 – $109,385
1st Support: $110,385
2nd Support: $109,385
Major Support: $108,602
Market Tone: Bullish-to-neutral; structure holding steady above key supports.
Bias: Bullish above $109,385; breakout above $112,377 likely to extend momentum toward $113K–$115K.
Key Focus: Watch for breakout confirmation above $112,377 — sustained strength here could accelerate price toward the $115K zone.

BTC Market Update: Bulls Regain ControlBitcoin has stabilized after a sharp corrective phase, forming a consolidation structure around the $111,000 area. Recent sessions indicate that sellers are losing dominance while buyers are quietly re-accumulating within the current range. This type of price action often appears before a potential short-term recovery move.
Market volume remains steady, and the structure shows compression—suggesting liquidity buildup below the current level. If this consolidation sustains without breaking lower, a breakout toward the $115,000–$116,000 region appears likely. A clean move beyond this zone could invite stronger bullish continuation as sidelined traders re-enter.
However, the broader trend remains cautious, as macro conditions and dollar strength could still limit momentum. Short-term traders may look for entries near the range lows with clear invalidation below $108,000. Proper risk management remains essential, targeting gradual exits around mid-range levels and scaling profits near projected resistance zones.

Bitcoin Bybit chart analysis October 17Hello
It's a Bitcoin Guide.
If you "follow"
You can receive real-time movement paths and comment notifications on major sections.
If my analysis was helpful,
Please click the booster button at the bottom.
This is Bitcoin's 30-minute chart.
There are no Nasdaq data releases today.
Bit has been falling sharply since yesterday and today, as it has been coupled with the Nasdaq.
I've been thinking a lot about the possibility of further declines.
*When the light blue finger moves,
Bidirectional neutral
Short->Long switching or final long position strategy
1. $106,728.7 short position entry point / Stop-loss price upon breaking the pink resistance line
2. $103,375.7 long position switching / Stop-loss price upon breaking the green support line
3. Long position target prices, starting from the top section at the top
If the price falls immediately without touching the short entry point at 106.7K,
the final long position is at the bottom section at the bottom.
The bottom section is a double bottom, where the previous low is broken.
Because the lower tail may be pushed to $98,514.5, indicated at the bottom,
rather than placing a limit order,
we recommend switching long positions after confirming a trend reversal on the 5-minute chart.
More importantly, the Nasdaq movement appears to be the most important. It's frustrating that Bitcoin is coupled with the Nasdaq, which plummets at crucial moments, but it seems the coin market has never been easy.
At least if you're trading in real time, in a market where some people lose money while others make money, giving up would only hurt you.
In times like these, it's crucial to stay focused and practice principled trading and stop-loss orders.
Thank you for your hard work this week.
Part 8 Trading Master ClassLeverage and Speculation in Option Trading
Options provide leverage, allowing traders to control large positions with small investments. For instance, buying a single call option can represent ownership of 100 shares, magnifying both profits and losses. Speculators use this leverage to capitalize on short-term market moves. However, leverage also increases risk—if the market moves against the position, the entire premium can be lost. Successful speculators use strict risk management, combining analysis of volatility, momentum, and time decay to optimize entries and exits. While leverage makes options attractive, disciplined control is vital to avoid quick capital depletion.

Market Rotation Strategies1. Understanding Market Rotation
Market rotation refers to the periodic movement of capital from one sector, style, or asset class to another. It is based on the premise that financial markets are cyclical, and no single sector or investment style consistently outperforms over all market conditions. Investors or fund managers rotate capital to maximize returns by investing in sectors showing relative strength and exiting those likely to underperform.
The core drivers of market rotation include:
Economic cycles: Growth, expansion, slowdown, and recession phases influence sector performance.
Interest rates: Changes in rates affect interest-sensitive sectors like banking, utilities, and real estate.
Inflation trends: Inflationary pressures often shift capital toward commodities, energy, or inflation-hedged assets.
Investor sentiment: Market psychology drives rotation, often influenced by news, earnings, and macroeconomic indicators.
Valuation disparities: When one sector becomes overvalued relative to others, investors may rotate into undervalued sectors.
For instance, during economic expansion, cyclical sectors like technology, industrials, and consumer discretionary often outperform. Conversely, in a slowdown, defensive sectors such as healthcare, utilities, and consumer staples tend to attract more investment.
2. Types of Market Rotation Strategies
Market rotation strategies can be broadly categorized into sector rotation, style rotation, and geographical rotation. Each type targets a different aspect of market behavior.
2.1 Sector Rotation
Sector rotation is the most common type. It involves moving capital between sectors based on expected performance in the business cycle. Typical phases include:
Early expansion: Technology, consumer discretionary, and industrials tend to perform well.
Mid-cycle growth: Energy, materials, and financials may see higher returns.
Late-cycle/maturity: Utilities, consumer staples, and healthcare often outperform due to defensive characteristics.
Recession: Capital gravitates toward safe-haven sectors like utilities and healthcare, which maintain revenue despite weak economic conditions.
Example: A fund manager may reduce exposure to technology stocks during a rising interest rate phase (which hurts growth stocks) and rotate into financials or energy stocks that benefit from higher rates or inflation.
2.2 Style Rotation
Style rotation involves shifting between investment styles such as growth and value, or large-cap and small-cap stocks. Style rotation strategies are often correlated with interest rate changes, investor sentiment, and earnings trends.
Growth to value rotation: When interest rates rise, growth stocks (highly sensitive to discount rates) may underperform. Value stocks with strong fundamentals and dividends often become more attractive.
Size-based rotation: Small-cap stocks outperform during economic expansions due to higher earnings growth potential, while large-cap stocks provide stability in uncertain markets.
Example: In 2025, if inflation is high and interest rates rise, investors may rotate from speculative growth stocks to dividend-paying value stocks for stability and income.
2.3 Geographical Rotation
Geographical or regional rotation involves shifting capital across countries or regions based on macroeconomic conditions, monetary policies, and geopolitical developments.
Emerging markets: Attractive during global growth phases due to higher potential returns.
Developed markets: Preferred during global uncertainty due to stability and stronger corporate governance.
Example: Investors may rotate out of U.S. equities during economic slowdown and invest in Asian emerging markets experiencing higher growth momentum.
3. Indicators Used in Market Rotation
Successful market rotation relies on identifying sectors or assets likely to outperform. Investors often use a combination of technical, fundamental, and macroeconomic indicators.
3.1 Relative Strength Indicators
Relative strength compares the performance of one sector or stock against a benchmark index or another sector.
Sectors showing sustained relative strength are candidates for capital inflow.
Example: If the energy sector consistently outperforms the S&P 500 over three months, a rotation strategy may overweight energy stocks.
3.2 Economic Indicators
GDP growth: High growth phases favor cyclical sectors; slow growth favors defensives.
Inflation: Rising inflation benefits energy and commodity sectors, while hurting interest-sensitive sectors.
Interest rates: Higher rates favor financials, hurt growth stocks; lower rates favor growth and technology sectors.
3.3 Valuation Metrics
Price-to-earnings (P/E), price-to-book (P/B), and dividend yield comparisons help identify under- or overvalued sectors.
Investors rotate capital from overvalued to undervalued sectors to maximize returns.
3.4 Sentiment Indicators
Surveys, fund flow data, and market volatility indexes (e.g., VIX) indicate investor sentiment.
Excessive bullishness in one sector may signal an upcoming rotation to other sectors.
4. Implementation Approaches
Market rotation strategies can be implemented through active portfolio management, exchange-traded funds (ETFs), or algorithmic models.
4.1 Active Portfolio Management
Fund managers adjust sector weights dynamically based on economic forecasts, earnings reports, and valuation assessments.
Requires continuous monitoring and deep understanding of market cycles.
4.2 Exchange-Traded Funds (ETFs)
Sector ETFs allow investors to implement rotation strategies easily by buying and selling sector-specific ETFs.
Example: Rotating from technology ETF (XLK) to utilities ETF (XLU) based on macroeconomic conditions.
4.3 Quantitative and Algorithmic Rotation
Algorithms can analyze price trends, momentum, and macroeconomic data to automate rotation decisions.
Advantages: Removes emotional bias, executes faster than human managers, and identifies rotation opportunities in real-time.
Challenges: Model risk, overfitting, and sudden market shocks can impact performance.
5. Benefits of Market Rotation
Enhanced returns: Captures relative strength opportunities in outperforming sectors or styles.
Risk management: Reduces exposure to underperforming sectors, thereby lowering portfolio volatility.
Flexibility: Allows investors to adapt to changing economic conditions or market cycles.
Diversification: Rotation across sectors and regions spreads risk while improving potential returns.
Tactical advantage: Skilled investors can outperform passive index-tracking strategies during different market phases.
6. Risks and Challenges
Despite its advantages, market rotation carries inherent risks:
Timing risk: Incorrect timing of rotations can lead to underperformance.
Transaction costs: Frequent rotation increases trading fees and taxes, potentially reducing net returns.
Overreaction to signals: Excessive reliance on short-term indicators can lead to poor decisions.
Market anomalies: Unexpected geopolitical events, natural disasters, or policy changes can disrupt rotation strategies.
Sector concentration risk: Overweighting a sector based on rotation expectations can lead to significant losses if predictions fail.
7. Practical Examples of Market Rotation
Example 1: Economic Expansion Phase
Scenario: GDP growth accelerates, unemployment falls.
Rotation: Move capital into cyclical sectors such as consumer discretionary, industrials, and technology.
Rationale: These sectors benefit from rising consumer demand and business investments.
Example 2: Rising Inflation
Scenario: Inflation rises above central bank targets.
Rotation: Shift capital into energy, commodities, and real estate sectors while reducing exposure to growth stocks sensitive to interest rates.
Rationale: Commodities and real assets act as inflation hedges, preserving capital and generating returns.
Example 3: Recessionary Phase
Scenario: Economic slowdown, GDP contraction, high unemployment.
Rotation: Move capital into defensive sectors like healthcare, utilities, and consumer staples.
Rationale: Defensive sectors maintain stable revenue and dividends despite weak macroeconomic conditions.
8. Integrating Market Rotation with Portfolio Strategy
Market rotation should complement a broader investment strategy rather than operate in isolation. Key considerations include:
Strategic vs. tactical allocation: Core portfolio allocations should reflect long-term goals, while rotation strategies can adjust tactical weights based on market conditions.
Risk tolerance: Rotation intensity should align with investor risk appetite. Aggressive investors may rotate frequently, while conservative investors adopt gradual shifts.
Monitoring and evaluation: Continuous performance tracking ensures rotation decisions are validated by actual market outcomes.
Blending with other strategies: Combining rotation with dividend investing, value investing, or global diversification enhances portfolio robustness.
9. Technological Advances in Market Rotation
Modern market rotation strategies increasingly rely on technology:
AI and machine learning models: Detect patterns in historical sector performance and predict rotation opportunities.
Big data analytics: Evaluate macroeconomic, corporate, and market sentiment data in real-time.
Robo-advisors: Offer automated sector rotation strategies for retail investors with minimal manual intervention.
10. Conclusion
Market rotation strategies are a sophisticated approach to portfolio management, designed to capitalize on relative strength and sector performance shifts. By understanding economic cycles, valuation metrics, and investor sentiment, investors can systematically rotate capital to optimize returns and reduce risk.
However, successful rotation requires careful planning, disciplined execution, and ongoing monitoring. While it offers significant advantages over static buy-and-hold strategies, it also carries risks related to timing, transaction costs, and unexpected market shocks.
Ultimately, market rotation is about adapting to change, remaining nimble, and leveraging cyclical opportunities to achieve superior long-term investment outcomes. Investors who master the art and science of market rotation can navigate volatile markets more effectively and enhance portfolio resilience.
