Market Analysis: BTCBITSTAMP:BTCUSD $CRYPTO:BTCUSD+BITSTAMP:BTCUSD+BINANCE:BTCUSDT+BINANCE:BTCUSD+OANDA:BTCUSD+BYBIT:BTCUSDT+VANTAGE:BTCUSD+OKX:BTCUSD+KRAKEN:BTCUSD+BITFINEX:BTCUSD+FOREXCOM:BTCUSD+CAPITALCOM:BTCUSD+ICMARKETS:BTCUSD+BINANCE:BTCUSDC+EASYMARKETS:BTCUSD+MEXC:BTCUSDT+BLACKBULL:BTCUSD+EIGHTCAP:BTCUSD+FX:BTCUSD
Currently, the market is trading within a tight consolidation range after facing rejection near the upper resistance zone around $107,702 – $106,831. This area has repeatedly acted as a supply region, where short-term buying momentum has been absorbed and sellers have stepped back in to maintain control. The structure clearly indicates that the market is in a pause or retracement phase following a broader bearish move, showing indecision and equilibrium between buyers and sellers.
At the moment, price is holding within the Consolidation zone, just above the First Support level around $104,861, which has provided minor intraday stability. However, the lack of strong bullish momentum or continuation candles suggests that buyers are still hesitant to push higher. The market seems to be accumulating liquidity within this range, possibly preparing for its next directional expansion.
If the market breaks below $104,861, the probability of retesting the Major Support around $97,538 increases significantly. This support level remains a key structural zone — a potential demand area where buyers previously defended aggressively. A clean move into this zone could trigger renewed buying interest or even a potential short-term reversal setup.
On the upside, a break and sustained close above $107,700 would be the first sign of a momentum shift. Until then, this level continues to act as a critical resistance or rejection area, capping upward attempts. Only a strong reclaim above this range would open the door for a potential push toward $109,000+.
Overall, the broader bias remains bearish-to-neutral, with consolidation signaling a temporary pause before the next move. The market’s reaction near $104,861 and $107,700 will define the short-term direction — whether it chooses to resume the downtrend or attempt a recovery phase.
---
🧭 Summary:
Resistance / Rejection Zone: $107,702 – $106,831
Consolidation Range: $106,800 – $104,800
First Support: $104,861
Major Support: $97,538
Market Tone: Bearish-to-neutral; price consolidating after rejection.
Bias: Bearish below $107,700; potential downward continuation if $104,800 breaks.
Key Focus: Price behavior within $104,800–$107,000 range — a breakout or breakdown here will set the next short-term directional phase.
Trade ideas

Bitcoin Market Preparing for Upside MoveBitcoin is currently stabilizing after a sharp corrective phase.The market is showing early signs of demand re-entry near the liquidity base,indicating potential exhaustion of selling pressure.Recent structural reactions hint that buyers are preparing to reclaim control,which could initiate a short-term recovery leg toward the mid-range inefficiency zone.If momentum sustains,Bitcoin may expand higher,confirming a potential buy phase aligned with institutional accumulation signals.Overall,the outlook remains cautiously bullish as long as the market holds above its newly formed demand area.

BTC on a sell side OB BTC is taking rejection from sell side FVG.
We could see a bearish momentum downside.

BLOOD BATH IN BITCOIN Bitcoin is going to crash within 1/2 days only if sustains below 106,400 USD. We can plan for sell side after closing below the level. CRYPTO:BTCUSD . Mark the level and simple wait for the confirmation.

Crypto Trading Feels Like a Game – But It’s a Psychological War!Hello Traders!
Let’s be honest, trading crypto feels thrilling. Charts move fast, screens flash green and red, and every click feels like a win or loss in a video game.
But the truth is, this isn’t a game. It’s a psychological war , against greed, fear, and your own impulses.
Only those who master their minds survive long enough to win the real rewards.
1. The Illusion of Control
In games, you control the outcome, skill equals victory.
In trading, you control only your actions not the result.
Many traders lose because they think they can “beat” the market like a boss level.
You can’t control outcomes, but you can control decisions. That’s where real skill begins.
2. Emotional Triggers Are the Real Opponents
Greed makes you overtrade.
Fear makes you exit early.
Ego makes you hold losses longer than you should.
Every emotional decision takes you one step further from rational trading. The market punishes impatience, not intelligence.
3. The Endless Loop of Dopamine
Winning a trade releases dopamine, the same chemical that games and gambling use to keep you hooked.
This is why traders often feel “addicted” even when losing.
The key is not avoiding dopamine, but managing it through discipline and routine.
4. How to Turn the Game Into a Profession
Set clear rules and stick to them like a professional athlete follows training.
Don’t chase trades, wait for setups that fit your plan.
Detach emotions from results. Treat losses as tuition fees, not failures.
When you start thinking like a risk manager instead of a gamer, everything changes.
Rahul’s Tip:
The market doesn’t reward excitement, it rewards patience and control.
Every trader is fighting the same battle, but only those who master psychology turn chaos into consistency.
Conclusion:
Crypto trading might look like a game with flashing charts and instant rewards, but in reality, it’s a war within yourself.
Winning here isn’t about beating others, it’s about mastering your reactions when emotions take over.
If this post gave you a reality check, like it, share your thoughts in comments, and follow for more deep trading psychology lessons!
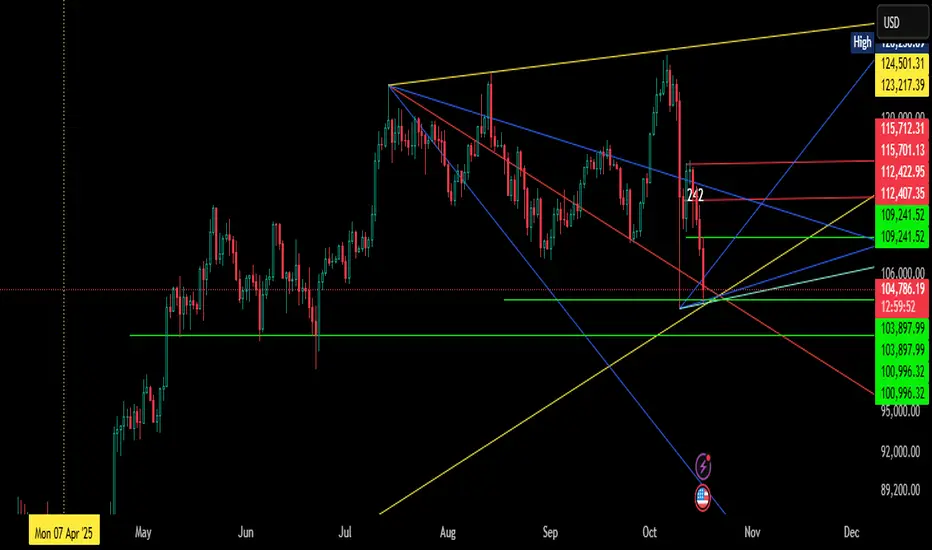
BTC REVERSAL EXPECTEDAs per the chart MY view is that BTC may not break previous low and todays low might not be broken.
what behind my thought if you draw a trend line which i drawn here in YELLOW. may work as support,If you go to past you will get the point which is meeting and forming trend line i.Let's mention that date 5/8/24 and 7/4/25. join the date and get long term trend support.
If you look this chart upper side of gan fan you can see yellow trend line joining the previous TOP which is not part of gann fan.
I think this much explanation is sufficient to understand why this low may not break.
Even then if get broken you must consider trend line as support.
this is not buy/sell call.
Part 1 Ride The Big Moves Definition of Option Trading
Option trading is a financial strategy where traders buy or sell contracts that give them the right, but not the obligation, to buy or sell an underlying asset—such as stocks, indices, or commodities—at a specific price before a set date. These contracts are called “options.” The two main types are call options (right to buy) and put options (right to sell). Unlike owning the asset directly, options provide flexibility, allowing traders to profit from both rising and falling markets while limiting risk to the premium paid for the option.

BTC Squeezing Like Hell!BITSTAMP:BTCUSD Bitcoin monthly chart has been squeezing like hell. The Bollinger Band Width is currently at 90.66.
Historically, whenever the BBWidth has fallen below 100 (as in 2016, 2020, and 2023), it has tended to resolve on the upside. Since the prices are still on the upper band, we believe this time will be no different.
With 2 weeks more to go before the monthly candle establishes, any closure above $100,000 must not instill any downside fear.
At 90.66, the BBWidth is at the lowest in history, and, theoretically, a big move on either side is in the offing.

#BTCUSD #CRYPTOA classical Descending Triangle breakout on hourly chart of BTCUSD
Executed fresh shorts few hours ago posting a bit late due network issues.

BITCOIN 1HRSWING TRADE
- EARN WITH ME DAILY 10K-20K –
BITCOIN Looking good for Downside..
When it break level 110338 and sustain.. it will go Downside...
SELL @ 110338
Target
1st 105685
2nd 100862
Enjoy trading traders.. Keep add this STOCK in your watch list..
Big Investor are welcome..
Like this Post??? Hit like button..!!!
Follow me for FREE Educational Post and Alert..

Introduction to High Time Frame (HTF) Trading1. Understanding the Concept of High Time Frame (HTF) Trading
High Time Frame (HTF) trading is an approach where traders base their decisions on higher-duration charts such as the daily (1D), weekly (1W), or monthly (1M) time frames. Unlike short-term traders who focus on intraday fluctuations or minute-to-minute changes, HTF traders analyze the broader market structure to identify long-term trends, key support and resistance levels, and major reversals.
The goal of HTF trading is to align trades with the dominant market trend while minimizing the impact of short-term volatility and noise. It is a strategy favored by swing traders, position traders, and long-term investors who prefer a more patient, structured, and disciplined approach to market participation.
In essence, HTF trading is not about predicting short-term price movements but about understanding the bigger picture of market direction and trading with higher conviction.
2. The Importance of Time Frames in Trading
In trading, time frames determine how data is visualized on a chart. Each candlestick or bar represents a specific duration of price activity. For instance, in a 1-hour chart, each candle shows the open, high, low, and close within that hour. Similarly, in a weekly chart, each candle represents the price action of an entire week.
The choice of time frame shapes the trader’s strategy:
Low Time Frames (LTFs) – like 1-minute, 5-minute, or 15-minute charts – are used by scalpers and intraday traders for quick trades and small profits.
Medium Time Frames (MTFs) – such as 1-hour or 4-hour charts – help swing traders capture short-term trends.
High Time Frames (HTFs) – such as daily, weekly, or monthly charts – provide a broader perspective and are used for long-term decision-making.
HTF charts filter out random market noise and reveal the true structure of market trends. They act as a foundation for all forms of trading because even intraday traders benefit from understanding the dominant HTF trend.
3. Why Traders Choose High Time Frame Trading
HTF trading appeals to many traders for several reasons:
a) Clearer Market Structure
High time frames help traders see the overall direction of the market without being distracted by short-term fluctuations. Trends, consolidations, and reversals are easier to identify, enabling traders to make more informed and less emotional decisions.
b) Reduced Market Noise
Lower time frames are filled with false signals caused by random volatility. HTF trading eliminates much of this noise, allowing traders to focus on significant price action and key technical levels.
c) Stronger Trade Signals
Signals that appear on higher time frames – such as breakouts, moving average crossovers, or candlestick patterns – tend to be more reliable. For example, a bullish engulfing pattern on the daily chart holds more weight than the same pattern on a 5-minute chart.
d) Better Risk-to-Reward Ratios
HTF setups generally offer wider stop-loss levels but also much larger potential profits. Traders can capture multi-day or multi-week trends rather than short bursts of volatility.
e) Less Screen Time
Unlike day traders who need to monitor charts constantly, HTF traders can analyze the market once or twice a day. This suits those with full-time jobs or other commitments, making it a more flexible trading style.
4. The Core Principles of HTF Trading
To trade effectively on higher time frames, traders must follow certain foundational principles:
a) Patience
HTF trading requires patience because setups take time to form. A trader might wait several days or weeks for the ideal entry point, but the reward is typically worth the wait.
b) Trend Alignment
Trading with the trend is crucial in HTF analysis. Identifying whether the market is in an uptrend, downtrend, or consolidation phase helps avoid low-probability trades.
c) Multi-Time Frame Confirmation
Even in HTF trading, traders often combine multiple time frames to confirm trends. For example, a trader might use the weekly chart to identify the main trend and the daily chart to find entry points.
d) Risk Management
Since trades are held for longer durations, position sizing and stop-loss placement become critical. Traders must calculate their risk carefully, as drawdowns can be larger on higher time frames.
e) Emotional Discipline
HTF traders must stay disciplined and avoid overreacting to intraday market fluctuations. Emotional resilience is key because trades can take time to mature.
5. Commonly Used High Time Frames
HTF traders typically analyze the following charts:
Daily Chart (1D): Used to capture trends lasting from a few days to several weeks. It’s the most popular time frame for swing traders.
Weekly Chart (1W): Suitable for position traders who hold trades for weeks or months. It offers insights into long-term market direction.
Monthly Chart (1M): Used by long-term investors and portfolio managers to identify macro trends, economic cycles, and historical price zones.
By analyzing these charts together, traders can identify key confluences – such as when daily support aligns with weekly resistance – which strengthens trade decisions.
6. Technical Tools and Indicators for HTF Trading
HTF traders rely on a mix of price action and technical indicators to validate their setups. Some commonly used tools include:
a) Moving Averages
Moving averages like the 50-day, 100-day, or 200-day MA help identify the overall trend direction. When price stays above the 200-day MA, it generally signals a long-term uptrend.
b) Support and Resistance Zones
These levels mark areas where price has historically reacted. HTF traders often draw zones from weekly or monthly charts since these act as powerful reversal or breakout levels.
c) Trendlines and Channels
Trendlines connect significant highs or lows, showing the direction and strength of a trend. Channels highlight potential areas of support or resistance within the trend.
d) Fibonacci Retracements
Fibonacci levels (e.g., 38.2%, 50%, 61.8%) help HTF traders spot retracement zones where price might reverse within a larger trend.
e) Volume Analysis
Volume on HTFs reflects institutional activity. High volume near support or resistance confirms stronger buying or selling pressure.
f) Candlestick Patterns
Patterns such as engulfing candles, pin bars, or hammers carry more weight on HTF charts. For example, a weekly bullish engulfing candle can indicate the beginning of a strong long-term rally.
7. The Process of HTF Analysis
A systematic approach to HTF trading generally involves these steps:
Step 1: Top-Down Analysis
Traders begin by analyzing the highest relevant time frame (monthly or weekly) to determine the overall trend. They then move down to daily charts to refine entry and exit points.
Step 2: Identify Key Levels
Mark significant zones of support, resistance, and trendlines. These areas act as potential entry or exit points.
Step 3: Wait for Confirmation
Patience is essential. Traders wait for confirmation signals like breakouts, retests, or candlestick reversals before entering a trade.
Step 4: Plan the Trade
Define entry, stop-loss, and target levels before execution. Proper planning reduces emotional decision-making during live market movements.
Step 5: Manage the Trade
Once in a position, traders monitor weekly or daily closes to decide whether to hold or exit. Trailing stops can be used to lock in profits as the trend progresses.
8. Advantages of HTF Trading
Higher Accuracy:
HTF setups filter out false signals, offering more reliable trade opportunities.
Lower Stress Levels:
Traders are not glued to screens all day, reducing emotional fatigue.
Better Trend Participation:
Traders can capture larger moves by following macro trends instead of reacting to short-term volatility.
Easier Decision-Making:
Since HTF signals develop slowly, traders have more time to analyze before entering.
Compatibility with Fundamental Analysis:
HTF trading aligns well with macroeconomic and corporate fundamentals, making it ideal for investors combining technical and fundamental analysis.
9. Disadvantages and Challenges
While HTF trading has many benefits, it is not without drawbacks:
Fewer Trading Opportunities:
High-quality setups take time to form, which can be frustrating for impatient traders.
Larger Stop-Loss Requirements:
Because price movements on HTFs cover more ground, stop losses must be wider, demanding a larger capital base.
Potential for Long Drawdowns:
Trades may stay in negative territory for days or weeks before turning profitable, testing a trader’s patience.
Missed Short-Term Profits:
HTF traders may ignore smaller opportunities visible on lower time frames.
10. Combining HTF with Lower Time Frames
Many experienced traders blend HTF and LTF analysis through a multi-time frame strategy. For example:
Use the weekly chart to define trend direction.
Use the daily chart to spot entry zones.
Use the 4-hour chart to fine-tune entries and stop-loss placement.
This combination allows traders to maintain alignment with the major trend while optimizing entries for better risk-reward ratios.
11. HTF Trading Psychology
Success in HTF trading relies heavily on mindset and discipline. Traders must:
Detach from short-term noise.
Trust their analysis and plan.
Embrace patience – setups take time, and emotional decisions can ruin a good trade.
Accept losses gracefully since even high-probability setups can fail.
Think long-term – focus on consistent growth over time rather than daily results.
12. Case Study: HTF Trading Example
Imagine a trader analyzing Nifty 50 on a weekly chart.
The weekly trend shows higher highs and higher lows — a clear uptrend.
The trader identifies strong support at 21,000 and resistance at 23,000.
On the daily chart, price retraces to 21,200 with a bullish engulfing candle.
The trader enters long with a stop-loss below 20,900 and targets 23,000.
This trade aligns with the weekly trend, uses a daily confirmation for entry, and aims for a large reward relative to the risk — a textbook example of HTF strategy.
13. Ideal Markets for HTF Trading
HTF trading works best in markets with strong trends and liquidity, such as:
Equities (e.g., Nifty, Reliance, TCS, Bajaj Finance)
Commodities (Gold, Crude Oil)
Forex Pairs (USD/INR, EUR/USD)
Cryptocurrencies (Bitcoin, Ethereum)
Since HTF traders rely on macro trends, these instruments’ price movements often reflect economic or geopolitical events, offering consistent long-term opportunities.
14. Key Mistakes to Avoid
Checking Charts Too Frequently:
Over-monitoring causes emotional interference.
Ignoring Risk Management:
Large stop-loss levels require careful position sizing.
Trading Against the Trend:
Fighting the dominant HTF direction leads to unnecessary losses.
Entering Without Confirmation:
Waiting for candle closes on HTFs avoids false breakouts.
15. Conclusion: The Power of the Bigger Picture
High Time Frame trading is a disciplined, patient, and powerful approach to market analysis. It emphasizes clarity over noise, conviction over haste, and trend-following over prediction. By aligning with the dominant market trend, traders can enhance their accuracy, reduce emotional stress, and achieve more consistent long-term results.
While HTF trading requires patience and emotional control, it rewards traders with higher-quality setups, deeper insights into market behavior, and sustainable profitability. Whether applied to stocks, forex, or commodities, mastering HTF analysis allows traders to think like institutions — focusing not on what happens in minutes or hours, but on what truly drives the market in days, weeks, and months.
Bitcoin sell recommended near 115000 enjoy huge profit book nowBitcoin ssll recommended near 115000 book profit buy also on lower price
How My Harmonic pattern projection Indicator work is explained below :
Recent High or Low :
D-0% is our recent low or high
Profit booking zone ( Early / Risky entry) : D 13.2% -D 16.1 % is
range if break them profit booking start on uptrend or downtrend but only profit booking, trend not changed
SL reversal zone (Safe entry ) : SL 23.1% and SL 25.5% is reversal zone if break then trend reverse and we can take reverse trade
Target : T1, T2, T3, T4 and .
Are our Target zone
Any Upside or downside level will activate only if break 1st level then 2nd will be active if break 2nd then 3rd will be active.
Total we have 7 important level which are support and resistance area
Until , 16% not break uptrend will continue if break then profit booking will start.
If break 25% then fresh downtrend will start then T1, T2,T3 will activate
1,3,5,10,15,20 minutes are short term levels.
30 minutes 60 minutes , 2 hours,3 hours, ... 1 day and 1 week chart positional and long term levels

BTC forming wonderful scenarioBTC is forming good scenarios for bullish and subsequently bearish trade. It has created ABC pattern and retracing back to bullish FVG. We need to wait for price getting into right zones. We may also see a sell side trade once reaches to bearish FVG.
1. Currently price has broken ABC pattern neckline and retracing towards 1h FVG.
2. We may also see a sell side trade once price tap into bearish FVG and shows reversal pattern.
3. Most probably price will take liquidity of FVG and create MSS/CISD/TS/iFVG in LTF.
4. Price should show rejection/reversal in LTF (5m,1m) at FVG zone.
5. Take the trade only once clear entry model i.e. turtle soup. iFVG break, CDS or MSS happens on LTF
All these combinations are signalling a high probability and ~4R trade scenario.
Note – if you liked this analysis, please boost the idea so that other can also get benefit of it. Also follow me for notification for incoming ideas.
Also Feel free to comment if you have any input to share.
Disclaimer – This analysis is just for education purpose not any trading suggestion. Please take the trade at your own risk and with the discussion with your financial advisor.

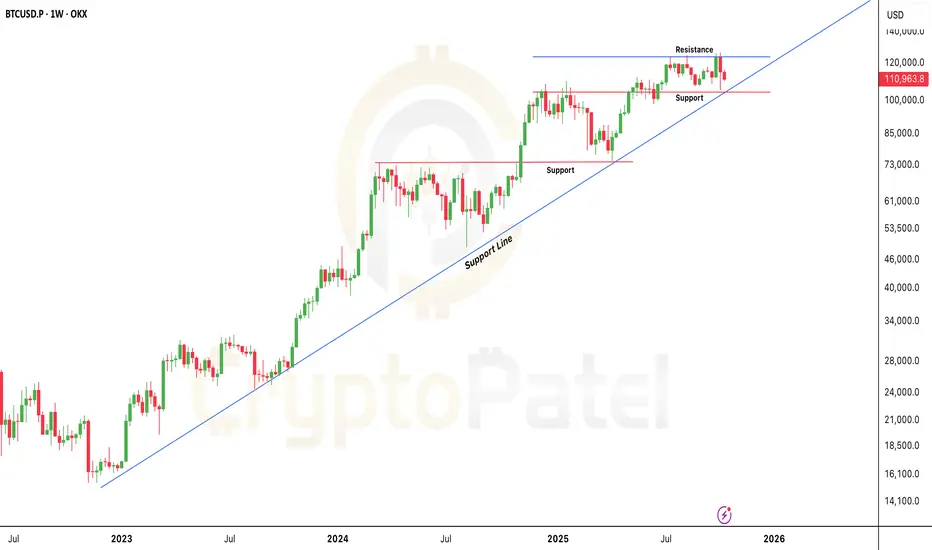
If Bitcoin Loses This Level: Expect the Biggest Correction YetIf Bitcoin Loses This Level: Expect the Biggest Correction Yet
Current Market Overview:
Bitcoin is trading above $110,000, maintaining a bullish stance for now. However, short-term momentum looks weak as the market tests crucial support levels.
Key Support Zone:
The most critical area to watch is $104,000 – $105,000.
This zone aligns with the long-term bullish trendline, which has held firm through multiple market corrections.
As long as price stays above this trendline, the broader trend remains bullish.
Bullish Scenario:
If Bitcoin holds above the $104,000 support level, it signals strength and potential continuation of the uptrend.
In that case, the next upside target remains around $150,000 in the coming months.
Bearish Scenario:
If the $104,000 trendline breaks decisively, Bitcoin may enter a deeper correction phase.
Downside targets could extend to below $100,000, and in a worst-case scenario, even toward $80,000.
Technical Summary:
🔹 Immediate Resistance: $110,000 – $112,500
🔹 Major Support Zone: $104,000 – $105,000
🔹 Trend Bias: Bullish above $104,000 | Bearish below $104,000
🔹 Long-Term Target: $150,000 (if support holds)
Trading Insight:
This is a decisive zone for Bitcoin. Bulls must defend $104k to maintain structure.
Below it, expect volatility and potential trend reversal signals.
NFA & DYOR
Part 1 Ride The Big Moves What is Option Trading?
Option trading is a type of derivatives trading where the value of the contract is based on an underlying asset, such as a stock, index, or commodity. An option gives the trader the right, but not the obligation, to buy or sell the underlying asset at a fixed price (called the strike price) before or on a specific date (called the expiry date). There are two main types of options — Call Options and Put Options.
A Call Option gives the right to buy the asset.
A Put Option gives the right to sell the asset.
Traders use options for hedging risks, speculating on price movements, or earning income through premiums.

Policy Developments in Derivatives and Commodities MarketsIntroduction
The derivatives and commodities markets are critical components of the global financial system. They provide essential tools for risk management, price discovery, and investment diversification. Derivatives—contracts whose value derives from underlying assets like commodities, equities, or currencies—enable participants to hedge against price volatility. Commodities markets, on the other hand, facilitate trading in raw materials such as oil, metals, and agricultural products.
Over the past few decades, these markets have witnessed significant evolution in both their structure and regulatory frameworks. Policymakers and regulatory authorities across the globe have introduced reforms to enhance transparency, reduce systemic risk, and promote market efficiency. These policy developments have become increasingly important in light of financial crises, technological advancements, globalization of markets, and growing participation from retail investors.
1. Historical Context of Derivatives and Commodities Regulation
The regulation of derivatives and commodities markets has evolved in response to market crises and structural changes. Historically, commodities trading, especially in agricultural products, was lightly regulated, primarily aimed at preventing fraud and market manipulation. In contrast, modern derivative markets grew exponentially in the 1980s and 1990s with the rise of financial engineering and complex instruments like options, swaps, and futures.
Major events that shaped policy include:
The 1987 Stock Market Crash: Highlighted the need for robust oversight of derivative instruments and their impact on financial markets.
The 2008 Global Financial Crisis: Exposed systemic risks inherent in over-the-counter (OTC) derivatives markets, prompting regulators to focus on transparency, collateralization, and centralized clearing mechanisms.
Commodity Price Volatility: Sharp swings in oil, metals, and agricultural products prices led to government interventions to stabilize markets, protect consumers, and ensure fair trading practices.
These events underscored the importance of developing robust regulatory frameworks to safeguard market integrity while fostering innovation.
2. Objectives of Policy Developments
Regulatory policies in derivatives and commodities markets aim to achieve several key objectives:
Market Integrity: Preventing manipulation, insider trading, and fraudulent practices.
Transparency: Ensuring that market participants have access to accurate and timely information about prices, trading volumes, and open positions.
Financial Stability: Reducing systemic risk that arises from excessive leverage, interconnected financial institutions, and OTC derivatives exposures.
Consumer Protection: Safeguarding investors, particularly retail participants, from misleading practices or excessive risk exposure.
Promotion of Market Efficiency: Ensuring smooth price discovery and liquidity in the markets.
Alignment with International Standards: Harmonizing domestic regulations with global best practices set by organizations such as the International Organization of Securities Commissions (IOSCO) and the Financial Stability Board (FSB).
3. Key Policy Developments in Derivatives Markets
3.1 Introduction of Central Clearing
One of the most significant reforms after the 2008 financial crisis was the push for central clearing of standardized OTC derivatives. Central counterparties (CCPs) act as intermediaries between buyers and sellers, reducing counterparty risk. Regulatory frameworks such as Dodd-Frank Act (USA, 2010) and the European Market Infrastructure Regulation (EMIR, EU, 2012) mandated clearing of certain interest rate and credit derivatives through CCPs.
Impact:
Reduced systemic risk from bilateral exposures.
Standardized collateral requirements.
Improved market transparency.
3.2 Trade Reporting and Transparency
Regulators worldwide have introduced mandatory trade reporting requirements to enhance transparency in derivatives markets. Trade repositories collect and publish data on derivative transactions, including notional amounts, counterparties, and trade dates.
Examples of regulatory measures:
Dodd-Frank Act: Requires real-time reporting of swaps transactions to swap data repositories.
EMIR: Obligates EU market participants to report derivative trades to trade repositories.
Impact:
Increased market visibility.
Facilitated monitoring of systemic risk and market abuse.
3.3 Margin and Collateral Requirements
To mitigate counterparty risk, regulators have introduced margin requirements for both cleared and non-cleared derivatives. Initial margin protects against potential default losses, while variation margin ensures that daily gains and losses are settled.
Impact:
Reduced excessive leverage in derivatives trading.
Promoted financial stability and investor confidence.
3.4 Standardization of Contracts
Policy frameworks encourage the standardization of derivative contracts to facilitate central clearing and improve liquidity. Standardization covers contract size, settlement dates, underlying asset definitions, and documentation standards.
Impact:
Easier to trade on exchanges or through CCPs.
Lower operational and legal risks for participants.
3.5 Risk-Based Supervision
Regulators are increasingly adopting risk-based approaches to monitor derivative markets. This involves focusing on systemically important institutions, products, and trading strategies that could pose the greatest risk to financial stability.
Impact:
Efficient use of regulatory resources.
Early identification and mitigation of systemic threats.
4. Key Policy Developments in Commodities Markets
4.1 Position Limits and Speculation Controls
Excessive speculative trading can destabilize commodity prices. Regulators have introduced position limits to restrict the number of contracts a participant can hold in futures markets. These limits aim to prevent market manipulation and excessive concentration of risk.
Examples:
Commodity Futures Trading Commission (CFTC) in the US sets speculative position limits for energy, metals, and agricultural contracts.
Securities and Exchange Board of India (SEBI) imposes position limits in commodity futures markets to curb volatility.
4.2 Market Surveillance and Anti-Manipulation Measures
Commodity exchanges and regulators have strengthened market surveillance to detect and prevent price manipulation, spoofing, and front-running. Sophisticated monitoring systems track trading patterns in real-time to identify anomalies.
Impact:
Enhanced investor confidence.
Reduced market distortions caused by artificial price movements.
4.3 Integration with Global Markets
Globalization of commodities trading has prompted harmonization of regulations across borders. Policymakers focus on aligning rules regarding contract specifications, reporting, and settlement to facilitate international participation.
Examples:
Cross-border recognition of clearinghouses.
Adoption of international standards on warehouse receipts and quality certification for agricultural commodities.
4.4 Commodity Derivatives for Hedging and Risk Management
Governments encourage the use of commodity derivatives for legitimate hedging purposes by producers, consumers, and traders. Policy initiatives include reducing regulatory burdens for hedgers while monitoring speculative activities.
Impact:
Enhanced price discovery and risk management.
Support for farmers, manufacturers, and energy companies in managing input costs.
4.5 Technological Innovations and Policy Adaptation
Digital trading platforms, algorithmic trading, and blockchain-based commodity exchanges have transformed the market landscape. Regulators are adapting policies to address new risks, including cyber threats, algorithmic market manipulation, and transparency challenges in decentralized trading.
Impact:
Improved market efficiency and accessibility.
Necessitated development of technology-driven monitoring tools.
5. Emerging Trends in Policy Development
Sustainability and ESG Integration: Policies increasingly emphasize environmental, social, and governance (ESG) compliance. Commodity trading in carbon credits, renewable energy certificates, and ESG-linked derivatives is growing.
Retail Participation Regulation: With growing retail interest in commodities and derivatives, regulators are introducing education initiatives, leverage limits, and product suitability requirements.
Cross-Market Risk Management: Integrated policies are addressing interconnected risks between derivatives, commodities, and other financial markets.
Global Coordination: Bodies like the IOSCO and FSB coordinate policy frameworks to prevent regulatory arbitrage and systemic instability.
6. Challenges in Policy Implementation
Despite significant reforms, regulators face several challenges:
Complexity of Derivative Products: Highly customized contracts are difficult to monitor and standardize.
Global Market Fragmentation: Different jurisdictions have varied regulatory standards, creating arbitrage opportunities.
Technological Disruptions: High-frequency trading, AI-based strategies, and decentralized exchanges introduce new risks.
Balancing Innovation and Risk: Policymakers must ensure that innovation is not stifled while protecting market participants.
7. Conclusion
Policy developments in derivatives and commodities markets have transformed these markets into safer, more transparent, and efficient mechanisms for risk management and investment. Central clearing, trade reporting, margin requirements, and position limits have enhanced market integrity and financial stability. Regulatory emphasis on transparency, standardization, and risk-based supervision has reduced systemic threats while fostering investor confidence.
As these markets continue to evolve with globalization, technological innovation, and ESG integration, policymakers must remain agile. Future regulatory frameworks are likely to focus on harmonizing global standards, enhancing surveillance capabilities, promoting sustainability, and safeguarding retail participants. Effective policy development in derivatives and commodities markets not only mitigates risks but also ensures that these markets continue to serve as vital tools for price discovery, hedging, and economic growth.
FOMO Trading – The #1 Killer in Crypto Market!Hello Traders!
Every bull run, the same story repeats, people buy when prices are high, panic when they drop, and wonder why they always lose.
It’s not the strategy or the market that fails, it’s FOMO (Fear of Missing Out) .
FOMO is the most powerful psychological trap in the crypto world, and it silently destroys more accounts than any other mistake. Let’s break it down.
1. What is FOMO in Trading?
FOMO happens when you see others making profits, and you jump in late out of fear of missing out.
You don’t analyze, you react emotionally.
By the time you buy, smart money is usually exiting, leaving you to hold the bag.
2. How FOMO Starts
Social media hype, influencer tweets, or fast-moving green candles create excitement.
Your brain says, “I’m missing this move, I need to enter now.”
That emotion makes you forget your plan, position sizing, and stop loss.
This is exactly when professionals take advantage, because they know retail is chasing.
3. The FOMO Cycle
You see price pumping → You buy high.
Price drops → You panic and sell low.
Price recovers → You feel regret and chase again.
Repeat, until your capital is gone.
4. How to Break the FOMO Habit
Remind yourself: the market will always give another opportunity.
Set rules, if a trade has already moved 5–10% without you, skip it.
Focus on setup quality, not speed.
Plan your trades when the market is calm, not when your heart is racing.
Rahul’s Tip:
The best traders are not the fastest, they’re the most patient.
Every missed trade teaches discipline; every forced trade teaches pain. Choose your lesson wisely.
Conclusion:
FOMO is not just a bad habit, it’s emotional trading disguised as “opportunity.”
The moment you stop chasing, your trading transforms from desperate to disciplined.
In crypto, the patient trader always outlasts the impulsive one.
If this post helped you see how FOMO affects your trading, like it, share your thoughts in comments, and follow for more real-world trading psychology insights!

BTCUSD SELL LIMIT TRADE PLAN Trade Setup: BTCUSD – Sell Limit*
I'm looking to short BTCUSD around the **$111,800 – $112,000** zone. Price is reacting off a descending trendline and rejecting from the **0.5–0.618 fib retracement** of the last leg down — showing signs of weakening bullish momentum.
*Reason for Entry*
Strong downtrend in play
Trendline + Fib confluence Bearish structure holding
Sell Limit: $111,900
Stop Loss: $112,300 (above structure + trendline break)
Take Profits*:
TP1: $110,600
TP2: $110,000
TP3: $109,700 (if momentum continues)
Key Levels
Resistance**: $111,900 – $112,200
Support**: $110,300 and $110,000
Waiting for price to tap into the zone and show rejection — looking for a clean move back down with trend.

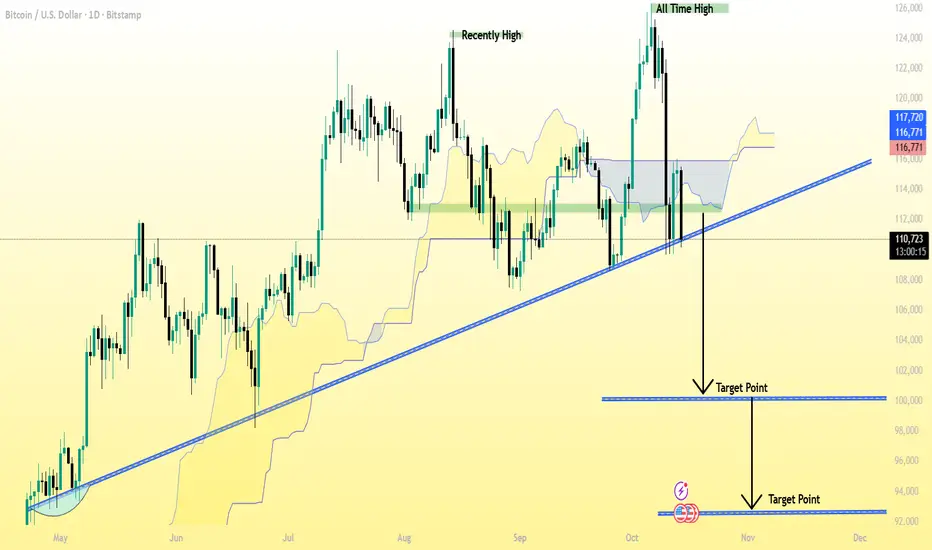
BTC/USD (Bitcoin) 1D (Daily) chart Pattern.BTC/USD (Bitcoin) 1D (Daily) chart 👇
✅ Current Price: around $110,685
✅ Trend: Bearish breakdown — price has clearly broken below the long-term ascending trendline.
✅ Market structure: After rejecting near $117,000, BTC dropped below both the Ichimoku cloud and the trendline — confirming downside pressure.
---
🎯 Target Levels (Downside)
1. Primary Target: $100,000 – $98,000
This matches my first marked “Target Point”.
It’s a strong historical support zone and aligns with previous price consolidation.
2. Extended / Final Target: $94,000 – $92,000
This is the second target point shown on my chart.
It would be the next major support if BTC continues falling after $98,000 breaks.
---
🛡 Resistance / Stop-Loss
Immediate resistance: $113,000 – $114,000 (broken trendline retest zone).
Stop-loss for short trades: above $115,000 – $116,000 (invalidates bearish setup).
---
🔍 Summary
Trend bias: Bearish (break of trendline + below cloud)
Sell zone: $111,000 – $113,000
Target 1: $100,000 – $98,000
Target 2: $94,000 – $93,000
Stop-loss: above $115,000
BTCUSD CONTINUATION UPDATE ( 4H )As expected from our previous setup, BTCUSD respected the supply zone near 116,000–117,000, perfectly reacting from the premium range of our last impulse leg. The rejection confirmed a clean Market Structure Shift (MSS) around 112,400–113,000, shifting control back to the sellers.
After the MSS, price retraced back to fill the imbalance and mitigate the 4H bearish order block, then continued its descent toward our partial take-profit zone around 110,800–111,000, which has already been reached and delivered solid profits.
Currently, BTC is consolidating just above the discount range (107,800–107,300), aligning with a small 4H demand zone and the 0.618 fib retracement of the prior impulse. This area is crucial — it’s where short-term buyers may attempt a bounce, but our overall structure still leans bearish until we reclaim 113,200 with a strong 4H close.
Below lies uncollected liquidity and extended targets at:
0.786 Fib: 105,850
1.0 Projection: 103,100
1.618 Expansion: 95,100
Our short entries from the 115k region are currently floating over +1,400 USD per lot, showing strong momentum in line with the macro bearish swing.
🎯 Plan Moving Forward:
Maintain partials secured around 110,800.
Trail the remainder below 110,500 structure to protect profits.
Continue targeting the deeper liquidity zones (103k–105k) unless market structure flips bullish.
❌ Invalidation:
A clean 4H close above 113,200 will signal potential shift back to bullish order flow — in that case, we’ll monitor for new FVGs or OBs to plan re-entry.

PCR Trading Strategies Introduction to Option Trading
Option trading is a segment of the financial market where traders buy and sell contracts that give them the right—but not the obligation—to buy or sell an asset at a predetermined price within a specific time period. These contracts are known as options. Unlike stocks or commodities, where traders own the underlying asset directly, options allow traders to speculate on price movements, hedge risks, or leverage their investments.

BTC HOURLY SUPPORT/RESISTANCE FOR THE DAY ONLYThere is plot of two GANN FAN.
I marked here support and resistance in red and green color you can follow if interested this is my analysis on the basis of chart .
here a table is drawn in which cordinates of fans are mentioned so that you can plot it easily on your chart.
Note:- If support get broken you can follow red trend line for support and reversal.the chart is for INTRADAY. It may not work for next day keep it in mind.
this is not buy/sell call.

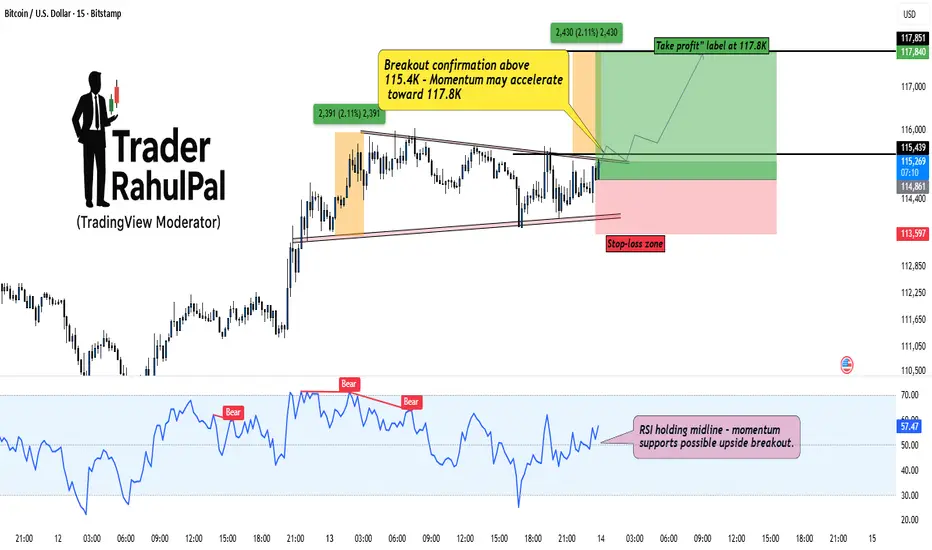
BTC – Building Discounted Longs Before the Breakout?Bitcoin (BTCUSD) is currently consolidating within a tight compression zone, showing signs of accumulation near 114.8K–115.4K . The market is coiling up right under resistance, hinting that a potential breakout could be around the corner.
As seen on the chart, structure remains bullish with a well-defined base and higher low formation. The key breakout confirmation lies above 115.4K , which could trigger a momentum push toward 117.8K , aligning with previous swing projections.
However, I’m personally building a small discounted entry position even before the confirmed breakout. The reason? When momentum starts expanding, it rarely gives clean entries, so catching early positioning near support provides better R:R potential.
RSI is holding above the midline, reflecting sustained buyer strength, while volume compression suggests a volatility expansion phase ahead. If price manages to sustain above the upper trendline, expect quick upside continuation.
Stop-loss remains below 113.6K to stay protected against fakeouts.
Rahul’s Tip:
Smart money often positions early when the crowd hesitates — timing matters, but conviction matters more.
Analysis By @TraderRahulPal (TradingView Moderator)
If this helped you spot the setup early, like and follow for more real-market insights.
Disclaimer: This analysis is for educational purposes only and should not be taken as financial advice. Please do your own research or consult your financial advisor before investing.