Bitcoin Bybit chart analysis June 30 Hello
This is Bitcoin Guide.
If you "follow"
You can receive real-time movement paths and comment notifications on major sections.
If my analysis was helpful,
Please click the booster button at the bottom.
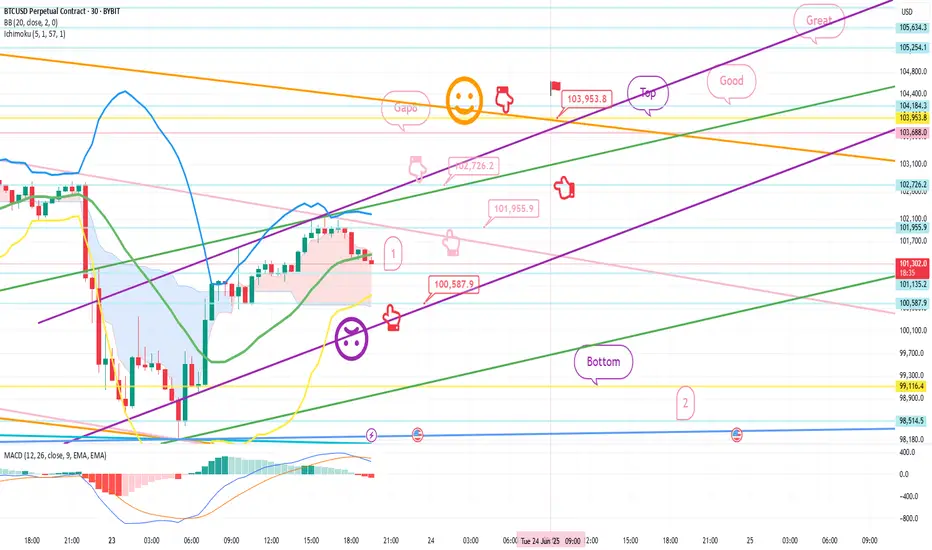
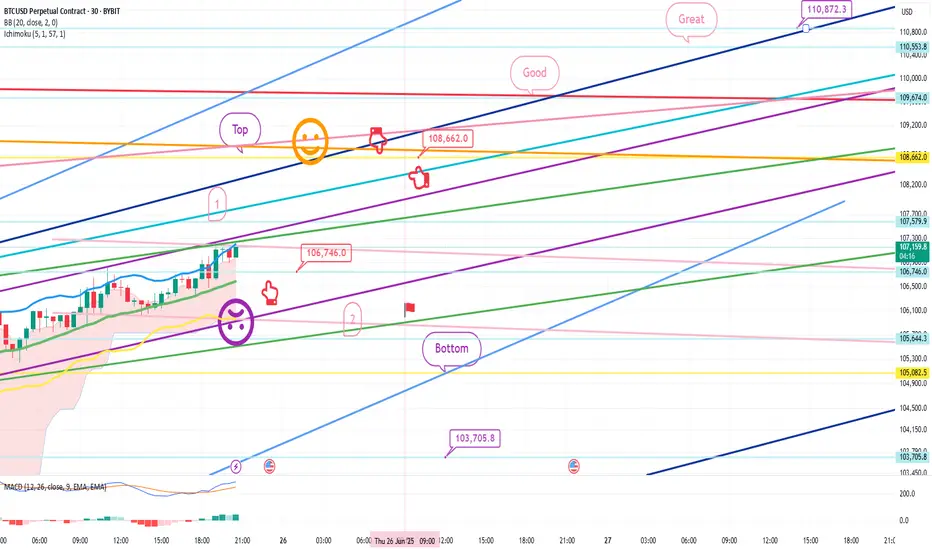
This is the Bitcoin 30-minute chart.
There is no separate indicator announcement today.
The weekly and daily charts are being adjusted at the same time as they are created.
The strategy was carried out based on the Nasdaq pattern and the Tether dominance pattern.
The long position entry section on the 25th, $106,746, was connected as is.
*When the blue finger moves,
It is a two-way neutral
short->long switching or long waiting strategy.
1. $108,138.1 short position entry section / stop loss price when orange resistance line is broken
2. $107,507.9 long position switching / stop loss price when green support line is broken
3. $108,507.9 long position 1st target -> Good 2nd target price
You can also use the long position re-entry indicated in the middle.
If it comes down right away without touching the short entry section at the top,
it is a long waiting strategy at the gap section of 107,102.7 dollars,
and the stop loss price is the same.
And, if it succeeds in rebounding within the purple support line today,
the reason it is safe from a long position is
because the low point of the weekly and daily candles created this week is maintained without additional deviation.
Please note that the 1st section at the bottom is a sideways market / the 2nd section is open up to the bottom.
Please use my analysis article so far only for reference and use,
and I hope you operate safely with the principle trading and stop loss price.
Thank you.
BTCMINI trade ideas
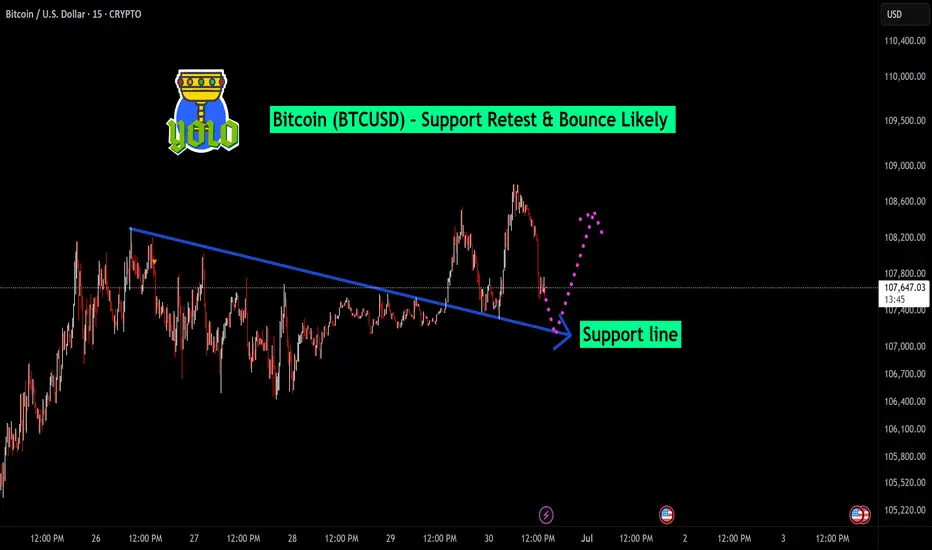
Bitcoin (BTCUSD) – Support Retest & Bounce Likely BTC has pulled back after a strong upward move and is now approaching a key support zone near $107,150 – $107,000. This level has previously acted as a breakout zone and now may serve as a strong demand area.
🔄 Scenario Building:
Price is coming down to retest the former resistance (now turned support).
If the support at $107,150 – $107,000 holds, a bounce back toward $107,800 – $108,000 can be expected.
Structure suggests bullish continuation if buyers step in around this zone.
BTCUSD SELL Recommendation – 15-Minute Chart (M15)Sell on short-term downtrend continuation after a technical pullback near resistance and Fibonacci levels.
🎯 Trade Setup:
Sell Zone: 107,000 – 107,200
Stop Loss (SL): 107,650 – 107,850 (above resistance + Fib 23.6% zone)
Take Profit (TP): 105,500 – 105,700
Risk:Reward Ratio: Approx. 1:2 to 1:2.5 – suitable for short-term scalping/swing
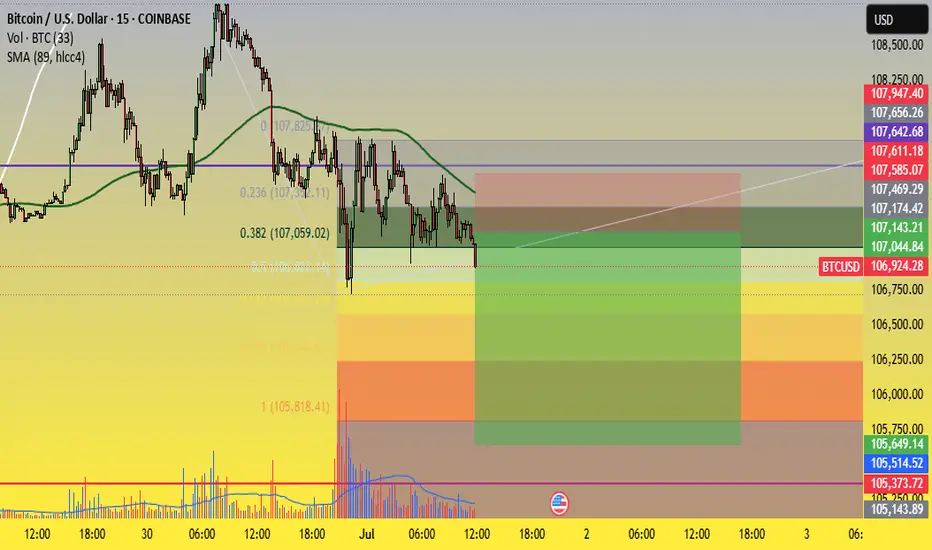
📊 Technical Analysis:
1. Fibonacci & Resistance Confluence:
Price is reacting to the Fibonacci 0.382 level (107,059) – a common retracement level in downtrends.
The zone 107,000 – 107,200 overlaps with historical resistance and previously rejected candles → indicating distribution.
2. Moving Average (MA) Pressure:
Price is trading below the MA, and recent pullbacks failed to break above it.
The most recent bounce was rejected around 107,200, suggesting bearish pressure remains.
3. Volume Analysis:
Volume declined on the pullback, showing weak buying momentum.
Meanwhile, the recent drop came with a high-volume bearish candle → sellers are in control.
4. Target Zone – Support Area:
105,500 – 105,700 is a previous swing low and aligns with the Fibonacci 0.618 – 0.786 zone, making it a strong potential bounce area.
This is a reasonable target before the market decides its next direction.
⚠️ Risk Management Notes:
Look for bearish reversal candlestick patterns (e.g., pin bar, bearish engulfing) in the entry zone for confirmation.
If BTC closes strongly above 107,650, consider the short setup invalidated.
Fl me and trading with me! fl Ytb....
Shorting BTCUSD After Trendline Failure & Bearish RetestPlanning to short BTCUSD as price has rejected from the descending trendline resistance after breaking the minor ascending trendline support. The confluence of trendline rejection and bearish retest suggests potential downside continuation.
Entry Zone: ~107,300–107,350
Stop-Loss: Above 107,550 (recent high)
Target: 106,550 support area
Risk-to-Reward Ratio: ~1:2 (Min) 1:4 (Final Target)
Quote:
"Trendline confluence and failed bullish continuation often lead to deeper pullbacks."
📊 Summary of the Idea
✅Reason for Entry: Multiple rejections at trendline + structure breakdown.
✅Confirmation: Retest rejection candle.
✅Invalidation: A clean breakout and hold above the descending trendline.

Bitcoin buy near 106000 upside fresh ATH possible SL 103500 How My Harmonic pattern projection Indicator work is explained below :
Recent High or Low :
D-0% is our recent low or high
Profit booking zone: D13% -D15% is
range if break them profit booking start on uptrend or downtrend but only profit booking, trend not changed
SL reversal zone : SL 23% and SL 25% is reversal zone if break then trend reverse and we can take reverse trade
Target : T1, T2, T3, T4 and .
Are our Target zone

Bitcoin Bybit chart analysis June 25Hello
This is Bitcoin Guide.
If you "follow"
You can receive real-time movement paths and comment notifications on major sections.
If my analysis was helpful,
Please click the booster button at the bottom.
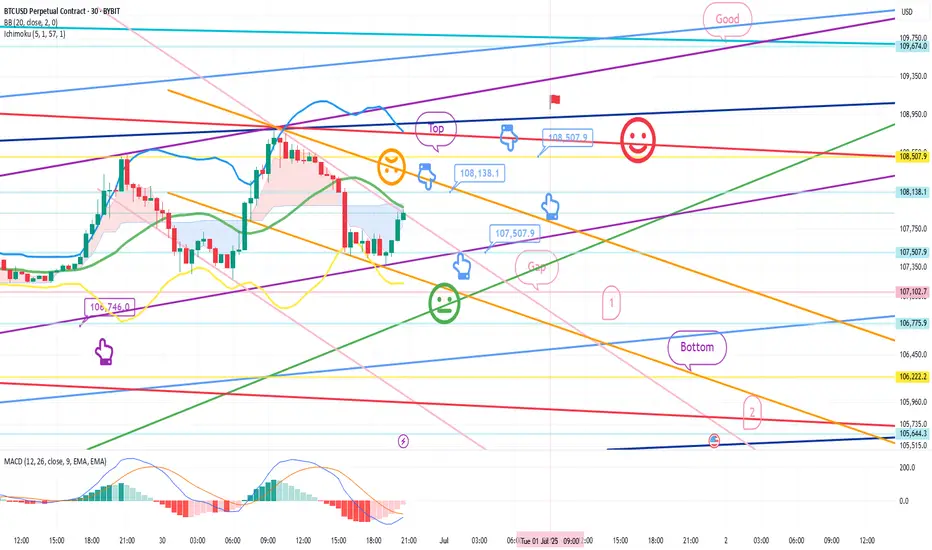
This is the Bitcoin 30-minute chart.
Nasdaq indicators will be announced at 11 o'clock shortly.
Nasdaq is rising vertically + renewing its all-time high.
Accordingly, I ignored the weekly MACD dead cross and
proposed the strategy for the pattern by substituting Tether dominance.
Although it is not visible on the screen,
I created today's strategy with the condition of maintaining the long position of $100,587.9 that was confirmed on the 23rd.
* One-way long position strategy when the red finger moves
1. $106,746 long position entry section / When the purple support line is broken
or when section 2 is touched, stop loss price
2. $108,66 long position 1st target -> Good 2nd -> Great 3rd target price
When section 1 at the top touches, it can be connected to an upward trend,
and section 2 is a sideways market.
At the very bottom and the very top,
I have indicated the maximum possible trend until tomorrow afternoon.
Up to this point, I ask that you simply use my analysis for reference and use only
I hope that you will operate safely with the principle of trading and stop loss.
Thank you.
Exhausted all buerys As in daily time frame market show of big bull run of 1000 points burnt but after reaching 980 points it is showing some rejection at top levels as buyers are not interested and not consecutive why is happening at this levels so it is a coming downwards so I have to cut trade at 1 hour setup seeing that market is exhausting all buyers as buyers make it trapped in such a move so got a risk reward of 1:10

Bitcoin | ShortBTC seems to have completed Wave B and now entering Wave C for a downside.
SL -> 108,550
Target1-> 107,400
Current Price -> 108,100

Btc 984 pts movement As BTC is holding at a top levels for 4 to 5 days we may predict a big upside shoot up so as per analysis it is shootout in upper side with 9 84 points positive run

Will History be Repeated in Bitcoin Like 2021/22 Highs vs 2025I think Bitcoin could Repeat History like 2021/22 . Because now same Double Top Pattern is showing on chart in 2025. so if history repeats very high chance Bears are ready to attack. So i am SELL BIAS on this Life time high of Market. My View is Sell on Current price with Small Quantity of Bitcoin 107738 and Stop Loss above its High 112000 Target is 1/10 very high Risk Reward Ration 85000 price .
Btc holding at upside may shoot up towards all time highIn daily time frame Bitcoin is holding at top levels just showing consolidation from 2 to 3 days in daily candle so we can say that if it cross upper side then market will go up to all time high because it sailors are not interested to push price down as it is holding it levels from 4 to 5 days
BTC USD Weekly Free Analysis (28-06-25 to 05-07-25)BTC USD
Bitcoin is currently trading around $107,233, showing signs of exhaustion near recent highs. The 4H chart suggests a bearish wave is forming, potentially leading to a drop toward the $102,000–$100,800 support zone. A temporary bounce might occur, but overall sentiment leans bearish unless the price breaks above $108,000 with strong volume. Traders should monitor macro risk sentiment, ETF flows, and U.S. economic data next week.

BTCUSD Bullish Reversal Setup on Key Support ZoneBitcoin is showing signs of a potential bullish reversal from a critical horizontal support zone around the 106,500 level. The price action has tested this zone multiple times, and each retest has been followed by a bounce, indicating strong buyer interest.
The latest 15-minute candle shows a bullish reaction just after a liquidity sweep below support, suggesting a possible fake breakdown or bear trap. The long lower wicks further strengthen the case for a rebound.
As marked, the risk-reward setup favors the bulls, with a potential upside target towards 107,700–108,000, while maintaining a tight stop below the recent low.

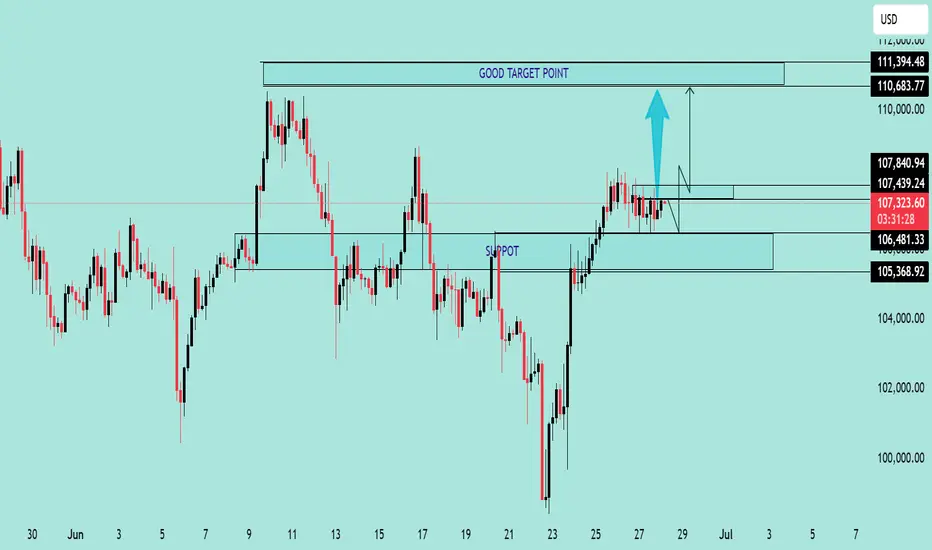
BTC/USD Consolidation Breakout SetupChart Overview:
The BTC/USD chart shows a strong bullish impulse followed by a consolidation phase just below a key resistance level, suggesting a potential bullish continuation.
🔹 Key Technical Zones:
📍 Support Zone:
105,368 – 106,481 USD
This area acted as a strong demand zone where price reversed aggressively.
📍 Resistance Level:
107,439 – 107,840 USD
Price is currently consolidating just below this resistance, indicating a buildup for a breakout.
🎯 Target Zone:
110,683 – 111,394 USD
A clean breakout above resistance could push price into this target area.
🔹 Technical Signals:
✅ Bullish Flag Formation:
After a strong impulse move, BTC is forming a sideways range, indicating bullish accumulation.
⬆️ Breakout Potential:
A confirmed breakout and retest above 107,840 could validate a move toward the 111K region.
⚠️ Invalidation Point:
A drop below 106,481 would invalidate the bullish bias and may trigger a deeper pullback.
📌 Conclusion:
As long as BTC holds above the 106,481 support and breaks above the 107,840 resistance, bullish momentum is expected to continue toward the 111K zone. Traders should watch for a breakout confirmation and manage risk accordingly. 💹
BTC/USD Bullish Liquidity Grab Before Final Rejection?In the 15-minute timeframe for BTC/USD, we can see multiple attempts where sellers have entered the market at swing highs, as marked with red circles. These repeated highs are likely forming a liquidity pool — an area where stop losses of early sellers may be resting.
My analysis suggests that the market is setting up a bull trap for these sellers, as liquidity above these levels will likely be taken out. Once this happens, I expect a strong bullish move toward the key resistance zone around 110,000, where prior supply is visible.
This move will serve two purposes:
1. Trap sellers who shorted early.
2. Trigger stop losses, allowing big players to fill long orders.
Once the market reaches this level, I will closely monitor price action. If bearish signals appear (like a rejection wick, bearish engulfing candle, or volume divergence), I will consider entering a short trade from this zone.

Institutional Option Trading Part -10Investment Strategies
Active Management: Constantly buying and selling assets to outperform benchmarks.
Passive Management: Tracking indices like the S&P 500 to match market performance.
Value Investing: Identifying undervalued stocks.
Growth Investing: Focusing on companies with high growth potential.
Quantitative Investing: Using mathematical models to guide investment decisions.
Risk Management
Diversification: Spreading investments across various sectors and assets.
Hedging: Using derivatives to offset risks.
Liquidity Management: Ensuring enough cash to meet obligations.
Regulatory Compliance: Adhering to financial regulations.

Bitcoin buy given at 100500, 110000 to 111500 Target How My Harmonic pattern projection Indicator work is explained below :
Recent High or Low :
D-0% is our recent low or high
Profit booking zone: D13% -D15% is
range if break them profit booking start on uptrend or downtrend but only profit booking, trend not changed
SL reversal zone : SL 23% and SL 25% is reversal zone if break then trend reverse and we can take reverse trade
Target : T1, T2, T3, T4 and .
Are our Target zone

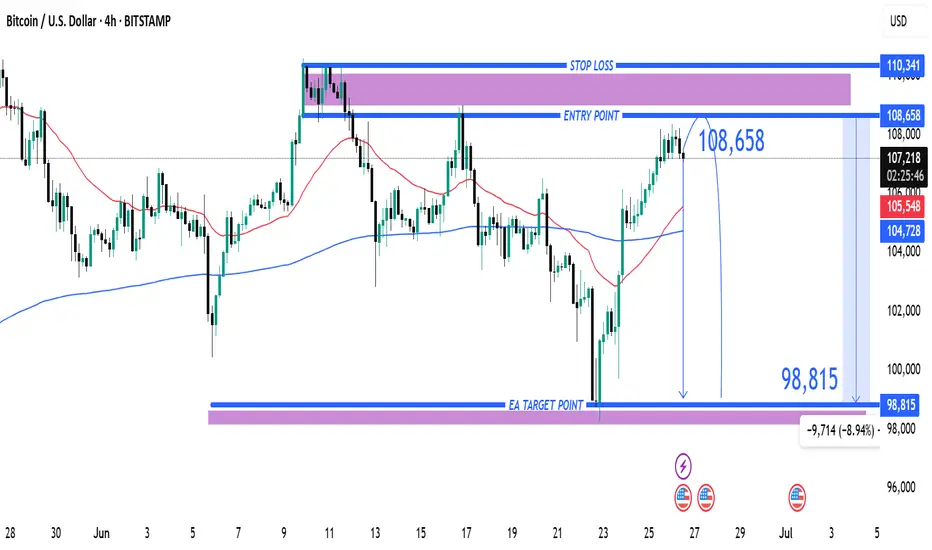
Entry at $108,658 with Target at $98,815 and Stop Loss at $110,31. Entry Point: 108,658
This is where the trader expects to enter a short position.
Price is projected to reverse near this level.
2. Stop Loss: 110,341
Located above the entry point.
If price hits this level, the short trade is invalidated, limiting losses.
3. Target (Take Profit): 98,815
This is the EA Target Point, about 9,714 points (~8.94%) below the entry.
Represents a favorable risk-reward ratio.
---
🔄 Trade Idea Summary
Trade Type: Short (Sell)
Risk: ~1,683 points (110,341 - 108,658)
Reward: ~9,843 points (108,658 - 98,815)
Risk-Reward Ratio: ~1:5.85 (which is strong)
---
📊 Technical Indicators in Use
Moving Averages:
Likely 50-period (red) and 200-period (blue) MAs.
The 50 MA is below the price, indicating short-term bullishness.
However, the trade idea goes against this short-term trend, suggesting a reversal strategy.
---
🔍 Interpretation & Strategy
This chart implies the trader expects resistance near 108,658, possibly due to historical highs or supply zones.
The bearish outlook expects a significant drop to 98,815, possibly supported by macro patterns (like head & shoulders, or bearish divergence—not shown here but could be inferred).
The purple zones highlight high-probability reversal or reaction areas (support/resistance zones).
---
⚠️ Things to Watch
Invalidation: If price closes above 110,341 on a 4H/1D chart, the trade setup fails.
Confirmation: A strong bearish candlestick at or near the entry zone would strengthen the case.
Market Context: News, economic data, or BTC ETF inflows/outflows can quickly invalidate technical setups.
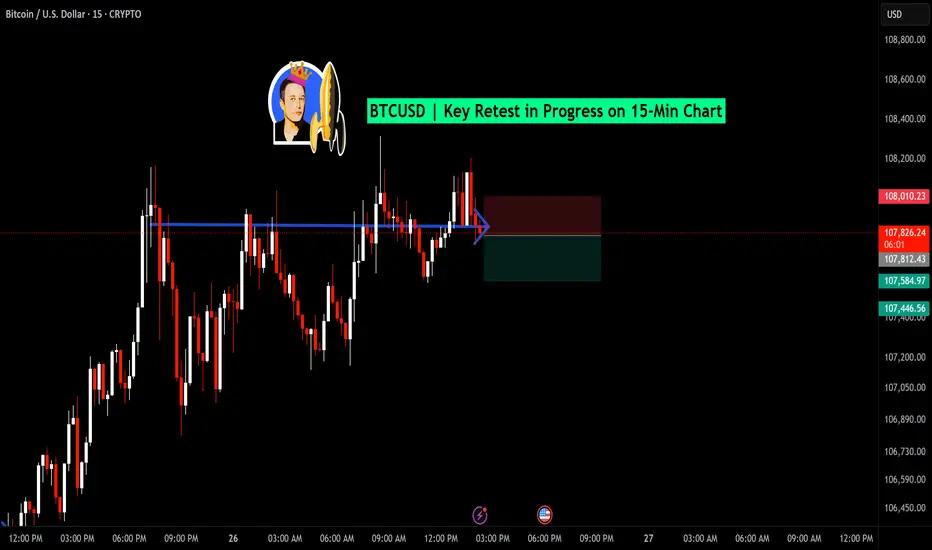
BTCUSD | Key Retest in Progress on 15-Min ChartBitcoin is currently retesting the horizontal breakout level near $107,812, after a quick bullish move. Price has pulled back precisely to the marked zone (blue line + arrow), which previously acted as resistance and now being tested as support.
🔹 Support Zone: $107,810 – $107,830
🔻 Stop-loss: Below $107,446
📈 Potential Upside: First target near $108,010+
If the level holds and bullish momentum returns, this could act as a strong base for the next upward leg. But a breakdown below the zone could invalidate the setup — trade with confirmation.
Bitcoin In-Depth Technical Outlook – Bull or Bear!Bitcoin is currently coiling up in a tight structure, preparing for a major breakout or breakdown move. Price is consolidating just below a key resistance band that has historically acted as both a rejection zone and breakout trigger. This entire region marked as the crucial zone is where the market will decide whether BTC moves toward new all-time highs or rolls over into a deeper correction.
🧠 Market Structure Overview
Accumulation & Expansion: After forming a broad base post-March lows, Bitcoin rallied back up and is now sitting just below its previous highs from Q1 2025. The price is now compressing in a narrow range, indicating energy build-up.
Crucial Mid-Zone: The zone where price is currently hovering (around 106k–107k) is the battleground. It's been tested multiple times from both sides — failed breakouts above and strong defenses from bears below. If this zone is convincingly broken to the upside with momentum, it would trigger bullish continuation. If it gets rejected again, sellers will likely regain control.
Key Resistance Above: If the breakout succeeds, BTC has a clean runway toward massive upside targets, eventually pushing toward the 147k–148k zone, which marks a major macro extension level. This region aligns with the final leg of the current cycle, supported by bullish sentiment and ETF inflows.
Key Support Below: On the flip side, failure to break out will expose BTC to downside risk. Immediate support lies slightly below the current range, but if that fails, the chart projects a deeper flush toward 83k, a strong high-timeframe demand zone. This level would offer a high-probability buy zone for longer-term investors.
🔮 Probable Scenarios
Bullish Path (Red Arrow Up)
Breaks the key zone with strength and volume
Retest holds as support
Continuation rally toward all-time highs and beyond
Bearish Path (Red Arrow Down)
Price fails to sustain above resistance
Breakdown below mid-level support
Panic-selling or profit-booking pushes price to lower HTF demand zones
📊 Sentiment & Timing Factors
Volatility is contracting, typically a precursor to explosive moves.
On-chain activity shows mixed signals whales are quiet, but retail is slightly bullish.
Macro backdrop remains neutral but vulnerable to sudden shifts from rate cut expectations or global risk events.
📌 Key Takeaway
Bitcoin is at a make-or-break point. It's coiling under major resistance, and whichever way it moves next could define the tone for the coming months. Patience is key traders should wait for a confirmed breakout or breakdown before positioning big. Until then, it’s a range-trader’s market, but once the range breaks, expect a powerful trending move.

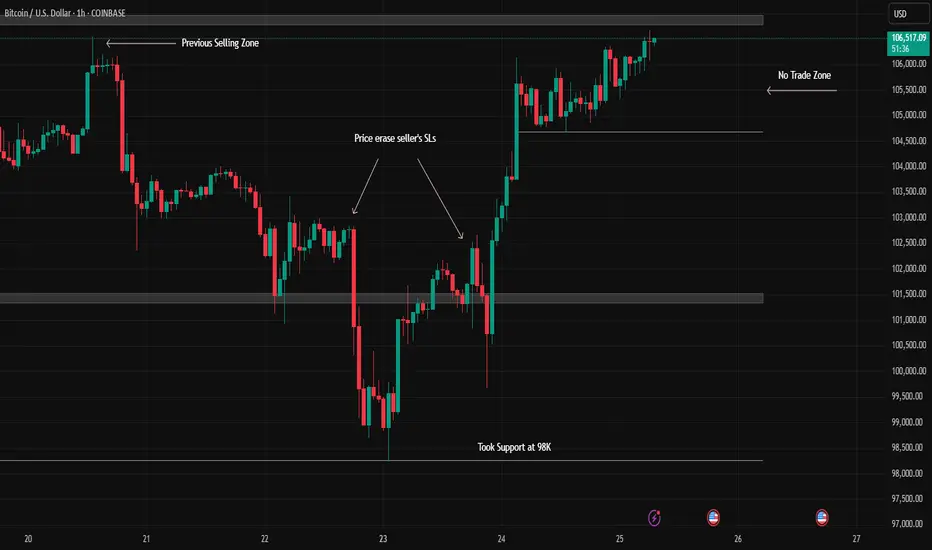
Bitcoin - Interesting Price Action in 1 HTFTRADERS AND INVESTORS,
The Bitcoin chart presents an interesting setup on the 1-hour timeframe (1 HTF). Here's a breakdown of recent price action:
Initial Resistance & Downtrend : Bitcoin's chart indicated potential trend changes, with significant selling pressure at the $106,000 mark establishing a clear resistance level.
Downtrend Confirmation & Support : This was followed by a series of lower highs, confirming a downtrend. Subsequently, Bitcoin found support and bounced from the $98,000 level.
Potential Reversal Signal : The recent upward movement cleared sellers' stop-losses, which could be an early indication of a potential trend reversal.
WHAT MIGHT HAPPEN NEXT?
Currently, Bitcoin is re-testing the crucial $106,000 resistance level.
Bullish Scenario : A confirmed breakout and sustained move above $106,000 could signal the continuation of an uptrend.
Bearish Scenario : Conversely, a strong rejection from this level might lead to a decline, potentially targeting the $101,000 support.
Current Stance : At present, this area appears to be a no-trade zone due to the indecisive price action.
Disclaimer : This analysis is for educational purposes only and should not be considered financial advice. Always conduct your own research before making investment decisions.
BTCUSD Bullish Breakout Toward 110K – Buy on Dip StrategyBitcoin is currently trading around 105,043 and has shown strong bullish momentum on the 15-minute chart. After breaking past the 103,454 support level, it formed a higher high, signaling continued buying interest.
My idea is based on a breakout-pullback-continuation pattern. I expect a slight pullback toward the 103,454 zone, which now acts as support. From there, I anticipate a bounce and a push toward the next key resistance at 110,093.
Entry: Near 103,800–104,200
Target: 110,000
Stop Loss: Below 103,000
Risk/Reward: ~1:2+
This idea is valid as long as price holds above 103,000. A break below that would invalidate the setup.

Bitcoin Bybit chart analysis June 23Hello
This is Bitcoin Guide.
If you "follow"
You can receive real-time movement paths and comment notifications on major sections.
If my analysis was helpful,
Please click the booster button at the bottom.
This is the Bitcoin 30-minute chart.
The Nasdaq seems to be rising without any problems,
but Bitcoin is under pressure from the MACD dead cross on the weekly chart as it has been adjusted strongly over the weekend.
Depending on the real-time situation, it seems advantageous to operate safely
short-term trading or both-way trading this week.
I created today's strategy based on the Nasdaq movement and the Tether dominance pattern.
*One-way long position strategy when the red finger moves
1. $100,587.9 long position entry section / hand drop when the purple support line is broken
2. $103,953.8 long position target price / Good 2nd target price thereafter
From the purple support line breakout, the weekly chart
candle low point created this week is broken, so it is better to maintain it without breaking out from the long position position.
If it breaks out, it can be pushed to the bottom -> 2nd section.
The 1st section marked in the middle
If it doesn't come down to the long entry point today
It is a vertical rise section
And the pink finger in the middle indicates the short-term target price -> additional long entry section
And the Gap8 section was created at the top due to last week's movement
I think it would be good to refer to it while trading.
Up to this point, I ask that you simply use my analysis for reference and use
I hope that you operate safely with principle trading and stop loss prices.
Thank you.