Trendline Liqudity trap + Reversal at key Supply/DemandDraw obvious trendlines that retail traders are watching.
Look for 3+ touches — price builds “trust” on the trendline.
Price breaks the trendline, grabs SLs (liquidity), and hits major S&D zone.
Enter on reversal candlestick / OB rejection.
BTCMINI trade ideas

Bitcoin again ready for upmove 91000, buy near 82900How to take trades using Harmonic pattern projection Trade setup is explained below :-
Entry : 1st SL point : 0% is recent top or bottom.
Trailing D: 11.4% is work as trailing SL of buy or sell trade if hit then we have to book profit
.If price goes below 2nd D 21.4% to 23.6% range then early traders can make fresh reversals trade after breaking 1st D 11.4% safe traders can reversal trade after breaking Point D 21.4% to 23.6% range
Targets :
Target T1 : 35.1% to 38.3%
Target T3 : 49.1% to 53.2%
T3: 60.9% to 64.8% is our 3rd Target since this is reversal zone so must book profit if break then take fresh trade again
Target T4 : 76.4% to 79.7%
Next Targets are 100% , 127.2% ,141.4% and final Target 161.8%.
How to take reversal trade :
If price going upside/ downside then then buy or sell levels appear on Chart ( Automatically show when price reach any reversal zone of harmonic projection pattern based .
After showing reversal levels wait for confirmation until 21.4% or 28.3 % level not break if break then exit from current buy / sell trade and take fresh reverse trade buy/ sell .
Trailing SL:
After reach 1st Target trail SL to just above or below cost ( for example we are holding sell trade from 100 1st Target 110 hit then move trailing sl to 104-105 and move SL as price move upside or Downside)
Re- Entry :
For Re-entry in any pull back Point D ( 11.4% ) is used for re-entry then SL recent high or low Point SL ( 0% ) .
Blue Line is 1st support/ Resistance
Green line is 2nd support/ resistance
Red line is 3rd Support/ resistance

BTCUSD at a Crossroads — Watching WSMA + RSI Combo for Next MovePerfect chart!
Clean, sharp, and clearly shows the WSMA + RSI combo in action.
Now here’s your TradingView idea content (non-tutorial style, copy-paste ready):
⸻
BTC/USD at a Crossroads — Watching WSMA + RSI Combo for Next Move!
Bitcoin is currently consolidating around the $84K zone, showing indecision — and the Wavelet Smoothed Moving Average (WSMA) might offer clues.
The WSMA (TechnoBlooms) line is now flattening after a strong bullish slope, showing a pause in trend.
Meanwhile, RSI is hovering near 50 — indicating neutral momentum, with neither bulls nor bears fully in control.
⸻
Why this matters:
• Trend Filter (WSMA):
WSMA (a3) offers a multi-timeframe smoothed trend.
When it flattens after a bullish run, it often signals an upcoming breakout or deeper correction.
• RSI Decision Zone:
RSI is stuck between 48–52.
A break above 55 with a bullish candle would confirm short-term momentum.
A dip below 45 could signal further downside.
⸻
What I’m Watching:
• ✅ Bullish Bias if: RSI breaks 55 and price holds above WSMA = potential breakout toward $86K
• ❌ Bearish Bias if: RSI breaks below 45 and price falls under WSMA = possible drop to GETTEX:82K –$80K range
⸻
This WSMA + RSI combo filters out fake signals, and gives a clean roadmap for upcoming BTC structure.
Let’s see how this compression resolves.
⸻
Not financial advice. Just sharing a personal view based on my indicator setup.
⸻
#BTCUSD #Bitcoin #TechnoBlooms #WSMA #RSI #TradingSetup #CryptoAnalysis #PriceAction #QuantumPriceTheory

Bitcoin Bearish Reversal Setup: Rising Wedge Breakdown Targeting1. Entry Point:
Marked around $86,853, this is where a potential short (sell) trade might have been initiated.
2. Stop Loss:
Placed above $88,783, protecting the trade in case the market goes against the position.
3. Target Point (Take Profit):
Aiming down toward $74,443.76, suggesting a large bearish move is anticipated.
4. EMA Indicators:
30 EMA (Red Line) at ~$84,271: Indicates short-term trend.
200 EMA (Blue Line) at ~$83,496: Indicates long-term trend.
Price is currently trading above the 200 EMA but slightly below the 30 EMA, showing mixed short-term momentum.

BTCUSD ANALYSIS!This just the updation of our trade analysis how it went after giving closing above 84000 lvl it has given 1tp of 85000 and than hit our trailing SL almost got 1:1.5 RR. Happy trading 😄
I will post new analysis soon if there is opportunity available.
My analysis is for education purpose only. Don't initiate trade without your research.
Do like my trade ideas and comment as well so that I can post more ideas similar to this👍🤗

BTCUSD LONG?This post is Just for the update how our analysis gone after I posted the analysis post. Here we have achieved our first tp of 85000 now Book part quantity here and trail the rest qty with buying price SL so our trade becomes risk free

BTCUSD GO LONG OR SHORT!Hello traders once again I'm going to post advance trade analysis for BTCUSD. Here as we can see btc has made kind of double bottom pattern, hence our entry will initiate above 84000 lvl and SL will be 83067.5 previous low or else put low of support zone of 82750 with tp 1)85000 & 2)86000 if you get 1st tp than trail your sl near entry so our trade becomes risk free. Our trade will be active only if 15 min candle close above 84000 lvl.
This is my personal view, my view can go wrong do your own research before taking any trades and consult with your financial advisor first. Happy trading 🤗
And guys if you are benefiting from my analysis do comments and like as well also share with your friends 😉

BTC/USD Short Setup – Triple Top Reversal with EMA Confirmation Entry Point (Sell): Around $85,699.52
Stop Loss: $86,741.44 (above resistance zone)
Target (Take Profit): $82,982.09
This provides a Risk-Reward Ratio of approximately 1:2, a commonly acceptable ratio in trading.
📈 Indicators:
EMA 30 (Red) is currently above the EMA 200 (Blue), indicating bullish momentum—but this setup anticipates a trend reversal.
If price breaks below the EMAs, that would confirm bearish strength.
🧠 Conclusion:
This setup is based on:
A strong resistance zone,
Bearish reversal pattern (triple top),
Risk management via stop loss and take profit levels.
If you're trading this:
Wait for confirmation with a bearish candlestick below the EMAs or a break of recent support.
Manage position size based on stop distance and your account risk tolerance.

Bitcoin buying strategyBitcoin at divergence.
Bullish invalidation below 74808
Bullish targets: 82830, 88044, 91755
Below 74808-74800 zone, bearish continuation till 71845, 68075, and 64525 as downside targets respectively.

Sell BITCOIN NOWWWWWBitcoin price keeps touching the support zone and weakening, showing no growth momentum. Breakdown areas are likely to be on the downside. Sell and wait to take profits
Take profit and stoploss in this pictures
Good luck ALLL !!

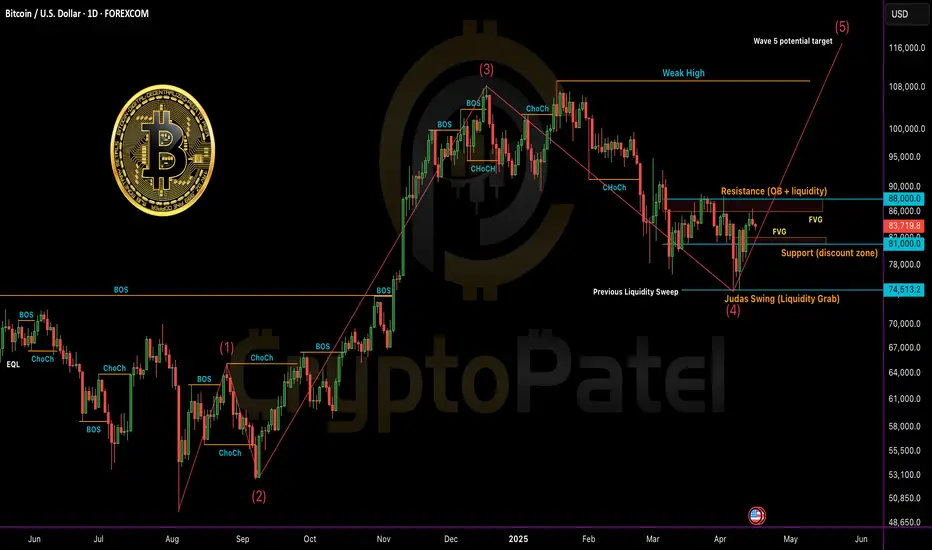
Bitcoin (BTC/USDT) – Full Technical Breakdown - Timeframe: 1DBitcoin (BTC/USDT) – Full Technical Breakdown - Timeframe: 1D
Market Structure & SMC (Smart Money Concepts)
✅ CHoCH (Change of Character) confirmed from $105K top → current lower high around FWB:88K zone.
📉 Break of Structure (BOS) to the downside occurred at $91K.
🟠 Bearish Order Block (OB): $86K– FWB:88K (price currently reacting here).
Liquidity Levels:
Sell-side: Swept at $76K
Buy-side: Sitting above FWB:88K
Fair Value Gap (FVG): Unfilled zone between $81K– GETTEX:82K may act as magnet for price.
ICT Model Alignment
Judas Swing: Sharp liquidity grab below $76K → followed by rebound — classic manipulation before real move.
PD Array Setup:
Resistance: FWB:88K (bearish OB + buy-side liquidity)
Support: $81K (discount zone + FVG)
Elliott Wave Outlook
Wave 1: July–Sept 2024
Wave 3: Nov–Feb rally to $105K (extended wave)
Wave 4: Correction to $76K likely complete
Wave 5 Target: Potential $115K+ if structure holds
Fractal Observation
🔹 Current price structure is mimicking Nov 2023–Jan 2024 pattern
🔹 If history rhymes: consolidation → breakout → retest → parabolic rally
Key Levels to Watch
🔼 Bullish Confirmation: Daily close above FWB:88K → targeting GETTEX:92K –$100K
🔽 Bearish Rejection: Drop below $81K → next support at $74K–$76K
Strategy Summary
🔹 Short-Term Bias: Cautiously Bullish
🔹 Entry Zone: Retest near GETTEX:82K (FVG + OB)
🔹 SL: Below $79.5K
🔹 TP Zones: FWB:88K → GETTEX:92K → GETTEX:98K
📈 R:R = Minimum 1:5 (High confluence)
Keep your eyes on HTF closures and manage risk. Liquidity traps are in play.
A good time to go long in BitcoinBitcoin has given a breakout of its long continuing bearish trend , said breakout has also being retested , from current levels Bitcoin can reach levels of $88000-90000.

Will Bitcoin Test $65000 level soon ?🚨 #BTC/USDT SMC Update and Fresh Analysis 🚨
Our previous short setup played out perfectly with a solid -21% move from the $94,000 region, catching the local top and dumping all the way to $75,000.
What’s next?
From a Smart Money Concepts (SMC) perspective, current PA suggests another local top might be in.
🔹 Bearish Order Block just got tapped
🔹 Strong Resistance seen near the $86,000 level
🔹 Price forming LL (Lower Low) and LH (Lower High) structure
If this setup plays again, we may see a new low below $75,000.
Key Level to Watch:
If a HTF candle closes above $88,200, the short thesis is invalidated — and in that case, we may be looking at a bullish continuation toward the $100,000 zone.
Reminder:
Don’t enter blindly. Wait for confirmations and respect risk management—protect your capital at all costs.

Bitcoin short term fall possible avoid any fresh buy 82300 comeHow to take trades using Harmonic pattern projection Trade setup is explained below :-
Entry : 1st SL point : 0% is recent top or bottom.
Trailing D: 11.4% is work as trailing SL of buy or sell trade if hit then we have to book profit
.If price goes below 2nd D 21.4% to 23.6% range then early traders can make fresh reversals trade after breaking 1st D 11.4% safe traders can reversal trade after breaking Point D 21.4% to 23.6% range
Targets :
Target T1 : 35.1% to 38.3%
Target T3 : 49.1% to 53.2%
T3: 60.9% to 64.8% is our 3rd Target since this is reversal zone so must book profit if break then take fresh trade again
Target T4 : 76.4% to 79.7%
Next Targets are 100% , 127.2% ,141.4% and final Target 161.8%.
How to take reversal trade :
If price going upside/ downside then then buy or sell levels appear on Chart ( Automatically show when price reach any reversal zone of harmonic projection pattern based .
After showing reversal levels wait for confirmation until 21.4% or 28.3 % level not break if break then exit from current buy / sell trade and take fresh reverse trade buy/ sell .
Trailing SL:
After reach 1st Target trail SL to just above or below cost ( for example we are holding sell trade from 100 1st Target 110 hit then move trailing sl to 104-105 and move SL as price move upside or Downside)
Re- Entry :
For Re-entry in any pull back Point D ( 11.4% ) is used for re-entry then SL recent high or low Point SL ( 0% ) .
Blue Line is 1st support/ Resistance
Green line is 2nd support/ resistance
Red line is 3rd Support/ resistance

Bitcoin Bybit chart analysis April 14 Hello
It's a Bitcoinguide.
If you have a "follower"
You can receive comment notifications on real-time travel routes and major sections.
If my analysis is helpful,
Please would like one booster button at the bottom.
Here is the Bitcoin 30-minute chart.
There is no Nasdaq indicator announcement today.
I created a strategy based on the possibility of a strong decline in Tether dominance centered on the Gap section at the bottom of Nasdaq and Bitcoin.
*One-way long position strategy when the red finger moves
1. 83,690.8 dollars long position entry section / cut-off price when the green support line is broken
2. 85,772.3 dollars long position 1st target -> Top 2nd -> Good 3rd target.
If the strategy is successful, I have indicated the long position re-entry section.
Today, it is best to maintain the purple support line
because it maintains the mid-term pattern and the daily candle bottom section.
The mid-term pattern can be broken from the 1st section,
and it can be a sideways market until the 2nd section,
and it can decline step by step from the bottom -> 3rd section.
Up to this point, I ask that you simply use my analysis for reference and use only.
I hope that you operate safely with the principle of trading and cut-off price.
Thank you.

Bitcoin longlong term trend is up. short term price and time correction seems to be done. buying on the pull back into new life time highs. lets go. this level is going to be a key pivot going forward.

BTCUSD READY TO FLY 3500 POINTS..CHECK IT WORLD CLASS ACCURACY??BTCUSD strong zone above only 85550
there is no resistance upto 89000..3500++ point
wait for active mode
Buy above 85550
Stoploss.............84600......950 points
Target1.............87000........1500 points
Target2.............89000++......3500 points
Disclaimer - This level only for education purpose . Do ur own analysis
Magic Indicator - private only script ( any one want 1 week demo for dm me in tradingview. Sent ur username )

Bitcoin Daily Outlook — April 14, 2025Bitcoin is holding firm after breaking the falling trendline and is now playing inside a tight consolidation range. Today’s close is going to be crucial. If it closes above this range cleanly, a strong upside push is expected, aiming towards the next big target near 110k. Right now, it’s clearly in a build-up phase — this is where smart money accumulates before the breakout. The momentum looks positive, and with risk-on sentiment returning across markets plus ETF inflows supporting crypto, bulls have the edge. Also, with halving hype picking up and broader weakness in the dollar, Bitcoin is well-positioned for a drive higher. If price fails to close above this range today, the move might delay, but the bias remains bullish as long as price holds steady and doesn’t slip back into the lower zones.

Complete Beginner’s Guide to Fibonacci, AutoFibGaugeTitle:
Complete Beginner’s Guide to Fibonacci, AutoFibGauge, and How to Plan Perfect Trades! 🎯
⸻
Many traders hear about Fibonacci but don’t really know what it is or how to use it properly.
Here’s a full beginner-friendly guide covering everything — from the math basics to real trading strategies!
What is Fibonacci?
The Fibonacci Sequence is a set of numbers where each number is the sum of the two numbers before it.
It looks like this:
0, 1, 1, 2, 3, 5, 8, 13, 21, 34, 55, 89, 144…
This simple rule creates a pattern that we see everywhere in nature:
• In the way flowers bloom
• In the spiral of seashells
• In the structure of hurricanes
• Even in galaxies
Nature follows Fibonacci.
Markets, which are built by human emotions (fear, greed, hope), also often follow Fibonacci behavior.
That’s why Fibonacci is important in trading.
⸻
The Special Golden Ratio — 61.8%
From the Fibonacci sequence, if you divide a number by the next one (e.g., 21 ÷ 34), you get approximately 0.618 — or 61.8%.
This is called the Golden Ratio.
The Golden Ratio shows up in art, architecture, music, human faces, and… yes, financial markets.
In trading, the 61.8% retracement is considered the strongest potential turning point.
If a price pulls back by around 61.8%, there’s a high chance it will bounce and continue the trend.
⸻
What is Fibonacci Retracement in Trading?
In trading, after a big move (up or down), the market rarely moves in a straight line.
It pulls back (corrects) before continuing.
Fibonacci Retracement levels help us predict where the pullback might end and the trend might continue.
Commonly Used Fibonacci Levels:
• 23.6% — Very shallow retracement
• 38.2% — Healthy pullback
• 50.0% — Halfway mark (not a Fibonacci number, but widely watched)
• 61.8% — Golden zone (high probability area)
• 78.6% — Deep retracement before a reversal
Traders look at these levels as support and resistance zones.
⸻
What is AutoFibGauge?
Normally, drawing Fibonacci manually takes time — you have to find correct swings and plot retracement.
AutoFibGauge does it automatically:
• Detects swing highs and swing lows
• Plots Fibonacci retracement levels instantly
• Keeps updating live as price moves
✅ Saves time
✅ Reduces human error
✅ Keeps your chart clean and professional
It’s built for traders who want speed, simplicity, and reliability.
⸻
My Default Settings for AutoFibGauge:
• Swing Length: 25
• Fib Levels Displayed: 23.6%, 38.2%, 50.0%, 61.8%, 78.6%, 100%
• Mode: Automatic (finds swings without needing to adjust)
• Visual: Bands instead of just thin lines (for easier viewing)
Adjustment Tip:
• 15 min chart: Swing Length 20–25
• 1 Hour chart: Swing Length 25–30
• 4 Hour chart: Swing Length 30–40
Higher timeframes = Slightly bigger swing lengths.
⸻
How to Plan Entry:
1. Wait for price to approach a major Fibonacci level (especially 38.2%, 50%, or 61.8%).
2. Watch how the candles behave:
• If you see a bullish engulfing candle, hammer, or strong bounce from the level → Good sign to buy.
• If price hesitates or gives bearish reversal → Could signal continuation of downtrend.
3. Combine with trend confirmation tools (QMA, Parabolic SAR, moving averages).
✅ Remember: Confirmation is key.
Don’t just blindly buy or sell because price touched a level.
⸻
How to Plan Exit:
• Set first target at the next major Fibonacci level.
Example:
• If you enter near 61.8%, target 38.2% or 23.6%.
• Another method: Trail your stop-loss behind swing highs/lows as price moves in your favor.
✅ This way you lock profits even if the market reverses later.
⸻
When Fibonacci Works Well:
✅ In trending markets (clear uptrend or downtrend)
✅ When combined with price action or indicators
✅ After strong impulsive moves followed by natural pullbacks
⸻
When Fibonacci Might Not Work Well:
❌ In sideways (rangebound) markets
❌ During extreme news events or unexpected volatility
❌ When used alone without confirmation
Always remember — Fibonacci levels are not magical.
They are guidelines, not exact rules.
You need to combine them with market structure and momentum for best results.
⸻
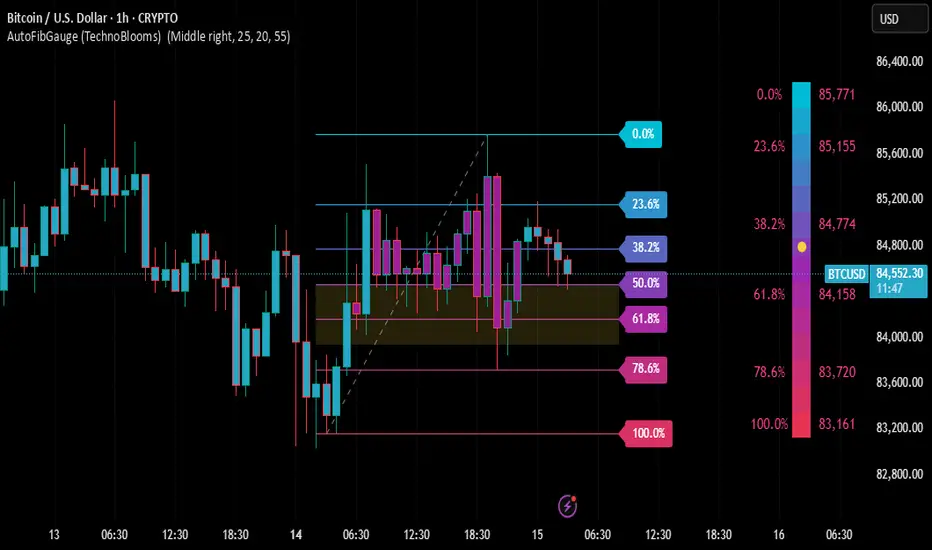
Real Example (BTC/USD 1H Chart):
• After a rally, price retraced into the 50%-61.8% zone.
• Bullish candles appeared showing price respecting the zone.
• This was an excellent opportunity to plan a long entry with Fibonacci guidance.
⸻
Final Words:
• Fibonacci is not only for “professional” traders — anyone can learn it.
• AutoFibGauge makes using Fibonacci simple and automatic, even if you’re just starting out.
• If you respect the levels, wait for confirmation, and follow a disciplined plan, Fibonacci becomes one of your best trading tools.
⸻
Found this helpful? Tap LIKE ❤ & FOLLOW ➕ for more beginner-to-advanced trading guides every week!
⸻
#Fibonacci #AutoFibGauge #FibonacciRetracement #TechnicalAnalysis #PriceAction #TradingTools #LearnTrading #CryptoTrading #ForexStrategy #SwingTrading #BeginnersGuide
Bitcoin in rangeIf range breakout ,then ANCD pattern will get activated ,next target comes at 90 k and breakdown then it is going to follow XABCD pattern ,once activated

BTCUSD ANALYSIS!As we get closing candle above mentioned lvl our trade is active It has taken SL for safe traders, I have given another lvl for risky traders which is still intact and after hitting sl for safe traders we get our target 🎯 zone. Unfortunately safe traders have to book lose it happens sometimes we can't do anything as BTCUSD is highly volatile so always try to give proper sl and take small lots. I will post new analysis soon if there is good set is available. Happy trading 🤗

Bitcoin buy on dip recommended 86700-87000 then 91700 targetHow to take trades using Harmonic pattern projection Trade setup is explained below :-
Entry : 1st SL point : 0% is recent top or bottom.
Trailing D: 11.4% is work as trailing SL of buy or sell trade if hit then we have to book profit
.If price goes below 2nd D 21.4% to 23.6% range then early traders can make fresh reversals trade after breaking 1st D 11.4% safe traders can reversal trade after breaking Point D 21.4% to 23.6% range
Targets :
Target T1 : 35.1% to 38.3%
Target T3 : 49.1% to 53.2%
T3: 60.9% to 64.8% is our 3rd Target since this is reversal zone so must book profit if break then take fresh trade again
Target T4 : 76.4% to 79.7%
Next Targets are 100% , 127.2% ,141.4% and final Target 161.8%.
How to take reversal trade :
If price going upside/ downside then then buy or sell levels appear on Chart ( Automatically show when price reach any reversal zone of harmonic projection pattern based .
After showing reversal levels wait for confirmation until 21.4% or 28.3 % level not break if break then exit from current buy / sell trade and take fresh reverse trade buy/ sell .
Trailing SL:
After reach 1st Target trail SL to just above or below cost ( for example we are holding sell trade from 100 1st Target 110 hit then move trailing sl to 104-105 and move SL as price move upside or Downside)
Re- Entry :
For Re-entry in any pull back Point D ( 11.4% ) is used for re-entry then SL recent high or low Point SL ( 0% ) .
Blue Line is 1st support/ Resistance
Green line is 2nd support/ resistance
Red line is 3rd Support/ resistance

BTCUSD LONG?Hello traders, once again I'm back to do some chart analysis I usually like to Post swing trades in higher TF rather than smaller TF still right now I just want to ride the trend which is ongoing so I'm posting this advance trade set-up. As you can see BTCUSD has come to previous support zone our entry will be initiate if price close above 84800 lvl in 5min or 15min TF (both are valid) with sl of 84250 and tp of 85600-86000 lvl. Entry will only be valid if it's closing above mentioned lvl other wise trade won't active. This set up give almost 1:2 RR which is good enough for intraday and after you get 1:1 RR don't forget to trail your sl near entry to make it totally risk free, risky traders can put SL near support zone low of 84067 area👍
This is just my personal view, I might go wrong do your own research before taking any trades. and consult your financial advisor before taking trades.
