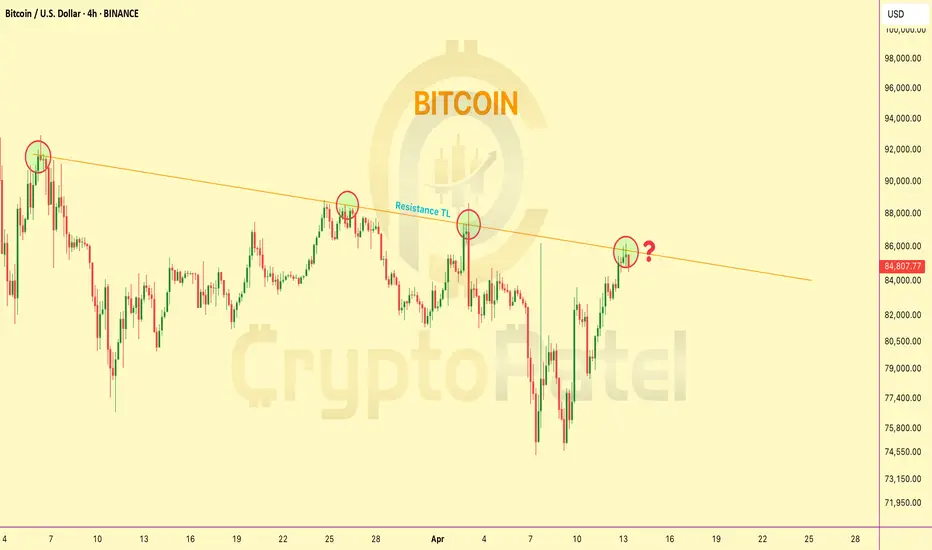
Bitcoin trading at Resistance level so What Next?🚨 Bitcoin 4H Chart Update
CRYPTOCAP:BTC is now trading right at the trendline resistance on the 4H chart
So what’s next?
1️⃣ Breakout and blast toward $100K?
2️⃣ Or another rejection down below $70K?
The decision point is HERE.
This breakout could change the game.
👇 Drop your thoughts –
BTCMINI trade ideas
BTC getting ready for the fall. Small pullback is completed.Hi , BTC has completed its small pull back from from 74500 to 86k. It is forming a red candle at the 50sma. If any further pull back will be till 87350 which is nothing but 200sma. But there all longs should be closed and wait or furhter price action. Even now a red candle if completed by today then we are heading down to 53k.

Gold’s New All-Time High Could Be #Bitcoin Signal🚨 Gold’s New All-Time High Could Be #Bitcoin Signal 🟡
And if history repeats, Bitcoin could be next.
Every time #Gold moves first, Bitcoin usually follows with a major rally. If that happens again, we could see a new Bitcoin ATH in Q2-Q4 of 2025.
Are you ready for the next big move? 🚀
CRYPTOCAP:BTC #BullMarket

BTC updateBTC update
This structure from 74500 low lookslike WXY till now
it has a 3 move abc, in it and 3move abc in Y.
WXY is at 123% extention, which is Ok for WXY.
Next leg downside which looks like X but it voilets trendline
rules, so no clear counts possible, it may be
A wave of X and BC to follow if it is a bearish structure.
On the otherhand it can be a leading diagonal but looks like less chances of it.

"BTC/USD Short Setup: Supply Zone Rejection & 5% Drop Target!"BTC/USD 15-Min Chart Analysis
Trade Setup by EA_GOLD_MAN_COPY_TRADE
---
🔼 SUPPLY ZONE (Resistance)
🟣 Price Area: $83,427.80 – $84,313.06
This is where sellers might step in
Price is expected to reverse or slow down here
🔽 ENTRY POINT
🔵 Sell Entry: $83,427.80
Entering short trade just below the supply zone
Aiming to catch a reversal move down
⛔ STOP LOSS
🔴 Stop: $84,313.06
Placed above the supply zone
Limits risk in case of breakout upward
❗ Protects the trade from loss beyond this point
🎯 TARGET / TAKE PROFIT
🟣 Target: $79,071.05
Major support zone / demand area
Potential Drop: -$4,434.27 (-5.31%)
Big reward zone if price dumps from supply
📈 Trendline & Moving Averages
🔵 Blue = Likely 50 EMA
🔴 Red = Likely 200 EMA
Bullish momentum leading into the supply zone
Trendline supports the prior uptrend, now testing reversal
💡 Conclusion
✅ Trade Bias: Bearish (short)
⚖️ Risk-to-Reward: ~1:5 (Great!)
If price reacts at supply, this setup could pay big
But if it breaks up, stop loss keeps you safe

Bitcoin buy on dip near support 86800-87000 1st resistance How to take trades using Harmonic pattern projection Trade setup is explained below :-
Entry : 1st SL point : 0% is recent top or bottom.
Trailing D: 11.4% is work as trailing SL of buy or sell trade if hit then we have to book profit
.If price goes below 2nd D 21.4% to 23.6% range then early traders can make fresh reversals trade after breaking 1st D 11.4% safe traders can reversal trade after breaking Point D 21.4% to 23.6% range
Targets :
Target T1 : 35.1% to 38.3%
Target T3 : 49.1% to 53.2%
T3: 60.9% to 64.8% is our 3rd Target since this is reversal zone so must book profit if break then take fresh trade again
Target T4 : 76.4% to 79.7%
Next Targets are 100% , 127.2% ,141.4% and final Target 161.8%.
How to take reversal trade :
If price going upside/ downside then then buy or sell levels appear on Chart ( Automatically show when price reach any reversal zone of harmonic projection pattern based .
After showing reversal levels wait for confirmation until 21.4% or 28.3 % level not break if break then exit from current buy / sell trade and take fresh reverse trade buy/ sell .
Trailing SL:
After reach 1st Target trail SL to just above or below cost ( for example we are holding sell trade from 100 1st Target 110 hit then move trailing sl to 104-105 and move SL as price move upside or Downside)
Re- Entry :
For Re-entry in any pull back Point D ( 11.4% ) is used for re-entry then SL recent high or low Point SL ( 0% ) .
Blue Line is 1st support/ Resistance
Green line is 2nd support/ resistance
Red line is 3rd Support/ resistance

Bitcoin Trade Setup: Bullish Breakout Targeting $87K!🔹 Key Levels Identified:
📌 Target Point: 87,008.21 USD 🏁🔵
👉 Expected price move (+9.07%) 🚀
📌 Entry Point: 79,719.00 USD ✅
👉 Suggested buying level in demand zone 🏦
📌 Stop Loss: 78,213.25 USD ❌🔻
👉 Risk management level 📉
📊 Technical Analysis:
📈 Trendline Support:
🔵 The price bounced off the trendline 📊, confirming an uptrend 📈
🔵 Demand Zone:
🟦 Marked blue area = Buyer interest 📊
💰 Expected reversal zone if price retests
📊 Moving Average (DEMA 9):
🔸 82,343.85 USD (current level)
🔺 Price slightly below DEMA ➝ possible bullish reversal 🚀
⚡ Trade Setup:
✔️ Risk-to-Reward Ratio:
🟢 Potential profit: +7,220.76 USD
🔴 Risk: -1,500 USD
📊 Favorable trade setup with high reward vs low risk ✅
✔️ Momentum Confirmation:
🟢 Above 79,719 USD = 🚀 Bullish breakout
🔴 Below 78,213.25 USD = ❌ Stop Loss triggered
🔮 Conclusion:
🔥 Bullish setup if price holds demand zone!
🚀 Target: 87,008 USD
⚠️ Manage risk with stop loss! 📉

BITCOIN , BTCUSD
Bitcoin is currently finding support at the trend-line. Let's see whether it moves up from this support or breaks down. We should wait for the candle close this week for a clearer indication.
The stock market is unpredictable and can be influenced by large players. In recent years, we've seen significant struggles, like the COVID-19 pandemic and the Russia-Ukraine war, along with political events like Trump's actions. Although the market tends to recover quickly after crashes, it can also drop suddenly, as Newton's law suggests: what goes up fast can come down fast.
After the pandemic, many people wanted to invest in stocks, which attracted big investors and social media influencers promoting specific stocks that they wanted to sell. Many investors believe it's always good to buy the dip, but how much you invest matters. It's wise not to put all your money into the market; instead, diversify your investments across at least three different areas.
Don’t invest blindly just because the market is down. Additionally, governments often regulate the stock market in ways that benefit large investors while imposing higher taxes on ordinary people. I don’t blame the wealthy or those in power, as they were once normal people too; it's how we change with more money that can lead to different behaviors.

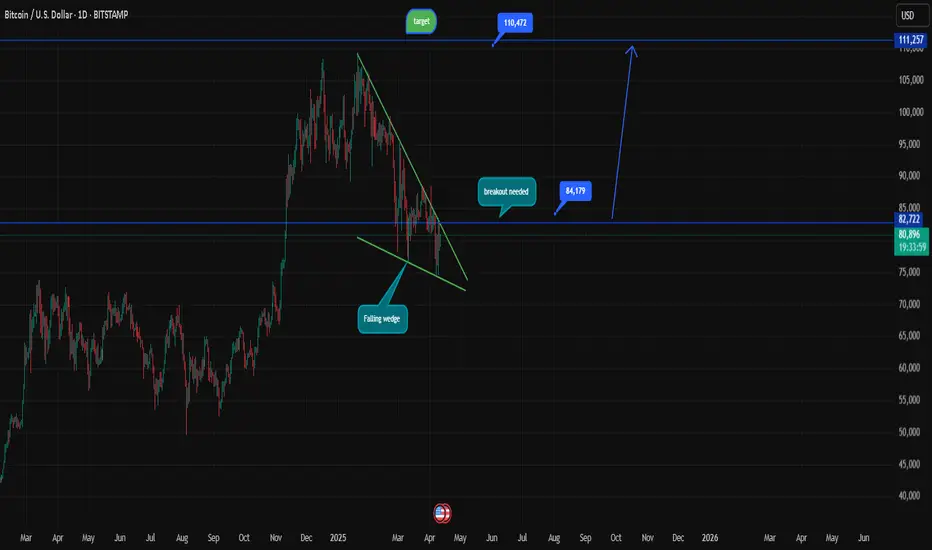
Bitcoin Daily Outlook: Falling Wedge Signals Breakout Potential Bitcoin is currently trading at $80,837 and is forming a classic falling wedge pattern on the daily timeframe, which is typically a bullish reversal setup. The pattern indicates that the selling pressure is gradually weakening, and a breakout to the upside could be imminent. The immediate resistance to watch is around $84,179—a clear breakout above this level is essential to confirm the bullish move. Once breached, the next major target stands at $110,472.
However, lower timeframes are showing choppy and indecisive price action, suggesting a phase of consolidation and uncertainty among market participants. This reinforces the importance of waiting for a confirmed breakout from the wedge on the daily chart. Traders should be cautious of fakeouts and look for volume confirmation and strong candle formations near resistance. Until then, Bitcoin may continue to range within the wedge, testing both support and resistance levels.
Bitcoin (BTC/USD) Long Trade Setup –with Target 88,573,60Current Price: $80,724.28
Entry Point: $80,671.23 (just above current price)
Stop Loss: $78,052.44
Target Point: $88,573.60
Resistance Point: $82,260.90
📈 Trend & Moving Averages
EMA 30 (red): $80,220.87 — Short-term trend.
EMA 200 (blue): $80,788.61 — Long-term trend.
The price is currently between the EMAs, indicating potential indecision or a shift in trend. A break above both EMAs with momentum would confirm bullish strength.
🔑 Trade Setup Summary
Element Level
Entry 80,671.23
Stop Loss 78,052.44
Target (TP) 88,573.60
Resistance 82,260.90
Risk-Reward ~1:2.7 (approx)
📊 Analysis & Expectations
Bullish Bias: The chart suggests a long trade with a breakout strategy.
Volume and momentum confirmation will be key above resistance.
Resistance at 82,260.90 may cause a brief pullback before continuation to the target.
The stop loss is well-placed below a support zone and the most recent swing low.
✅ What to Watch For
Break and close above EMA 200 and resistance at 82.2K.
Bullish volume increase on breakout.
Price action around the entry zone (wait for confirmation candle if unsure).

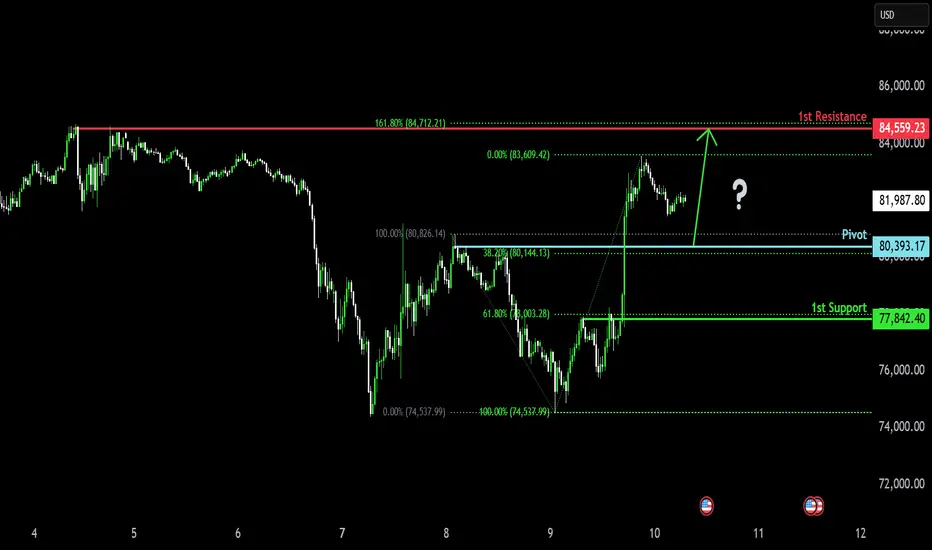
Could the Bitcoin bounce from here?The price is falling towards the pivot which acts as a pullback support that lines up with the 38.2% Fibonacci retracement and could bounce to the 1st resistance.
Pivot: 80,393.27
1st Support: 77,842,40
1st Resistance: 84,559.23
BTCUSD SHORT ANALYSIS Hello traders I hope you have made good bucks from this volatility, this trade analysis is advance trade analysis(not active yet) as you can see BTCUSD shows some good upside after the news of tarrif pause from US, and reach at the previous resistance zone our trade will be active if it closes below 81200 in 15min tf with almost more than 1:3 RR with sl of 82300 and tp of 77000-78000 range. Don't forget to trail your sl once you get 1:1 profit and book part quantity and trail rest at buying price so our trade becomes risk free. If BTCUSD don't close below mentioned lvl our trade won't be active.and one more thing 82300 sl is for safe traders for risky traders SL will be 83553.
This is my personal view, I reserve the right to be wrong. Please do your own research before taking any trades.

Bitcoin (BTC/USD) Technical Analysis – Bullish Setup🔵 Key Levels:
🎯 Target Point: 87,050.22 (🔼 Expected upward move)
🔵 Support Zone: 79,833.82 (🛡️ Strong demand area)
🔴 Current Price: 82,254.27
📊 Analysis:
🔵 RBS + RBR Zone (🔄 Role Reversal Support & Rally Base Rally) - Possible entry point for a long position.
🟠 Stop Loss: Below 79,833.82 (🚨 Risk Management)
🟣 Resistance Zone: Near 83,000 (🔄 Possible short-term pullback)
📈 Strategy:
1️⃣ Price might retrace to the blue zone (support) before continuing upward.
2️⃣ If it holds, 🚀 potential rally towards 87,050.22 🎯
3️⃣ If it breaks below support, ⚠️ possible downside risk.
✅ Conclusion:
A bullish setup with a 7.45% profit target 📊
Risk managed with a stop loss below support ⚠️

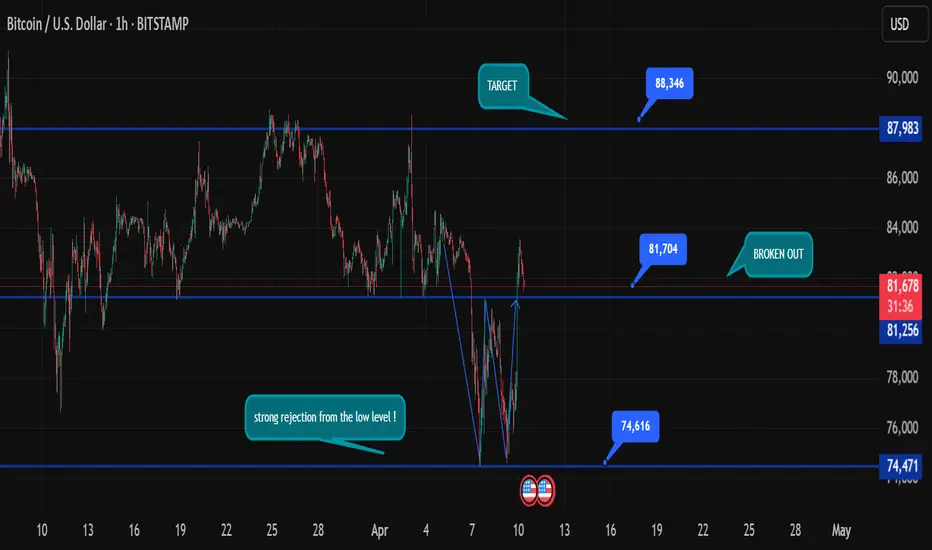
Bitcoin Daily Analysis – April 10, 2025Bitcoin (BTC/USD) has staged a powerful rebound from the crucial support zone near 74,471, signaling strong buyer interest at lower levels. The sharp rejection from 74,616 created a classic V-shaped recovery, suggesting aggressive demand stepped in after a steep correction. The price has now broken out above the key resistance of 81,256, turning it into a potential support level.
This breakout has been sustained with a clean candle close above the 81,704 zone, reinforcing the bullish momentum. The structure shows a potential inverse head and shoulders pattern on the hourly chart, which further strengthens the bullish case.
Key levels to watch:
Immediate support: 81,256 – Holding above this confirms bullish continuation.
Next resistance/target: 87,983 (minor), with a major upside target at 88,346.
Strong demand zone: 74,471 – 74,616
Volume has also picked up during the breakout, adding confirmation to the move. If bulls manage to maintain control above 81,700, we could see an extended rally in the coming sessions. However, a failure to hold above 81,256 could lead to a retest of the 78K–79K zone.
Bias remains bullish, with every dip above 81,000 viewed as a buying opportunity until structure is invalidated.
BTC/USD Bullish Breakout Setup – Targeting $85,477 with 5.62% UpThe price has recently surged above both the 30 EMA (red) and 200 EMA (blue), signaling a strong bullish move.
The EMAs are beginning to turn upward, particularly the 30 EMA, suggesting short-term bullish momentum.
Key Levels Identified
Entry Zone (Purple Support Zone):
Around $80,105 – a potential buy zone after a pullback.
Labeled with STOP LOSS, indicating the invalidation level if price drops below this zone.
Target Zone (Purple Resistance Zone):
Around $85,477 – this is the target level, marked as “EA TARGET POINT”.
Offers a potential move of +5.62% or 4,551.83 points.
Price Action
Price broke above a previous resistance (now support) and has pulled back slightly.
The projected move suggests a bullish continuation after a minor pullback and consolidation.
Risk-Reward
Good risk-reward ratio implied with the large gap between the stop loss and target.
Stop loss is tight, just below the purple support zone (~$80,105).
Projection
The blue lines and annotations suggest a bullish play, with an expected upward movement after retesting the support.
✅ Possible Trade Idea
Buy Zone: ~$80,105 (on a confirmed retest)
Stop Loss: Slightly below $80,105
Target: ~$85,477
Expected Move: +5.62%
🔍 Additional Notes
Keep an eye on price behavior around the support zone—confirmation (e.g., bullish candle pattern or rejection wick) strengthens the entry.
The strong move leading to the breakout suggests high momentum, which could mean limited pullback.
News or macro developments could invalidate technicals—be aware of external factors.

How to Trade Using Automatic Fibonacci Zones!What is AutoFibGauge? How to Trade Using Automatic Fibonacci Zones! 🎯
⸻
Manually drawing Fibonacci retracements can be confusing and time-consuming.
That’s why I use AutoFibGauge, a custom tool that automatically detects swing highs and lows and plots key Fibonacci levels for you.
It makes my trading faster, more accurate, and helps avoid emotional errors.
⸻
What is Fibonacci Retracement?
Fibonacci retracement is based on the idea that markets tend to retrace a predictable portion of a move before continuing in the original direction.
The most important Fibonacci levels are:
• 23.6% – Minor pullback
• 38.2% – Healthy correction
• 50.0% – Psychological midpoint
• 61.8% – Golden zone (high probability bounce/reversal area)
• 78.6% – Deep correction zone
Traders use these levels to spot potential support and resistance zones.
⸻
What AutoFibGauge Does:
• Automatically finds recent swing points
• Plots Fibonacci retracement levels instantly
• Highlights important reaction zones like 38.2%, 50%, 61.8%
• Updates dynamically as the market evolves
⸻
How I Use It:
1. Identify if price is reacting to key Fib levels (like 0.382 or 0.618)
2. Combine with trend confirmation (like QMA or Parabolic SAR)
3. Plan entries, exits, and stop-loss around these Fib zones
This saves time and removes the guesswork!
⸻
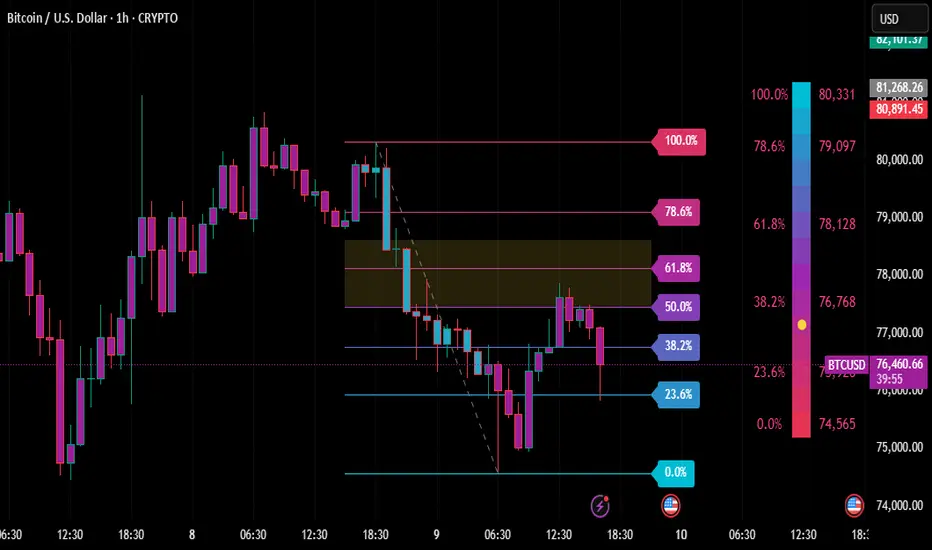
Real Example (BTC/USD 1H Chart):
• After a strong fall, AutoFibGauge plotted the Fibonacci zones automatically.
• Price reacted perfectly near the 61.8% and 78.6% retracement areas.
• These zones act as high-probability reversal or continuation areas.
⸻
I’m using the AutoFibGauge indicator (available free under TechnoBlooms on TradingView).
If you’d like the direct link or help setting it up, feel free to comment below or DM me!
⸻
Tap LIKE ❤ & FOLLOW ➕ if you found this helpful! More trading tools and strategy tips coming soon!
⸻
#BTCUSD #Bitcoin #AutoFibGauge #FibonacciTrading #TechnicalAnalysis #PriceAction #TradingTools #LearnTrading #CryptoTrading #ForexStrategy
Bitcoin is preparing for falling (08.04.2025)Please go through chart information carefully.
There are many reasons behind the bears who is gathering strength.
price breaks major trendline,
price rejecting from resistance zone many times,
Price breaks the support level.
Advice-
Our preference is as below:
BTCUSD sell NOW @78500
TP1-77000
TP2-75000
TP3-70000
SL- As suggest in the chart

Trade Idea: SELL BTCUSD at 78,200 – 78,500🧠 Technical Analysis (1H Chart):
Key Resistance Zone: 78,200 – 78,500 USD
Price has consistently failed to break above this area.
Multiple rejections from this zone suggest a strong supply zone.
This area aligns with historical resistance + EMA confluence.
Trend Structure:
Price formed a lower high and shows signs of a short-term bearish reversal.
Breakdown from minor support at 77,800 confirms weak momentum.
Current price action shows hesitation with reduced buying volume.
Volume Analysis:
Large red volume bars signal strong seller presence near resistance.
Weak green candles near resistance imply exhausted buying interest.
🎯 Trade Setup:
Entry Zone: SELL from 78,200 – 78,500 USD
Stop Loss: Above 79,600 USD (just beyond strong resistance zone)
Take Profit:
TP1: 70,000 USD – major support & volume node
TP2: 68,000 USD – high probability support zone from recent base
📊 Risk-to-Reward (R:R): Approximately 1:3 to 1:4 – ideal for swing or short-term positional trades.
🚀 Follow me for more high-probability trading opportunities! 🚀

BTC/USD 1H Chart Analysis – Bearish Setup with SBR Rejection🔵 Key Zones & Levels:
🔷 SBR Zone (Support ➡ Resistance):
Price Range: ~$81,000–$83,000
🛑 Stop Loss: $83,002.31 (Just above resistance)
Expecting sellers to step in here if price retests this level
🟠 Mid-Range Zone:
Current price is consolidating just below SBR zone
Could form a lower high before dropping
🟦 Target Zone (Support Area):
🎯 Target Price: ~$75,000
Previous demand area – price bounced hard from here before
🔁 Trade Plan:
📉 Bias: Bearish
📍 Entry: Near current price or after retest of SBR zone
🛑 Stop Loss: $83,002.31
🎯 Target: $75,000 (approx -8.33%)
✅ Summary:
Risk-Reward: Appears solid (R:R > 2:1)
🕵️♂️ Watch for: Fakeouts or rejections in the SBR zone
🔻 Potential Move: -6,804 points if plan plays out

#BTCUSD – Death Cross Loading.. stay alert !! Bitcoin is inching closer to a death cross on the daily chart, and the signs are crystal clear:
🔻 Price Action:
Consistent lower highs and lower lows since mid-Feb.
Recent breakdown from the EMA cluster confirms bearish dominance.
📉 Moving Averages Breakdown:
🔴 9 EMA: Way below price – momentum dead.
⚪ 50 EMA: Sloping down aggressively.
🟡 200 EMA: Flattening, ready to be taken out.
The 50 EMA is now converging toward the 200 EMA → death cross imminent.
🎯 Key Levels:
Support: $74,000 – break this, and we slide fast.
Resistance: $78K– GETTEX:82K – the EMA graveyard.
🧨 Once the death cross confirms, long-term sentiment flips fully bearish.
Bulls need to act NOW, or we’re staring at $70K or lower.
Just charts.
Stay sharp. 💀📉

Bitcoin waiting for 420000🔮 Bitcoin Waiting for ₹4,20,000: A Mystical Insight by Najoomi Ji 🔮
In the cosmic dance of the stars and planets, every rise and fall in our material world is mirrored in the heavens above. As an astrologer and spiritual guide, I, Najoomi Ji, have always maintained that cryptocurrencies, especially Bitcoin, follow not only market trends but also planetary vibrations.
As per my latest analysis using Lal Kitab principles, Vedic astrology, and true sidereal planetary positioning, Bitcoin is under the influence of Shani (Saturn) and Rahu, two karmic planets that test patience and bring wealth after delays. The movement of Mercury, the planet of finance and speculation, into a favorable trine with Venus—the significator of luxury and value—is a strong astrological signal for an upcoming bullish trend.
🔭 Astro-Indications Supporting the 420000 Target:
Jupiter’s expansion in a fiery sign indicates large-scale investor optimism.
Saturn’s retrograde will remove weak hands from the market and stabilize the climb.
Chandra (Moon) aligning with Mars gives Bitcoin aggressive emotional energy, ideal for sudden surges.
🧿 As per my divine calculation, the 4,20,000 INR milestone is not just a number, but a cosmic checkpoint, likely to be touched during a planetary window opening between mid-May to mid-June 2025. This phase aligns with Akshay Tritiya, an auspicious period where anything started is said to multiply manifold.
💫 My Guidance for Believers and Investors:
Invest not just money, but faith.
Keep your trades clean, avoid greed.
Consult your personal horoscope before making big investments.
In the divine language of astrology, Bitcoin is not just a currency—it's a karmic evolution of wealth. And yes, ₹4,20,000 is written in the stars.
Stay tuned. Stay blessed.
~ Najoomi Ji 🌟
Astrologer | Vastu Consultant | Lal Kitab Specialist

BTC/USD) Bullish reversal analysis Read The ChaptianSMC Trading point update
This is a bullish reversal analysis on BTC/USD (Bitcoin to USD) on the 4-hour chart, suggesting a potential long opportunity after a sharp corrective move.
---
Key Breakdown of the Chart:
1. Strong Downward Move with Potential Reversal:
Bitcoin experienced a sharp drop from the 88k region to ~74,387.50, now hitting a key demand zone (marked as "Orderblock").
2. Bullish Reaction Expected:
From the Orderblock support zone, a bullish reversal is anticipated.
The projected move aims to fill the imbalance and test the target zone between 87,152.94 and 88,557.14.
3. RSI Oversold:
RSI is around 32.27, indicating oversold conditions and adding confluence for a potential bounce.
4. EMA (200):
The 200 EMA lies around 85,153.85, which may act as dynamic resistance on the way up.
Mr SMC Trading point
5. Price Target:
The expected upside move is approximately +13,722.85 points (+18.75%), aiming for the supply zone above 87k.
---
Conclusion / Trade Idea:
Entry Zone: Near 74,387.50, the orderblock/demand area.
Target Zone: 87,152.94 – 88,557.14
Bias: Bullish short- to mid-term reversal.
Confluences: Oversold RSI, clean support zone, potential trendline bounce, and price inefficiency above.
---
Pales support boost 🚀 analysis follow)

The Market Looks Brutal Right Now... But Stay With MeThe Market Looks Brutal Right Now... But Stay With Me
It feels like a bloodbath out there… but here’s the truth:
A fast and brutal dump is honestly better than a slow, painful bleed. It shakes out the weak hands quickly—and sets the stage for stronger recoveries.
We've seen this movie before:
▪️ The Covid flash crash
▪️ War shocks like Russia vs Ukraine
▪️ Black swan events like FTX blowing up
▪️ The chaos of the LUNA death spiral
➡️ Each time, fear dominated the feed.
➡️ Each time, the "This time it's different!" crowd got louder.
➡️ And each time, those who stayed calm and DCA’d into real projects walked away with massive wins.
So why should this time—just because of tariffs or macro FUD—be any different?
It’s not.
Zoom out.
The long-term trend is built on strong fundamentals, not headlines.
Stick to the plan: accumulate multi-cycle, high-cap coins. Ride the wave.
The short-term noise fades, but smart strategy compounds.
