Bitcoin Bybit chart analysis March 26Hello
It's a Bitcoinguide.
If you have a "follower"
You can receive comment notifications on real-time travel routes and major sections.
If my analysis is helpful,
Please would like one booster button at the bottom.
This is a 30-minute Bitcoin chart.
There is no Nasdaq indicator announcement today.
With the purple finger on the left,
I connected the long->short switching section in the existing strategy.
4-hour chart MACD dead cross imprint released.
The short-term pattern is broken and Nasdaq is moving sideways.
*Long position strategy when the red finger moves.
1. 87,141.5 dollars long position entry section / cut-off price when the green support line is broken
2. 89,177.2 dollars long position 1st target -> Top 2nd target
For those who are maintaining a short position,
Check if it breaks through the pink resistance line
The 1st section at the top and the 2nd section at the bottom are sideways sections. In particular, the first section at the top is the resistance line section of the Bollinger Band daily chart, and since it is pressed, adjustments can occur when touched.
Therefore, even if a rebound occurs at the red finger 87.1K,
if the daily candle is created tomorrow,
it should touch the first section 89.1K at the top to open the resistance line,
so that it can safely rise to the top section, right?
Since the mid-term pattern is broken from the green support line deviation,
it must unconditionally succeed in the rebound,
and it would be good to operate while watching the Nasdaq movement.
Up to this point, I ask that you simply refer to and use my analysis,
and I hope that you operate safely with principle trading and stop loss prices.
Thank you.
BTCMINI trade ideas

Bitcoin daily anaysis 27-3-2025BTC/USD already retraced to $85,000 before bouncing back to the current level of $87,667. This indicates that buyers stepped in at lower levels, defending the support zone. The price is now consolidating within a highlighted resistance zone, suggesting a potential breakout or rejection. If bulls push above this range with strong momentum, BTC could aim for $90,000+. However, failure to break out may result in another dip, possibly testing support levels again.We should watch for volume confirmation and price action near this zone for the next move.

Bitcoin (BTC/USD) 4H Chart Analysis: Bullish Breakout Ahead?📈 Ascending Channel:
🔹 The price is moving upward within a parallel trend channel.
🔹 Blue arrows (🔵) indicate resistance points where the price struggled.
🔹 Red circles (🔴) highlight support areas where the price bounced.
🟦 Fair Value Gap (FVG) Zone:
🔸 The blue-shaded area (FVG zone) suggests a possible retracement before a bullish move.
🔸 If the price dips into this zone, it may find liquidity and bounce back up.
📊 Projected Price Movement:
⚡ Expected pullback → into FVG zone (🔽), then a bullish push (🚀) towards $90,686.72 🎯.
🟡 Yellow arrow shows the anticipated price path.
📉 Support & Resistance Levels:
✅ Support: Around $86,000 - $86,500 (FVG zone).
🚀 Target: $90,686.72 (next major resistance).
📌 Exponential Moving Average (DEMA - 9):
🔹 The blue line (DEMA 9) at $87,414.57 is acting as dynamic resistance.
🔹 A break above this could confirm further upside movement.
💡 Conclusion:
🔸 Bullish bias remains strong 📈.
🔸 Watch for a dip into the FVG zone before a potential rally 🚀.
🔸 If Bitcoin holds support, it may reach $90K+ soon 🎯🔥.

Sell the rallyBTC CMP 87300
The confluence at 89200 is a strong resistance. The crypto has been unable to cross that zone for two days now. With a falling trendline at the same zone. In my view it is a sell now. Ur stops have to be above 89200.

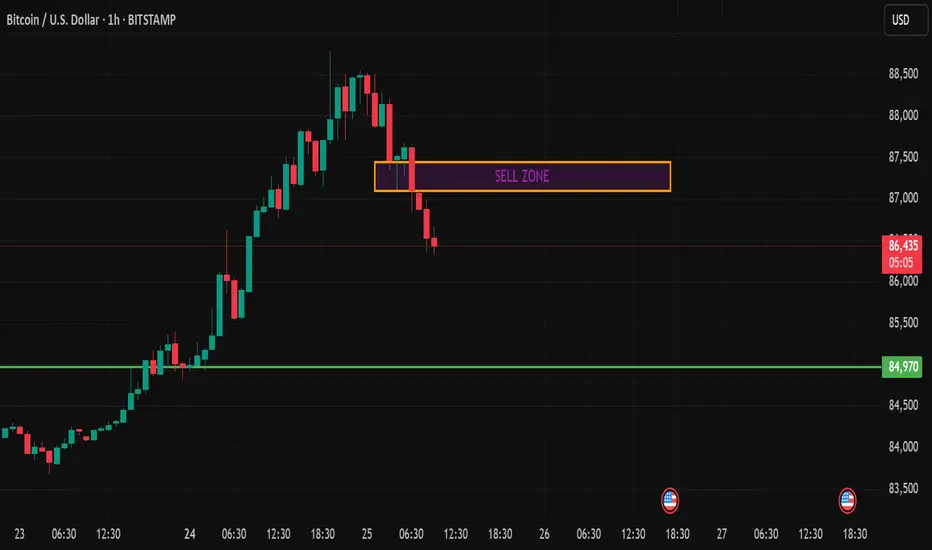
Bitcoin analysis 26-3-2025 Consolidation phase ?Bitcoin (BTC/USD) is currently consolidating within a key demand zone between $87,100 and $87,350, with multiple wicks indicating strong buying interest at this level. The price action suggests a range-bound movement, with resistance near $87,500 and major support around $84,970. If buyers hold this zone, BTC could see an upward move toward $88,000 or higher, while a breakdown below $87,100 may trigger a decline toward $85,000. The consolidation phase suggests accumulation, and a breakout in either direction will determine the next significant move. we should watch for a decisive close above resistance or below support for confirmation.

Bitcoin upside Target 92500-94000 continuesly buying from 81500How to take trades using Harmonic pattern projection Trade setup is explained below :-
Entry : 1st SL point : 0% is recent top or bottom.
Trailing D: 11.4% is work as trailing SL of buy or sell trade if hit then we have to book profit
.If price goes below 2nd D 21.4% to 23.6% range then early traders can make fresh reversals trade after breaking 1st D 11.4% safe traders can reversal trade after breaking Point D 21.4% to 23.6% range
Targets :
Target T1 : 35.1% to 38.3%
Target T3 : 49.1% to 53.2%
T3: 60.9% to 64.8% is our 3rd Target since this is reversal zone so must book profit if break then take fresh trade again
Target T4 : 76.4% to 79.7%
Next Targets are 100% , 127.2% ,141.4% and final Target 161.8%.
How to take reversal trade :
If price going upside/ downside then then buy or sell levels appear on Chart ( Automatically show when price reach any reversal zone of harmonic projection pattern based .
After showing reversal levels wait for confirmation until 21.4% or 28.3 % level not break if break then exit from current buy / sell trade and take fresh reverse trade buy/ sell .
Trailing SL:
After reach 1st Target trail SL to just above or below cost ( for example we are holding sell trade from 100 1st Target 110 hit then move trailing sl to 104-105 and move SL as price move upside or Downside)
Re- Entry :
For Re-entry in any pull back Point D ( 11.4% ) is used for re-entry then SL recent high or low Point SL ( 0% ) .
Blue Line is 1st support/ Resistance
Green line is 2nd support/ resistance
Red line is 3rd Support/ resistance

Bitcoin Bybit chart analysis March 24Hello
It's a Bitcoinguide.
If you have a "follower"
You can receive comment notifications on real-time travel routes and major sections.
If my analysis is helpful,
Please would like one booster button at the bottom.
This is the Nasdaq 30-minute chart.
There is an indicator announcement at 10:35,
The Bollinger Band 12-hour chart is touching the resistance line,
But it has not reached the center line of the daily chart.
A gap section is created at the bottom.
The blue finger is a short->long switching strategy,
And I just applied it to Bitcoin.
Bitcoin 30-minute chart.
*Red finger movement path
Long position strategy
1. $86,837.7 long position entry section / stop loss price when purple support line is broken
2. $90,418 long position 1st target -> Good 2nd target
The 1st section at the top
is the rising wave section for today's strategy to succeed
(Section for utilizing autonomous short section)
From the 1st section touch
The probability of the strategy succeeding increases.
Refer to Nasdaq movement.
The 2nd section at the bottom seems to be around 1+4 sections
The mid-term pattern is broken from the bottom touch.
After that, the possibility of the bottom gap reversal increases, so please note
Today, since it's been a while, I'll leave it as public
and go in.
Up to this point, I ask that you use my analysis as a reference only
I hope that you operate safely with principle trading and stop loss prices.
Thank you.

Bitcoin (BTC/USD) 2H Analysis: Potential Bullish Continuation or30 EMA (Red, 86,440): Indicates short-term momentum.
200 EMA (Blue, 85,153): Represents long-term trend support.
Support and Resistance Zones
Support Zone (Purple Box - ~86,271 to 85,153): Price is likely to bounce from here.
Resistance Zone (~87,149 and above): Breakout above this could push price higher.
Trade Setup
Entry Consideration: The price is currently testing a demand zone (purple) after a pullback.
Target (Take Profit - 90,118): Expecting a bullish move.
Stop Loss (~86,658 or lower): To manage risk.
Potential Price Action
If Bitcoin holds above the purple demand zone and 30 EMA, it could rally to 90,118.
A breakdown below 86,271 could push it toward 84,366 or lower.
Conclusion
Bullish Bias: If price holds above the support level.
Bearish Risk: If it breaks below the purple zone.
Recommendation: Monitor support at 86,271 and 85,153, as a bounce from these areas could confirm an uptrend.

Bitcoin analysis 25-3-2025 Bearish bias !! Bitcoin faced rejection from the 86,500 - 86,700 sell zone, triggering a sharp intraday drop. For day trades, the immediate target is 84,970, with a potential extension to 84,500 if selling pressure continues. Any pullbacks into the sell zone could provide fresh shorting opportunities, while a breakout above 86,700 would invalidate the bearish bias for the day.
Bitcoin (BTC/USD) Bullish Momentum: Key Levels and Trade Setupuddy'S dear friend 👋 SMC Trading Signals Update 🗾 🗺️
Technical Analysis:
Timeframe: 4-hour chart
Current Price: $88,244
Trend: Uptrend within an ascending channel
Supply Resistance Zone: $92,721 (Potential reversal area)
Fair Value Gap (FVG) Support Zone: $87,200 - $87,600
200 MA Resistance: Price is approaching the 200 Moving Average, which could act as resistance.
Key Levels:
1. Support:
FVG Zone (~$87,200 - $87,600) – Potential buy zone
Major Support: $86,649
2. Resistance:
$92,721 (Supply Zone) – Key target level
$90,000 Psychological Resistance
3. RSI Indicator:
Currently at 76.37, indicating overbought conditions.
A potential pullback could occur before further upside.
Mr SMC Trading point
Risk Management Strategy:
Long Entry: Near FVG Zone (~$87,200 - $87,600) if price retraces.
Stop Loss: Below $86,649 to limit downside risk.
Take Profit: Around $92,721 for a risk-reward trade.
Market Outlook:
Bitcoin remains bullish, but the RSI suggests a possible pullback before continuation.
A retracement into the FVG Zone may provide a better buying opportunity before the next leg up.
If price breaks below the FVG zone, the uptrend could weaken.
Pales support boost 🚀 analysis follow)

Breaking: $BTC reclaims $87,000, What Next?🚨 Breaking: CRYPTOCAP:BTC reclaims $87,000 🚀
POI: $88,000–$90,000
This zone is crucial — it will decide Bitcoin's next major move.
Watch closely:
✅ Hold above $90K = bullish continuation
❌ Rejection from POI = possible pullback
#Bitcoin #BTC

Bitcoin again buy near support 85900 , 92600 to 94000 Target How to take trades using Harmonic pattern projection Trade setup is explained below :-
Entry : 1st SL point : 0% is recent top or bottom.
Trailing D: 11.4% is work as trailing SL of buy or sell trade if hit then we have to book profit
.If price goes below 2nd D 21.4% to 23.6% range then early traders can make fresh reversals trade after breaking 1st D 11.4% safe traders can reversal trade after breaking Point D 21.4% to 23.6% range
Targets :
Target T1 : 35.1% to 38.3%
Target T3 : 49.1% to 53.2%
T3: 60.9% to 64.8% is our 3rd Target since this is reversal zone so must book profit if break then take fresh trade again
Target T4 : 76.4% to 79.7%
Next Targets are 100% , 127.2% ,141.4% and final Target 161.8%.
How to take reversal trade :
If price going upside/ downside then then buy or sell levels appear on Chart ( Automatically show when price reach any reversal zone of harmonic projection pattern based .
After showing reversal levels wait for confirmation until 21.4% or 28.3 % level not break if break then exit from current buy / sell trade and take fresh reverse trade buy/ sell .
Trailing SL:
After reach 1st Target trail SL to just above or below cost ( for example we are holding sell trade from 100 1st Target 110 hit then move trailing sl to 104-105 and move SL as price move upside or Downside)
Re- Entry :
For Re-entry in any pull back Point D ( 11.4% ) is used for re-entry then SL recent high or low Point SL ( 0% ) .
Blue Line is 1st support/ Resistance
Green line is 2nd support/ resistance
Red line is 3rd Support/ resistance

BTC LongInstrument: Bitcoin Perpetual Futures (BTCUSD.P)
Timeframe: 15-Minute Chart
1. Breakout Analysis
The chart shows a clear breakout above a horizontal resistance zone (highlighted in yellow). The breakout candle is large and bullish with increased volume, confirming strength in the move. A potential bullish continuation is indicated by the breakout, suggesting higher targets.
2. Volume Analysis
Noticeable spike in volume during the breakout, which strengthens the validity of the move. High volume confirms that buyers are stepping in and supporting the price action. Sustained volume post-breakout would indicate a higher probability of continuation.
3. RSI (Relative Strength Index) Analysis
RSI is at 70.81, which places it near the overbought zone (>70). However, the RSI has crossed above 70 with strong momentum, which often signals strength rather than an immediate reversal. RSI can stay elevated in strong uptrends, so overbought alone isn’t necessarily a reversal signal.
4. EMA Analysis
The chart includes the 10 EMA (red) and 20 EMA (green):
10 EMA > 20 EMA ➔ Bullish signal.
Price is trading above both EMAs, confirming strong upward momentum.
The EMAs are sloping upward, showing a trending market.
✅ Entry and Exit Strategy
📌 Entry:
Ideal entry = Retest of the breakout zone (~$88,000) OR next bullish candle closing above the breakout level.
Confirmation = Price holding above the breakout zone with consistent volume.
🎯 Targets:
First target = $88,800 (near-term resistance).
Second target = $89,700 (next resistance based on historical price action).
🚨 Stop Loss:
Place stop loss below the breakout zone (~$87,500) OR below the 20 EMA if volatility increases.
🔁 Exit:
Partial exit at first target to secure profits.
Trail the stop-loss using the 10 EMA once the price moves in favor.
Exit completely if the price closes below the 20 EMA with high volume.
⚠️ Educational Disclaimer
This analysis is for educational purposes only and does not constitute financial advice. Trading involves substantial risk, and past performance is not indicative of future results. Please conduct your own research and consult with a financial advisor before making any trading decisions.

Bitcoin Bybit chart analysis March 19 Hello
It's a Bitcoinguide.
If you have a "follower"
You can receive comment notifications on real-time travel routes and major sections.
If my analysis is helpful,
Please would like one booster button at the bottom.
Here is the Bitcoin 30-minute chart.
There will be a Nasdaq index announcement (FOMC interest rate announcement) at 3 AM soon.
I created today's strategy based on Nasdaq.
*When the red finger moves,
One-way long position strategy
1. 83,451.4 dollars long position entry point / green support line breakaway stop loss price
2. 85,233.8 dollars long position 1st target and after autonomous short -> Top autonomous long
-> Good to up to 94,179.7 dollars long position final target price
(You can check the price if you drag the chart.)
The purple finger section at the top
is the place where you should touch first to have a high chance of success in the strategy. This is a section for autonomous shorts and rising waves,
(If it comes down right away, the safe section in the short-term rising trend is number 2)
If it breaks the 3rd sky blue support line at the bottom,
the rising trend line may break,
and since the previous low is broken from the bottom,
you should open it up to $79,712.8 by the weekend.
(Major rebound section)
Please use my analysis articles for reference only,
and I hope you operate safely with principle trading and stop loss prices.
I will see you next Monday due to personal reasons.
Thank you.

Bitcoin (BTC/USD) 4H Analysis: Bullish Breakout or Pullback? 🔍 Key Observations:
🔹 📈 Trendline Breakout: The descending trendline (white) has been broken, signaling a potential uptrend.
🔹 📍 Support & Resistance Zones:
🟢 Strong Support (~$80,349 - $82,000): 📉 If price drops, this zone could act as a bounce area. 🛑 Stop-loss is placed below.
🟡 Resistance (~$86,000 - $88,000): 🔄 Currently testing this level—either a breakout or a rejection could follow.
🔵 Next Target (~$94,000): 🚀 If Bitcoin pushes above resistance, this could be the next stop.
📊 Possible Price Action Scenarios:
✅ Bullish Path:
🟢 Breaks Above $86,000 → Targets $94,000 🚀
🔄 Small retest of support before continuing up 📈
❌ Bearish Path:
❌ Rejected at $86,000 → Pullback to $82,000 🔽
📉 If support fails, price may drop further
🎯 Conclusion:
🔥 Bullish Bias: 🟢 A breakout above $86,000 increases the chance of hitting $94,000+.
⚠️ Watch for retests! 🔄 A pullback before an upward move is possible.
🚀 Final Thought: If BTC **

BTC daily analysis 24-3-2025 More bullish side .Bitcoin looks strong for an upmove today. Buying from 85,300-85,700, targeting 86,500/87,200, with SL below 84,900 makes sense. Price action is solid on the buy side, so keep an eye on it.
• Daily trend remains bullish, with buyers stepping in on dips.
• Strong support is holding around the lower range, indicating demand.
• Momentum indicators show strength, confirming the uptrend.
• Break above 86,500 could trigger further upside acceleration.
• Short-term pullbacks are opportunities to buy unless key support breaks.

BTC#22: BTC recovers slightly. Is the bear wave over?
In the past few days, BINANCE:BTCUSD has been continuously SW in the 81~85k area. Is this a sign that BTC will rise again? Let's analyze in detail and plan a trade BINANCE:BTCUSDT :
1️⃣ **Fundamental analysis:**
📊 The IMF has included Bitcoin and other digital assets in the framework of the global economic report for the first time. This shows that BTC is being recognized as a real asset.
🚀 The probability that the US government will buy Bitcoin in 2025 is 30% with information that the Trump administration may use profits from Gold to increase Bitcoin reserves
2️⃣ **Technical analysis:**
🔹 **Frame D**: the bear wave has not shown any signs of ending. The price has been anchored in the 80~85k area for a long time, but there has been no significant fluctuation and the sign of recovery is still unclear.
🔹 **H4+H1 frame**: The current short-term price structure is temporarily increasing with the appearance of higher peaks and higher bottoms. However, the price has not surpassed the important key zone to change the main trend.
3️⃣ **Trading plan:*
📌 At the present time, the current price has no clear signs when BTC is still fluctuating continuously in the SW area. Currently, the price is in a recovery phase with the nearest target being the resistance area of 88~91k. The current area is also not good for seeking profit from BUY positions. We can wait for the price reaction to the resistance area to consider establishing a SELL position. Prioritize trading in accordance with the main trend.
💪 **Wish you success in making profits!**

Bitcoin (BTC/USD) Supply & Demand Zone Analysis – Potential BearThis chart represents a Bitcoin (BTC/USD) price analysis on a 30-minute timeframe. Here’s a breakdown of the key elements:
Supply Zone (Resistance) at ~$85,599
The price has approached this supply zone, which could act as a resistance level.
The expectation is that the price may struggle to break above this level and could reverse downward.
Demand Zone (Support) at ~$81,500 - $81,755
This is labeled as the "diamond zone," which could act as a strong support area where buying interest may emerge.
The price is anticipated to decline towards this level.
Projected Price Movement
The blue arrows suggest a bearish scenario.
The price might initially react to the supply zone, then break below the trendline, confirming a downtrend.
The target for this downward move is the demand zone around $81,500.
Trendline Break
A rising trendline is drawn, which currently acts as support.
If the price breaks below it, it would confirm a bearish momentum shift.
Conclusion
This chart suggests a short-selling opportunity near the supply zone, targeting the demand zone. However, traders should watch for confirmations such as a rejection from resistance and a break below the trendline before entering a trade.

Lion Indicator bitcoin 1100 points running target5 reachThis lion indicator work well on 3min and 5min and 15 mins timeframes.
Disclaimer - this indicator only for education purpose and paper trade only

BTC holding buy from 83400 ,87100 upside Target How to take trades using Harmonic pattern projection Trade setup is explained below :-
Entry : 1st SL point : 0% is recent top or bottom.
Trailing D: 11.4% is work as trailing SL of buy or sell trade if hit then we have to book profit
.If price goes below 2nd D 21.4% to 23.6% range then early traders can make fresh reversals trade after breaking 1st D 11.4% safe traders can reversal trade after breaking Point D 21.4% to 23.6% range
Targets :
Target T1 : 35.1% to 38.3%
Target T3 : 49.1% to 53.2%
T3: 60.9% to 64.8% is our 3rd Target since this is reversal zone so must book profit if break then take fresh trade again
Target T4 : 76.4% to 79.7%
Next Targets are 100% , 127.2% ,141.4% and final Target 161.8%.
How to take reversal trade :
If price going upside/ downside then then buy or sell levels appear on Chart ( Automatically show when price reach any reversal zone of harmonic projection pattern based .
After showing reversal levels wait for confirmation until 21.4% or 28.3 % level not break if break then exit from current buy / sell trade and take fresh reverse trade buy/ sell .
Trailing SL:
After reach 1st Target trail SL to just above or below cost ( for example we are holding sell trade from 100 1st Target 110 hit then move trailing sl to 104-105 and move SL as price move upside or Downside)
Re- Entry :
For Re-entry in any pull back Point D ( 11.4% ) is used for re-entry then SL recent high or low Point SL ( 0% ) .
Blue Line is 1st support/ Resistance
Green line is 2nd support/ resistance
Red line is 3rd Support/ resistance

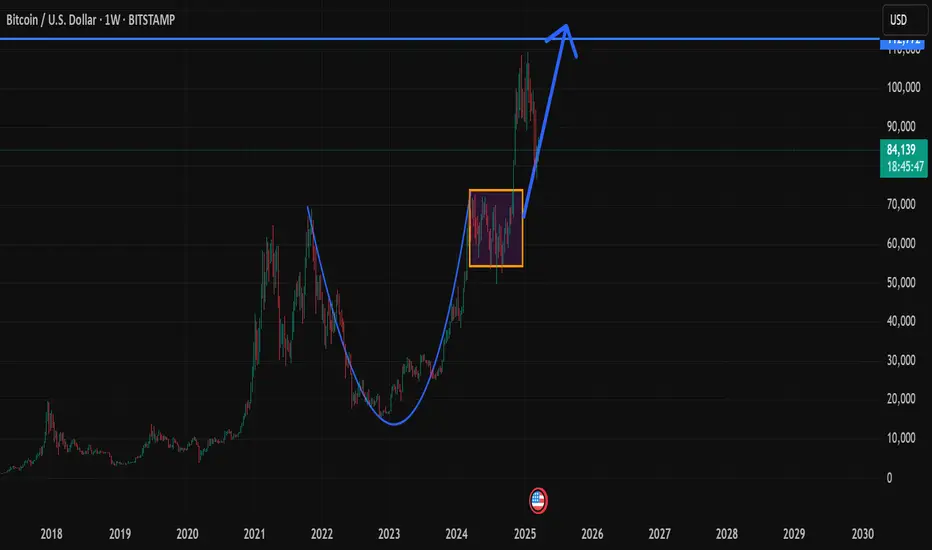
Bitcoin Price Action Outlook – Road to $140KBitcoin's price action is following a textbook Cup and Handle formation, signaling a major expansion phase ahead. The market structure shows clear higher highs and higher lows, confirming that buyers remain in control.
1️⃣ Accumulation and Expansion
From the $15K bottom in late 2022, Bitcoin has moved in three phases:
🔹 Phase 1 – Accumulation: Slow grind upwards with low volatility, signaling smart money entry.
🔹 Phase 2 – Expansion: Aggressive impulse move above $69K, where liquidity was absorbed.
🔹 Phase 3 – Consolidation (Handle Formation): The market briefly ranged between $60K - $74K, allowing leveraged longs to reset before the next breakout.
Bitcoin is now in the early stages of the next expansion phase, where price moves rapidly towards new highs as supply dries up.
2️⃣ Price Behavior Around Key Levels
$69K Breakout: The previous ATH was taken out with ease, confirming that supply at this level was weak.
$80K Retest & Accumulation: The recent pullback held above $78K-$80K, showing buyers defending this level aggressively.
$85K Breakout Zone: A push above $85K- GETTEX:87K with strong momentum will trigger a FOMO rally.
3️⃣ Liquidity Gaps & Momentum Play
Bitcoin's price action suggests thin liquidity above $85K, meaning price could move quickly toward six figures once sellers are absorbed. The next key liquidity zones are:
✅ $100K Psychological Barrier – Expect short-term reactions here.
✅ $120K-125K Profit-Taking Zone – Some early longs might book profits.
✅ $140K+ Price Discovery Mode – Once past $125K, Bitcoin enters an uncharted zone where price can overshoot targets due to momentum.
4️⃣ Market Behavior & Sentiment Shift
Smart Money Entry: The dips below $70K were aggressively bought, indicating strong institutional accumulation.
Retail FOMO Yet to Peak: Unlike 2021, retail traders have not yet fully entered the market, meaning the parabolic phase is still ahead.
No Significant Selling Pressure: Long-term holders are sitting on profits, but on-chain data shows minimal selling at current levels.
5️⃣ What’s Next?
📍 Short-Term: Bitcoin is gearing up for a strong weekly close above $85K, confirming the next leg up.
📍 Mid-Term: Once $100K is breached, expect a rapid move towards $120K-$125K.
📍 Final Expansion: Momentum could push Bitcoin to $140K and beyond, fueled by FOMO and post-halving scarcity.
Final Thoughts
Bitcoin’s price action is strong, clean, and controlled – characteristics of an asset in the early stages of price discovery. With each pullback being shallow and quickly absorbed, the next few months could see Bitcoin enter the parabolic phase, where price moves become unpredictably aggressive.
This is not the time to be bearish – Bitcoin is still setting up for its biggest move yet. 🚀
BTC -15 min LONGTrendline:
There’s a clear ascending trendline acting as support.
Price is currently testing the trendline, which aligns with the Order Block zone.
Order Block:
The highlighted yellow zone marks a demand area (Order Block), suggesting a potential bounce if buyers step in.
Potential Setup:
Entry: Look for a bullish confirmation (e.g., bullish engulfing, hammer) within or just above the Order Block zone.
Stop Loss (SL): Place the SL slightly below the Order Block at around 84,050 to allow for minor wicks and volatility.
Target:
First target: Around 84,400 (recent high resistance level).
Second target: If momentum sustains, aim for 84,600 to 84,700 (next key resistance).
✅ Trade Plan:
Entry: ~84,150 (inside the Order Block)
SL: ~84,050
Target 1: ~84,400
Target 2: ~84,600
This setup follows the trendline and order block confluence, giving a favorable risk-to-reward ratio.

VWAP Pulse Breakout — A Clean Intraday Strategy Using VWAP, ADX If you’re an intraday trader looking for clear, powerful setups without overcomplication, this strategy is for you.
VWAP Pulse Breakout is a simple yet highly effective intraday system that aligns:
• Price structure (VWAP)
• Trend strength (ADX)
• Momentum timing (Stochastic RSI)
It’s designed for beginners and pros alike, and works brilliantly on XAUUSD, US30, BTCUSD, Nifty/Bank Nifty, and more.
⸻
Strategy Rules
Buy Setup (Long):
1. Price closes above the VWAP line
2. ADX > 20
3. **Stochastic RSI crosses above 20 from oversold
Stop Loss: Below VWAP or recent swing low
Take Profit: 1:1.5 or 1:2 RR or when Stoch RSI reaches overbought (>80)
⸻
Sell Setup (Short):
1. Price rejects VWAP from below
2. ADX > 20
3. **Stochastic RSI crosses below 80 from overbought
Stop Loss: Above VWAP or recent swing high
Take Profit: 1:1.5 or 1:2 RR or when Stoch RSI reaches oversold (<20)
⸻
Chart Setup Guide (Beginner-Friendly)
1. Timeframe
• Use 5-minute or 15-minute charts
⸻
2. Indicators to Add
(a) VWAP – Volume Weighted Average Price
What it is:
VWAP shows the average price of the asset during the day, weighted by volume. It is used by institutional traders to define fair value.
How to add it:
• Go to Indicators → Search “VWAP”
• Choose the one labeled “VWAP” (Built-in)
Important:
If you see 3 lines (blue center + green bands), you’re using a VWAP with deviation bands.
Only use the central line for this strategy. Ignore or hide the upper/lower bands.
How to trade it:
• If price closes above VWAP, and ADX + Stoch RSI confirm → Buy
• If price rejects VWAP from below, and ADX + Stoch RSI confirm → Sell
Common mistakes:
• Using a custom VWAP with confusing bands
• Trading every touch — wait for confirmed breakouts or rejections
Pro Tip:
Best entries occur when price breaks VWAP after consolidation or rejects VWAP with strong wicks.
⸻
(b) ADX – Average Directional Index
What it is:
ADX measures trend strength, not direction. It helps you avoid flat markets and focus on trades with follow-through.
How to add:
• Search “ADX” → Add the built-in one
• Keep default length = 14
How to use:
• ADX < 15 = No trend → avoid
• ADX > 20 = Trend beginning → okay to trade
• ADX > 25–30 = Strong trend → ideal
Common mistake:
Trading without checking ADX → leads to choppy, low-momentum trades.
Pro Tip:
Ignore +DI and -DI — just watch the main ADX line.
⸻
(c) Stochastic RSI
What it is:
A fast momentum oscillator that tells you when price is overbought or oversold. It helps you time your entries perfectly.
How to add:
• Search “Stochastic RSI” → Use the built-in version
• Settings: K: 3, D: 3, RSI Length: 14, Stoch Length: 14
How to trade it:
• Crossing up from below 20 = Buy signal
• Crossing down from above 80 = Sell signal
(Only valid when VWAP + ADX confirm)
Common mistake:
Taking every cross as a signal without confluence.
Pro Tip:
Use Stoch RSI for entry precision, not trade direction. It’s the last confirmation, not the first.
⸻
3. Optional: Add Session Breaks
• Go to Chart Settings → Appearance → Enable “Session Breaks”
• Helps you identify London, NY, and Asian sessions
⸻
Why This Strategy Works
1. VWAP = Institutional Anchor
• Banks and funds use VWAP to measure fair value
• Breaks or rejections near VWAP = high-signal zones
• You’re reacting to real price flow, not guessing
⸻
2. ADX = Momentum Filter
• Keeps you out of slow, choppy markets
• Only lets you trade when price is ready to run
• Increases win rate dramatically
⸻
3. Stochastic RSI = Entry Timing
• Helps you enter after price and momentum align
• Prevents early/late entries
• Perfect tool for scalpers and intraday setups
⸻
4. High Confluence = High Probability
You’re only trading when:
• VWAP confirms structure
• ADX confirms trend
• Stoch RSI confirms timing
This triple alignment leads to:
• Fewer but cleaner trades
• High confidence, low stress
• Excellent results when practiced consistently
⸻
5. Works on Proven Intraday Assets
• Gold (XAUUSD) and US30 = strong VWAP reactions
• BTC/USD = great during NY/London overlap
• Nifty / Bank Nifty = ideal in Indian market hours
⸻
So… does it really work?
Yes — if you:
• Wait for all 3 confirmations
• Stick to proper SL & RR
• Avoid news and choppy sessions
• Practice discipline and trade clean setups
