BTCUSDT TRADING POINT UPDATE > READ THE CHAPTIANBuddy'S dear friend
SMC Trading Signals Update 🗾🗺️ crypto Traders SMC-Trading Point update you on New technical analysis setup for crypto BTC USDT. ) list time post signals 💯 reached target point ) 👉 New technical analysis setup BTC USDT looking for bullish trend 📈 FVG level support level. 83k 82k support level 87k 88k resistance level ). Guys 🤝 good luck 💯💯
Key Resistance level 87k + 88k
Key Support level 83k - 82kà
Mr SMC Trading point
Pales support boost 🚀 analysis follow)
BTCMINI trade ideas

BTCUSD SHOWING A GOOD DOWN MOVE WITH 1:30 RISK REWARD BTCUSD SHOWING A GOOD DOWN MOVE WITH 1:30 RISK REWARD
DUE TO THESE REASON
A. its following a rectangle pattern that stocked the market
which preventing the market to move any one direction now it trying to break the strong resistant lable
B. after the break of this rectangle it will boost the market potential for break
C. also its resisting from a strong neckline the neckline also got weeker ald the price is ready to break in the outer region
all of these reason are indicating the same thing its ready for breakout BREAKOUT trading are follws good risk reward
please dont use more than one percentage of your capitalfollow risk reward and tradeing rules
that will help you to to become a bettertrader
thank you

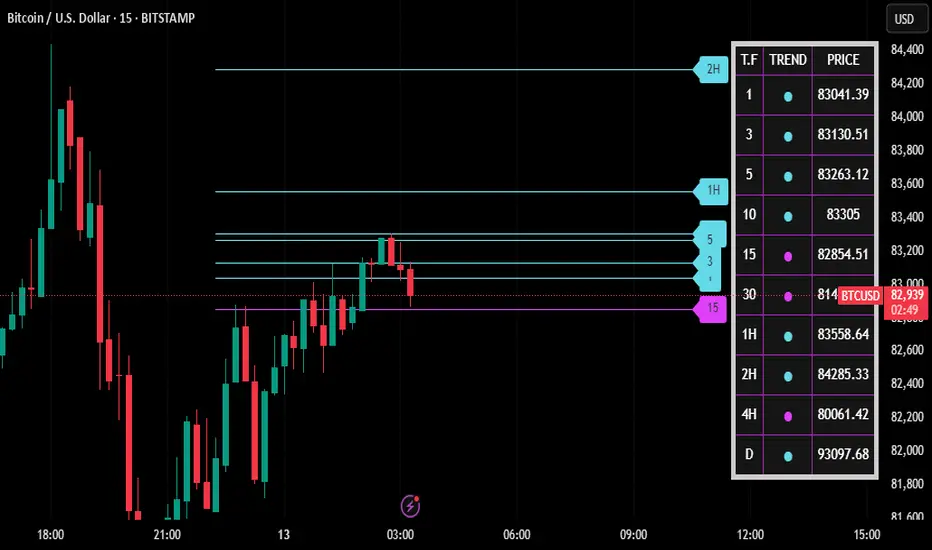
BTCUSD MAJOR SUPPORT & RESISTANCEHere i mentioned major s/r forn the BTCUSD if i look chart there is rejection at 1-1 line whenever it will sustained above this line it is sure that BTC may build biger candle and volume will increase as well so we should wait to break 1-1 line to go long,Here green lines are mentioned as sopport and red lines as resistance. this is not buy /sell call .

Bitcoin Looking good here for short termBitcoin Looking good here for short term, If bulls able to hold price above 80K then we can expect a good bullish rally for short to mid term towards 95k and then 100K.

BTC#21: Fear Index Rising. Will BTC Continue to Fall? 💎 💎 💎 BINANCE:BTCUSDT BTC's decline has somewhat slowed down in recent days with a recovery from 78k. We will plan for BINANCE:BTCUSD next 💎 💎 💎
1️⃣ **Fundamental Analysis:**
📊 The Fear and Greed Index dropped to 30 today, and the level is still fear
🚀 Cumulative net inflows into US spot Bitcoin ETFs have dropped to their lowest level since January 2
📌 The market is still in a pessimistic phase about BTC's bullish outlook. The outflow of money from the market is not only due to BTC's decline but also due to concerns about an economic recession due to Trump's unstable policies.
2️⃣ **Technical analysis:**
🔹 **D frame**: BTC's downtrend has shown signs of slowing down, but the main trend in frame D is still down. We will still need to wait for the price reaction in the resistance area to confirm.
🔹 **H4 frame**: The price trend is still down. The price reaction in the support area of 78K is not as strong as before, showing that market sentiment is still leaning towards the bears.
🔹 **H1 frame**: we are in a short-term correction. The target for this correction is the resistance area of 88-91K as you can see on the chart
3️⃣ **Trading plan:*
As you can see from the multi-frame perspective, the main trend is still down, but we are in a short-term correction. We can choose to wait for the price to return to the resistance area to trade in line with the main trend or if the price has a slight recovery, set up BUY to seek profit. However, because the main trend is down, we need to stop loss fully and not be greedy when the price hits resistance because the price can return to the main trend at any time.
💪 **Wish you success in achieving profits!**

### **"Mastering the Downtrend: A Professional Short Strategy ### Professional Short Analysis and Trading Plan for Bitcoin (BTC/USD)
**Market Overview:**
The current trend of Bitcoin (BTC/USD) on the daily chart shows a **clear downtrend**, as the price remains below the **BB 104 0.1 (lower)**. Additionally, the slope of **SMA 104** is significantly declining, confirming a **strong bearish trend**.
**Bollinger Bands Analysis:**
- The **BB 20 1** (Upper Band 1 - UB1) at **$89,587.18** and **Lower Band 1 - LB1** at **$82,326.86** mark the short-term volatility range.
- The **Channel LB12** zone between **LB1** and **LB2** indicates that the market is in a **short-term downtrend**.
- The price currently resides within the **Channel LB12**, indicating a weak buying momentum with no confirmed reversal signals.
**Trend Confirmation:**
- **BB 104 0.1 (lower)** at **$95,532.52** acts as a major resistance level, confirming that the market is in a **downtrend**.
- **SMA 104** slope is significantly negative, emphasizing the continuation of the bearish trend.
---
#### **Short Trading Plan:**
**1. Entry Strategy:**
- Look for short entry when the price retraces upward and approaches the **Upper Band 1 (UB1)** around **$89,587.18**.
- An additional entry point can be considered if the price fails to break above the **BB 104 0.1 (lower)** at **$95,532.52**.
**2. Position Sizing:**
- Open **1/3 (33.33%)** of the full position size due to the confirmed downtrend and strong bearish momentum.
- Increase to **1/2 (50%)** if the price fails to break UB1 and shows bearish signals like long upper wicks or bearish engulfing patterns.
**3. Stop Loss:**
- Place the initial stop loss slightly above **BB 104 0.1 (lower)** at **$96,000** to account for false breakouts.
- Adjust the stop loss dynamically based on the slope of **SMA 104** and **ADX** strength.
**4. Take Profit:**
- First target: **$82,326.86** (LB1) to capture initial momentum.
- Second target: **$75,000** as a psychological support level and previous consolidation zone.
- Trail the stop using the **BB 20 0.2 (Upper)** to lock in profits as the trend continues.
---
#### **Risk Management:**
- Maintain a **Risk-to-Reward Ratio (RRR) of 1:3** or better.
- Avoid excessive position sizing to minimize the impact of sudden volatility.
- Continuously monitor trend strength using **ADX** and slope analysis of **SMA 104**.
---
#### **Professional Insight:**
The market shows strong bearish characteristics with no significant bullish reversal signals at this time. The short strategy aims to capitalize on downward momentum while minimizing risk through calculated position sizing and adaptive stop loss placement.
Prepare for sudden price swings and volatility, especially around **major resistance levels**. Regularly reassess the trade as the market dynamics evolve.

Bitcoin holding buy @80200 , Target 88200-89000How to take trades using Harmonic pattern projection Trade setup is explained below :-
Entry : 1st SL point : 0% is recent top or bottom.
Trailing D: 11.4% is work as trailing SL of buy or sell trade if hit then we have to book profit
.If price goes below 2nd D 21.4% to 23.6% range then early traders can make fresh reversals trade after breaking 1st D 11.4% safe traders can reversal trade after breaking Point D 21.4% to 23.6% range
Targets :
Target T1 : 35.1% to 38.3%
Target T3 : 49.1% to 53.2%
T3: 60.9% to 64.8% is our 3rd Target since this is reversal zone so must book profit if break then take fresh trade again
Target T4 : 76.4% to 79.7%
Next Targets are 100% , 127.2% ,141.4% and final Target 161.8%.
How to take reversal trade :
If price going upside/ downside then then buy or sell levels appear on Chart ( Automatically show when price reach any reversal zone of harmonic projection pattern based .
After showing reversal levels wait for confirmation until 21.4% or 28.3 % level not break if break then exit from current buy / sell trade and take fresh reverse trade buy/ sell .
Trailing SL:
After reach 1st Target trail SL to just above or below cost ( for example we are holding sell trade from 100 1st Target 110 hit then move trailing sl to 104-105 and move SL as price move upside or Downside)
Re- Entry :
For Re-entry in any pull back Point D ( 11.4% ) is used for re-entry then SL recent high or low Point SL ( 0% ) .
Blue Line is 1st support/ Resistance
Green line is 2nd support/ resistance
Red line is 3rd Support/ resistance

BTC AT CRITICAL LEVEL – BREAKOUT OR PULLBACK?🚀 BTC/USD – KEY BREAKOUT LEVELS AHEAD!
📌 Market Overview
Bitcoin (BTC/USD) is currently trading around $84,593, rebounding strongly from support. The price is approaching a major resistance zone at $87,049 - $89,748, where a crucial reaction is expected.
Overall sentiment remains influenced by market psychology, institutional activity, and macroeconomic factors. BTC is still trading within a descending wedge pattern, signaling that the corrective phase is not over unless a breakout occurs.
📈 Technical Analysis – Key Levels to Watch
🔹 Major Resistance Levels:
🔺 $87,049 - $89,748: A strong supply zone; a breakout here could trigger a bullish move toward $92,000+.
🔺 $90,005 - $92,000: The next target if BTC successfully clears resistance.
🔻 Major Support Levels:
🔹 $82,000 - $80,000: A short-term support zone where buyers might step in.
🔹 $78,935 - $78,000: A critical support area—losing this level could lead to a sharp sell-off.
📌 Key Observations:
If BTC fails to break $87,000, a retracement toward $80,000 - $78,000 is likely.
A confirmed breakout above $87,000 - $89,000 could signal further upside momentum toward $92,000 or higher.
🌍 Fundamental Analysis – What’s Driving BTC?
🔥 1. Institutional Demand & Market Sentiment
Market sentiment remains positive, but BTC needs stronger institutional buying to sustain further gains.
On-chain data indicates whales are accumulating BTC at lower price ranges, but resistance remains strong at $87,000.
Bitcoin ETFs are seeing steady inflows, providing fundamental support for long-term bullish momentum.
📊 2. Macroeconomic Factors & USD Impact
The DXY (US Dollar Index) is weakening, which is generally bullish for BTC.
The Federal Reserve’s monetary policy remains a key factor—interest rates are expected to stay high until mid-2025, which could slow BTC’s momentum.
Recent CPI and PPI data indicate persistent inflation concerns in the US, boosting demand for BTC as a hedge.
💰 3. Whale Activity & Institutional Moves
On-chain data reveals significant BTC withdrawals from exchanges, signaling long-term accumulation.
If large buyers continue accumulating, BTC could push above $90,000.
However, if whales take profits near resistance, BTC may retrace toward $80,000 - $78,000 before another move higher.
⚡ Trading Scenarios
✅ Scenario 1: Bullish Breakout Above $87,000
If BTC closes above $87,000 with strong volume, expect a rally toward $90,000 - $92,000.
A further push could target $95,000 if bullish momentum sustains.
❌ Scenario 2: Rejection at $87,000 - $89,000
If BTC faces resistance, expect a pullback toward $82,000 - $80,000.
A deeper correction could test $78,000, where strong support lies.
📢 Conclusion – Watch for a Critical Breakout!
📌 BTC is testing a major resistance zone ($87,000 - $89,000)—a breakout could fuel further upside.
📌 Market sentiment remains positive, but a rejection could trigger a pullback toward $80,000 - $78,000.
📌 Monitor Fed policies, institutional activity, and on-chain trends for better trade positioning.
📌 Traders should wait for confirmation before committing to a breakout or short position.
💬 Do you think BTC will break above $87,000, or is a deeper pullback coming? Share your views below! 🚀🔥

BTCUSD GANN VIBRATIONS 15 MIN TIME FRAME.....15 MARCH 2025Gann Trading System is a very disciplined trading system if you know what you want to achieve while executing your trades. Chart shows Gann swings on smaller timeframe. Possible trades within the two dates are marked on chart. The time for trading is nearly 7 days. Possible trades were 10 in numbers. Swing trading is done on 4 min timeframe. But due to minimum 15 min tf required here to put the idea across to the users is used on chart.
Happy Trading !!!

BTC - M2 Bitcoin seems to be lining up with the M2 (Global Money Supply) at a 105 day offset. This could mean another leg higher for Bitcoin and crypto with a potential blast off May 6th. It looks like we can get a bounce over the next few days as well if this plays out!

BTC - Short 15 minFrom the Change of Character (ChoCH), the price has corrected up to its support and is now approaching the ChoCH level, as marked on the chart. With the Fibonacci 0.618 level acting as resistance, consider looking for buy-side liquidity to identify a potential short opportunity.

Bitcoin (BTCUSD) Rejection – Bearish Move Incoming?📉 Key Observations:
Resistance Zone (Purple Box): Price has tested this area and faced rejection.
Bearish Projection (Gray Box & Arrow): The chart anticipates a drop towards the $76,800 - $77,000 range.
Liquidity Grab? Price might consolidate before a sharp decline.
⚠️ Possible Scenarios:
Rejection Confirmation 🔻: If BTC fails to reclaim $84,470, selling pressure could increase.
Breakout Fakeout? 🤔: A deviation above resistance followed by a dump remains a risk.
🎯 Levels to Watch:
Resistance: $84,470 - $85,078
Support: $80,000 and $76,825
🔥 Final Take: If BTC struggles below resistance, a short setup could play out. Confirmation is key!

BTC 30 min SMC AnalysisOrder Blocks: Two significant order blocks are marked on the chart.
Order blocks represent areas where institutional buying/selling occurred. Price tends to react to these zones as they reflect smart money activity.
FVG (Fair Value Gap): An FVG is visible where price left an imbalance (marked in green). Price tends to fill these gaps before resuming its trend, showing that liquidity is being collected.
CHoCH (Change of Character): A CHoCH is identified where the market structure shifts from bullish to bearish or vice versa. This signals a potential trend reversal or a shift in market momentum.
Price is currently trading below the EMAs, indicating a bearish bias.
Volumes: Volume spikes are visible during major price movements.
Increased volume at the CHoCH suggests smart money involvement.
A rising volume at order block retests suggests liquidity grabs and potential reversal zones.
Trend : The overall trend appears to be bearish. Lower highs and lower lows. Price trading below the EMAs reinforces bearish pressure.
A break of the CHoCH and reaction at order blocks could signal a potential reversal or continuation.
Conclusion: Bearish Bias – Price is trading below the EMAs and reacting to order blocks. Potential Reversal Zone – If price holds the order block after the CHoCH, a bullish reversal might be in play. Liquidity Sweep – Price might test the FVG or the deeper order block before a clear move.

Bitcoin holding buy from 80350 , upside levels given on chartHow to take trades using Harmonic pattern projection Trade setup is explained below :-
Entry : 1st SL point : 0% is recent top or bottom.
Trailing D: 11.4% is work as trailing SL of buy or sell trade if hit then we have to book profit
.If price goes below 2nd D 21.4% to 23.6% range then early traders can make fresh reversals trade after breaking 1st D 11.4% safe traders can reversal trade after breaking Point D 21.4% to 23.6% range
Targets :
Target T1 : 35.1% to 38.3%
Target T3 : 49.1% to 53.2%
T3: 60.9% to 64.8% is our 3rd Target since this is reversal zone so must book profit if break then take fresh trade again
Target T4 : 76.4% to 79.7%
Next Targets are 100% , 127.2% ,141.4% and final Target 161.8%.
How to take reversal trade :
If price going upside/ downside then then buy or sell levels appear on Chart ( Automatically show when price reach any reversal zone of harmonic projection pattern based .
After showing reversal levels wait for confirmation until 21.4% or 28.3 % level not break if break then exit from current buy / sell trade and take fresh reverse trade buy/ sell .
Trailing SL:
After reach 1st Target trail SL to just above or below cost ( for example we are holding sell trade from 100 1st Target 110 hit then move trailing sl to 104-105 and move SL as price move upside or Downside)
Re- Entry :
For Re-entry in any pull back Point D ( 11.4% ) is used for re-entry then SL recent high or low Point SL ( 0% ) .
Blue Line is 1st support/ Resistance
Green line is 2nd support/ resistance
Red line is 3rd Support/ resistance

Bitcoin Scalping with Multi-Timeframe Parabolic SAR Bitcoin Scalping with Multi-Timeframe Parabolic SAR – A Smarter Approach 🚀
Scalping Bitcoin can be challenging, especially with rapid fluctuations and false signals. The Multi-Timeframe Parabolic SAR (PSAR) approach helps traders filter out noise by aligning lower and higher timeframe signals. This method ensures better trade accuracy by following the dominant trend before executing scalp trades.
⸻
How It Works 🔍
✅ Parabolic SAR (PSAR): A classic trend-following indicator that places dots above or below the price to signal trend direction.
✅ Multi-Timeframe Confirmation: Instead of relying on a single timeframe, this method overlays higher-timeframe PSAR values (e.g., 15M, 1H) onto a lower timeframe (e.g., 5M).
✅ Trend Alignment: A scalp entry is considered only when both higher and lower timeframes show a matching trend direction.
⸻
Why This Works for Scalping ⚡
🚀 Reduces False Signals: By filtering short-term trades with higher timeframe trends, traders avoid entering counter-trend setups.
🚀 Improves Precision: Entries and exits become more reliable when both timeframes confirm a trend.
🚀 Works in Any Market Condition: Whether Bitcoin is ranging or trending, multi-timeframe PSAR keeps you in sync with momentum.
⸻
Example Setup 📊
🟢 Long Entry: If 15M & 1H PSAR dots appear below price while the 5M chart shows a bullish crossover.
🔴 Short Entry: If 15M & 1H PSAR dots appear above price while the 5M chart flips bearish.
What do you think? Would you integrate multi-timeframe PSAR into your Bitcoin strategy? Let’s discuss below!
(P.S. Keep an eye on TechnoBlooms for more innovative indicators! 🚀)
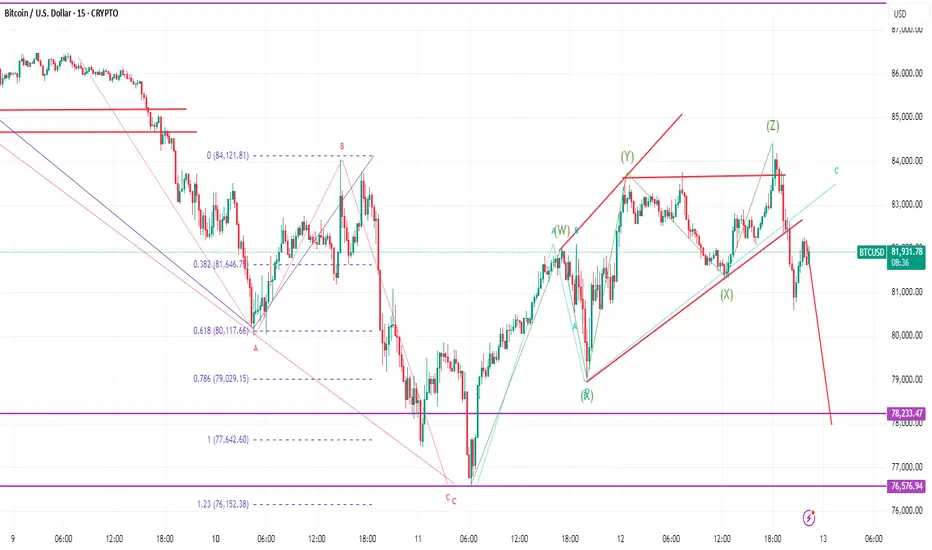
BTC update- next move the downside about started.BTC has completed Major move down and than corrected
Correction started from 76576 low and made high around 82k as a W wave and took abc correction
to the downside & correction completed at. 79k around and price bounced in Y wave,which is a ABC
correction and completed around 83.5K and next wave to the downside completed at. 81.3K and completed
X1 there and price went for next upside and completed triple zigzag pattern to the upside at
84.4K and broke to the downside.
Now if I am correct this move to the downside has to break the low of 76K.
Bitcoin Bybit chart analysis March 11Hello
It's a Bitcoinguide.
If you have a "follower"
You can receive comment notifications on real-time travel routes and major sections.
If my analysis is helpful,
Please would like one booster button at the bottom.
This is the Bitcoin 30-minute chart.
There will be a Nasdaq indicator announcement at 11 o'clock shortly.
As long as the Nasdaq doesn't crash,
it will continue to crash + forced coupling,
so it is not easy to analyze.
In this case, it is recommended to operate with a tight stop loss,
and since Bitcoin broke its previous low with yesterday's movement,
I created a strategy based on the major rebound section of 75,459.5 dollars at the bottom this week.
*When the blue finger moves,
it is a two-way neutral long->short switching strategy
The section from 1 to 83,529 dollars at the top is an autonomous short section.
You can operate based on the center line of the 4-hour chart that will be additionally created at 9 o'clock shortly.
For example, if a rebound is connected before 9 o'clock, it is the purple finger.
If a rebound occurs after 9 o'clock, it is the 1st section.
If it comes down immediately without touching, it is good to operate the long position waiting until the 2nd section at the bottom.
1. 80365 dollar long position entry section / stop loss price when the purple support line is broken
(If it comes down immediately without touching the short position entry section at the top, 83529 dollar long position 1st target -> short position autonomous section)
2. 84965 dollar long position target price -> 83529 dollar autonomous long position operation section
(Since it is the center line of the 6-hour chart, if it reaches this section, it is highly likely to continue to rise.)
After that, the target price is in the order of Gap9 -> Good -> Great,
but short position switching is done from the touch of the center line of the daily chart.
If it comes down right from the current position,
2 -> Look at Bottom
From Gap7, the previous low is broken again
It is good to operate it as a major rebound section up to $75,459.5 this week.
More than anything else, Nasdaq is the problem.
Since Bitcoin has a fast turnover rate
As long as Nasdaq doesn't crash/crash/crash, it's fine.
Please use my analysis up to this point as a reference only
I hope you operate safely with principle trading and stop loss prices.
Thank you.

BTCUSD.P_15Min_ShortIn the 15-minute time frame, we identify the Point of Interest (POI) following a liquidity sweep. Subsequently, we move to a lower time frame to place an entry within a clearly defined order block or POI zone. A target is then set, with the stop loss positioned just below the order block to manage risk effectively.

Very good shorting opportunity in btc. Setup explained Btc is falling from 1hour supply zone. It has failed rmed M pattern also. Good risk reward trade. Manage risk

BTCUSDBased on the chart's current momentum and the possibility of further upside, a bullish strategy might be considered.

Bitcoin updated levels buy near 79200 avoid sell trade buy onlyHow to take trades using Harmonic pattern projection Trade setup is explained below :-
Entry : 1st SL point : 0% is recent top or bottom.
Trailing D: 11.4% is work as trailing SL of buy or sell trade if hit then we have to book profit
.If price goes below 2nd D 21.4% to 23.6% range then early traders can make fresh reversals trade after breaking 1st D 11.4% safe traders can reversal trade after breaking Point D 21.4% to 23.6% range
Targets :
Target T1 : 35.1% to 38.3%
Target T3 : 49.1% to 53.2%
T3: 60.9% to 64.8% is our 3rd Target since this is reversal zone so must book profit if break then take fresh trade again
Target T4 : 76.4% to 79.7%
Next Targets are 100% , 127.2% ,141.4% and final Target 161.8%.
How to take reversal trade :
If price going upside/ downside then then buy or sell levels appear on Chart ( Automatically show when price reach any reversal zone of harmonic projection pattern based .
After showing reversal levels wait for confirmation until 21.4% or 28.3 % level not break if break then exit from current buy / sell trade and take fresh reverse trade buy/ sell .
Trailing SL:
After reach 1st Target trail SL to just above or below cost ( for example we are holding sell trade from 100 1st Target 110 hit then move trailing sl to 104-105 and move SL as price move upside or Downside)
Re- Entry :
For Re-entry in any pull back Point D ( 11.4% ) is used for re-entry then SL recent high or low Point SL ( 0% ) .
Blue Line is 1st support/ Resistance
Green line is 2nd support/ resistance
Red line is 3rd Support/ resistance

BTCBTC appears to be forming a bullish AB=CD pattern. The key support level is at **$79,940**, while resistance is seen at **$81,765**. If BTC remains above **$79,940**, it could continue its bullish momentum. However, a break below this support may trigger further declines.
In the event of a downside move, the next targets could be **$78,724**, **$77,772**, **$76,560**, and **$73,059**. Traders should monitor price action around support and resistance levels to confirm potential trends. A sustained move above resistance could indicate further bullish strength, while a breakdown below support may lead to deeper corrections.
Risk management is crucial, as volatility remains high. Setting stop-loss orders and watching for confirmation signals can help in making informed trading decisions. Keep an eye on market sentiment and external factors, such as macroeconomic events, which could influence BTC's price movement.BTC appears to be forming a bullish AB=CD pattern. The key support level is at **$79,940**, while resistance is seen at **$81,765**. If BTC remains above **$79,940**, it could continue its bullish momentum. However, a break below this support may trigger further declines.
In the event of a downside move, the next targets could be **$78,724**, **$77,772**, **$76,560**, and **$73,059**. Traders should monitor price action around support and resistance levels to confirm potential trends. A sustained move above resistance could indicate further bullish strength, while a breakdown below support may lead to deeper corrections.
Risk management is crucial, as volatility remains high. Setting stop-loss orders and watching for confirmation signals can help in making informed trading decisions. Keep an eye on market sentiment and external factors, such as macroeconomic events, which could influence BTC's price movement.

BTC/USD Breakdown! Bearish Target: $78K🔍 BTC/USD 30-Minute Chart Analysis
📉 Market Structure:
The chart displays an ABCDE corrective pattern, likely a descending wedge or contracting triangle, which has now broken to the downside.
Price action shows a breakout below the wedge, leading to further bearish momentum.
The 200-period moving average (red line) is acting as resistance, reinforcing the downward trend.
📊 Current Price: ~$83,057
🔻 Bearish Target: $78,049 (marked as the potential support level)
🛑 Key Observations:
Rejection from wave E indicates a lack of bullish strength.
Lower highs and lower lows confirm a continuation of the bearish trend.
Potential retest of ~$85,000 before dropping further.
🚀 Trading Insights:
Bearish Bias: Short opportunities on pullbacks toward resistance.
Bullish Reversal? Look for price action near $78,049—if buyers step in, a potential bounce could occur.
⚠️ Watch out for:
Sudden Bitcoin volatility (news-driven moves).
A fake breakdown (if buyers reclaim above ~$85,000).
