BITCOIN BREAKING ZONEHere i am trying to show you all levels where bitcoin taken support/resistance which is marked as fib level and you can follow green/red arrow as well.
another marking is orrange arrow which is marked to show you fib level and breaking zone.
having seen you have to decide what to do but my view is bearish if it will get sustained otherwise may revert to zone.
todays candle is signal candle. voilet color line showing zone.this is not my buy/sell call please keep in mind.
BTCMINI trade ideas

Bitcoin/USD, Big Bullish Pattern Bitcoin/USD just completed its target of previously formed triangle pattern. Another Trend Continuation pattern is observed in the form of Inverted Head & Shoulder (took 4-5 years), I am counting on the pattern as there is a visible breakout and retest of neckline, target on the log chart coming around 290900. This target will take time and some more smaller patterns will form during the journey to reach its destination. Bitcoin/USD is good to buy on a downside or on a key support.
I will keep updating the Bitcoin/USD chart and will keep informing. There are more interesting things are taking place on the linear chart, I will share the linear chart another time.

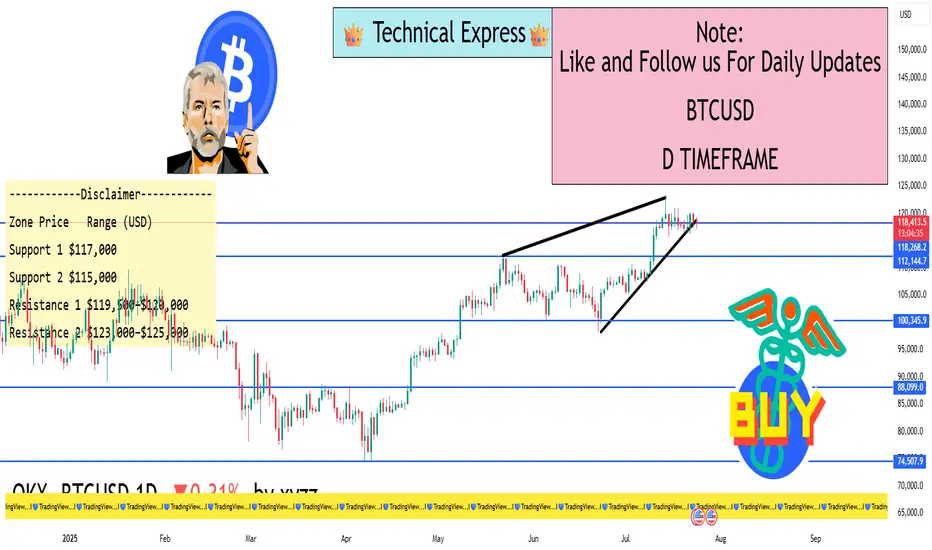
BTCUSD 1D Timeframe✅ Current Market Data
Current Price: ~$118,420 USD
Day’s High: ~$119,210
Day’s Low: ~$117,428
Previous Close: ~$118,004
Change Today: +$416 (around +0.35%)
📈 Price Behavior Today
Bitcoin is showing range-bound movement between $117K and $119K after a strong rally in the past few days.
The current price action suggests market indecision, with neither bulls nor bears taking clear control.
Momentum indicators are neutral, with RSI hovering around 52–55, indicating sideways consolidation.
🧠 Key Drivers Behind Price Action
Profit Booking: After recent rallies above $120K, traders are taking profits, keeping the price in check.
Strong Institutional Demand: ETFs and institutional buying continue to offer long-term support to Bitcoin.
Favorable Crypto Regulations: Recent developments in U.S. crypto policies are boosting confidence in Bitcoin as a store of value.
On-Chain Strength: Network health (hash rate, wallet activity, HODL behavior) remains strong, signaling long-term bullishness.
🔍 Technical Levels to Watch
Zone Price Range (USD)
Support 1 $117,000
Support 2 $115,000
Resistance 1 $119,500–$120,000
Resistance 2 $123,000–$125,000
A close above $120K could initiate a bullish breakout targeting $125K–$130K.
A fall below $117K may invite a deeper pullback toward $115K or even $111K in the short term.
🔄 Market Sentiment
Neutral-to-Bullish in the short term.
Strong Bullish in the long-term due to adoption, policy support, and demand.
Investors are cautiously optimistic, awaiting stronger volume and breakout confirmation.
🎯 Outlook Ahead
Short-Term View: Consolidation between $117K–$120K likely to continue unless a strong volume breakout occurs.
Medium-Term View: A confirmed move above $120K may push BTC toward new highs of $130K–$138K.
Risk Zone: If Bitcoin fails to hold $115K, it could enter a corrective phase down to $111K.
✅ Summary
Bitcoin is currently in a sideways consolidation phase, with strong support around $117K and resistance just below $120K. The broader outlook remains positive, but the market is waiting for a fresh trigger—either a breakout above $120K or a breakdown below $115K—for the next decisive move.
Advance Option Trading💡 Why Advance Option Trading?
While beginner traders focus on price movement, advanced traders focus on:
Time decay (theta)
Volatility (vega)
Delta hedging
Neutral or range-bound markets
Income generation through spreads and option writing
This style of trading provides better capital efficiency, defined risk, and consistent performance across all market conditions (bullish, bearish, or sideways).
2. Implied Volatility (IV)
Higher IV = Expensive options
Lower IV = Cheap options
Key for strategies like IV Crush, Calendar Spreads, or Vega-neutral plays
3. Volatility Smile/Skew
Institutions track which strikes have higher IV. Advanced traders position accordingly.
🔧 Common Advanced Strategies
✅ 1. Straddle & Strangle (Neutral Volatility Strategy)
Straddle: Buy/Sell ATM Call + Put
Strangle: Buy/Sell OTM Call + Put
Use when expecting big movement or no movement (based on IV)
✅ 2. Iron Condor (Range-Bound Strategy)
Sell OTM Call and Put, Buy further OTM Call and Put (as hedge)
Best for sideways markets
Generates consistent income with limited risk
✅ 3. Calendar Spread (IV-Based Strategy)
Sell near-expiry option and buy same strike of a later expiry
Profits from increase in IV and time spread
✅ 4. Butterfly Spread (Limited Risk Strategy)
Example: Buy 1 OTM Call, Sell 2 ATM Calls, Buy 1 ITM Call
Small risk and good reward if price stays within expected range
✅ 5. Ratio Spread
Sell more options than you buy (e.g., sell 2 OTM Calls, buy 1 ITM Call)
Advanced version of directional bet with built-in hedge
✅ 6. Delta Neutral / Gamma Scalping
Balancing option position so that price movement doesn’t affect value
Common in institutions for high-frequency trading
📈 How to Select Right Strategy
✅ Identify Market Trend: Bullish, Bearish, Sideways
✅ Measure IV: Is it high or low?
✅ Track OI (Open Interest): Where are institutions positioning?
✅ Calculate Risk-to-Reward: Does your strategy offer good payoff?
✅ Time to Expiry: Shorter expiry = faster theta decay
⚠️ Risk Management in Advanced Option Trading
Professional traders always:
Set max loss per trade (usually <2% of capital)
Use hedged strategies (never naked short)
Adjust positions if the market breaks range
Keep an eye on Greeks changing with time
Track IV movement before entering trades
📊 Tools Used by Advanced Option Traders
Tool Purpose
Option Chain + OI Analysis Track smart money activity
Greeks Calculator (Sensibull, Opstra) Real-time risk data
IV Charts & Skew Analysis Measure volatility pricing
Backtesting Engines Validate strategies over past data
Algo Execution Tools Automate multi-leg strategies
🧠 Institutional Tactics in Advanced Option Trading
Institutions and prop firms often:
Build delta-neutral portfolios
Sell options with high IV and buy protection
Trade around key levels (VWAP, ATR ranges)
Use gamma scalping for directional bias
Exploit retail option traps near expiry
🔁 Adjustment Techniques (When Trade Goes Wrong)
Rolling the Position – Move strikes up/down or to next expiry
Convert into Ratio Spreads or Butterfly
Hedge with Futures
Close partially and rebalance
Switch to opposite bias if directional conviction is lost
💼 Who Should Learn Advanced Option Trading?
Traders already familiar with basic Calls & Puts
Intraday or swing traders wanting consistency
People managing 6- or 7-figure capital
Option sellers who want defined risk strategies
Anyone seeking market-neutral strategies for steady income
🔚 Final Thoughts
Advanced Option Trading is not about taking more trades — it's about trading smarter, with risk-managed, probability-based setups. When you learn how to use Greeks, volatility, and structure trades, you gain a huge edge over emotional retail trading.


Cryptocurrency Day Trading🧠 What is Cryptocurrency Day Trading?
Day trading means buying and selling crypto coins within the same day — sometimes within minutes or hours — to profit from small price movements.
You don’t hold positions overnight. The goal is to enter and exit quickly, catch a few percent in price movement, and repeat.
Examples of popular cryptos for day trading:
Bitcoin (BTC)
Ethereum (ETH)
Solana (SOL)
Ripple (XRP)
Pepe, Shiba Inu (Meme Coins)
New trending tokens (like AI or gaming-based tokens)
These coins can move 5% to 50% or more in a single day — that’s what makes day trading so attractive!
📊 Why People Love Crypto Day Trading
24/7 Market Access
Unlike stock markets, crypto never sleeps.
You can trade anytime, even late at night.
Volatility = Profit Potential
Crypto prices move wildly.
More movement = more chances to make money.
Low Barrier to Entry
You can start with $10 or $100.
No big capital or licenses required.
Leverage Options
Platforms like Binance, Bybit, and KuCoin offer leverage (e.g., 5x, 10x, 50x).
This can amplify profits (but also increase risk!).
Fast Results
Unlike long-term investing, day trading gives instant feedback.
You know within hours if you’re winning or losing.
⚙️ How Crypto Day Trading Works (Simple Explanation)
Let’s say you’re watching SOLANA (SOL) today.
Price is moving between $75 and $80.
You notice a pattern: Every time it touches $75, it bounces back up.
So you buy at $75, wait for a small move to $77, and sell.
You just made a 2.6% gain.
Now imagine doing that multiple times in a day, or with larger capital. That’s the basic idea.
🎯 Key Strategies Used in Day Trading
Let’s explore the most common (and effective) strategies in simple language:
1. Scalping
Fastest form of trading.
Holding a coin for seconds to a few minutes.
Goal: Catch tiny moves — 0.5% to 1% — many times a day.
🛠️ Tools: 1-minute or 5-minute chart, high volume coins, tight spreads.
2. Breakout Trading
Price builds up like pressure, then breaks out of a level.
Traders watch for resistance breakout or support breakdown.
After breakout, price usually moves quickly — giving fast trades.
🧠 Tip: Watch key levels and volume spike during breakout.
3. Range Trading (Buy Low, Sell High)
When price stays inside a box or zone.
Traders buy at the bottom of the range and sell at the top.
Simple but powerful when done right.
📌 Use on sideways markets. Works great with RSI (Relative Strength Index).
4. News-Based Trading
Crypto reacts quickly to news (good or bad).
For example: If Bitcoin ETF gets approved → Price jumps.
Traders jump in right after big news and ride the wave.
⚠️ Be careful — fake news can also move markets quickly.
🛠️ Must-Have Tools for Day Trading Crypto
TradingView – Best for charts and indicators.
Binance / Bybit / KuCoin – Major exchanges with good liquidity.
CoinMarketCap / CoinGecko – Track coins, market caps, news.
Twitter / Telegram / Discord – Stay updated on trending tokens.
Stop Loss & Take Profit Tools – Crucial for risk control.
📉 Risk Management – The Life Jacket of a Day Trader
Here’s the truth: Without good risk management, you will lose money — even if your strategy is good.
Here are golden rules:
✅ Never risk more than 1-2% per trade
✅ Always use a stop loss
✅ Don’t chase the market
✅ Don’t trade with emotions
✅ Keep a trading journal
Example: If you have $1000, don’t risk more than $20 on one trade.
😰 Common Mistakes (And How to Avoid Them)
❌ Overtrading
Trying to take too many trades in one day. Your brain burns out.
👉 Take only high-quality setups. Less is more.
❌ No Plan
Trading based on “gut feeling” is gambling.
👉 Always have an entry, stop loss, and target.
❌ Revenge Trading
You lost money — now you're trying to “win it back” emotionally.
👉 Take a break. Come back with a clear head.
❌ Ignoring Risk
Using 20x leverage on meme coins without a stop loss is financial suicide.
👉 Respect the risk or the market will humble you.
🤖 Can You Use Bots or AI?
Yes, many day traders use trading bots or AI assistants to:
Scan for signals
Enter/exit trades automatically
Apply indicators faster
But remember: Bots don’t guarantee profit. You still need logic and supervision.
🧘♂️ Mindset of a Successful Day Trader
The best traders treat trading like a business, not a game.
They are:
Disciplined
Patient
Data-driven
Emotionally stable
Focused on long-term performance, not just daily wins
They don’t chase hype — they follow the process.
💼 Can You Make a Living from Crypto Day Trading?
Yes, but not easily. It takes:
Skill
Discipline
Capital
Experience
Most beginners lose money in the first 3–6 months. That’s normal. But with proper learning, journaling, and strategy, it is possible to be consistently profitable.
📌 Final Thoughts: Is It for You?
Crypto day trading is exciting, fast-paced, and potentially very profitable — but also risky and demanding.
Pros:
High income potential
No 9–5 job
Remote, flexible lifestyle
Cons:
High risk
Mentally exhausting
Emotionally draining
Steep learning curve
If you love analyzing charts, making quick decisions, and have emotional control — this might be for you.
But if you’re not ready for the pressure, consider swing trading or investing instead.
✅ Bonus Tip:
Start with paper trading (demo mode) or trade small amounts before risking big money. Focus on mastering one strategy first before learning ten things at once.

BTCUSD 1D TIMEFRAME🔍 What's Driving Bitcoin Today
Institutional Adoption Increasing
Major financial institutions — hedge funds, asset managers, corporate treasuries — are heavily investing in Bitcoin. Dedicated crypto prime brokers are stepping up to serve these clients, signaling a growing institutional footprint.
Stable Institutional Holdings
While Bitcoin has touched record highs, recent dips reflect profit-taking rather than panic. That’s healthy consolidation, not a crash.
Regulatory Tailwinds in the U.S.
New laws (like the “Genius” and “Clarity” Acts) are clarifying the status of stablecoins and digital assets, boosting confidence. Political support from the current administration has incentivized institutional participation and even the creation of a national Bitcoin reserve.
Technical Patterns Suggesting Continuation
Bitcoin appears to be forming a bullish flag or pennant consolidation near the $118K–$120K level — suggesting a likely continuation toward $140K–$250K, depending on momentum and catalysts.
🧭 Market Outlook
Short-Term: Slight consolidation or mild pullback (common after sharp rallies). Key support zones are $115K–$118K. A bounce here may drive prices back toward $120K–$123K.
Mid-Term: If bulls hold momentum and institutional inflows persist, the next major upside targets are in the $140K–$200K range.
Long-Term: With long-term models and institutional forecasts in play, targets stretch as high as $250K by year-end, and some ultra-bullish scenarios envision even $500K+ over a longer time horizon.
⚠️ Key Risks to Watch
Breakdowns below $115K could trigger a deeper correction toward $112K–$110K.
Volatility spikes may occur if macroeconomic factors shift, even as regulatory clarity improves.
Caution from macro critics: Some thought leaders warn of bubble-like conditions, advising risk management.
✅ Summary
Bitcoin remains in a strong bull phase. Today's dip is healthy consolidation after reaching all-time highs. Key support sits between $115K–$118K. A sustained bounce from here could drive a move to $120K–$140K, potentially even higher if institutional flows stay strong. However, a breakdown below that support zone would flip the outlook to neutral or slightly bearish.

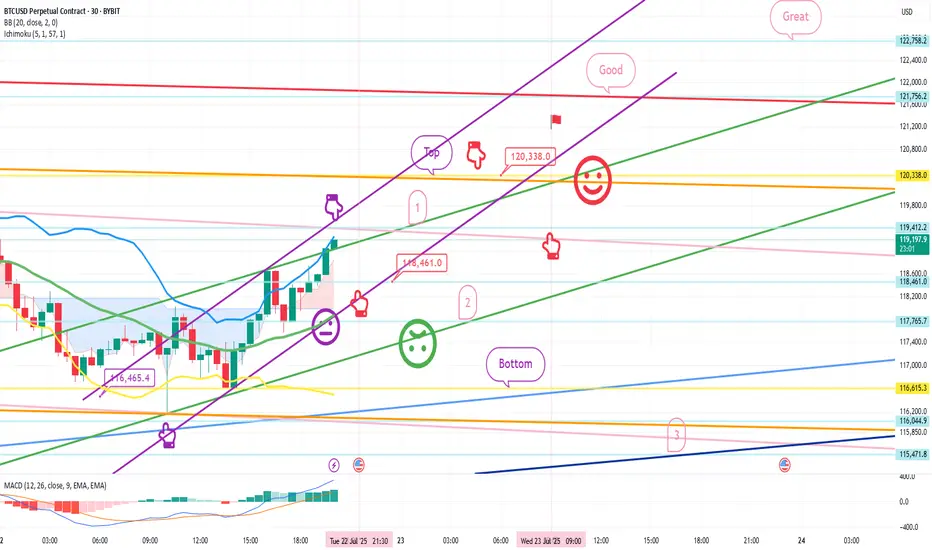
Bitcoin Bybit chart analysis July 22Hello
It's a Bitcoin Guide.
If you "follow"
You can receive real-time movement paths and comment notifications on major sections.
If my analysis was helpful,
Please click the booster button at the bottom.
This is Bitcoin's 30-minute chart.
Nasdaq indicators will be released at 9:30 in a little while.
Although Bitcoin's mid-term pattern is broken,
it looks like a strong upward trend based on signals and candlestick positions.
In the case of Nasdaq, the 6-hour and 12-hour charts MACD dead cross is in progress,
and even if there is no plunge and only a sideways movement,
it seems likely that today's strategy will be successful.
In the bottom left, from the analysis article on the 18th,
the final long position entry point of $116,465.4 Bottom
is connected as is.
*Red finger movement path
One-way long position strategy
1. $118,461.9 long position entry section / green support line breakout, stop loss price
2. $120,338 long position 1st target -> Good, Great in order of target price
See the 1st section at the top as a touch section for an upward wave rather than a short position entry,
and if this section breaks through right away, an upward trend can be connected.
If the purple parallel line support line is maintained without breaking away,
there is a possibility of a vertical rise.
If the top section is touched,
after the first liquidation,
it would be good to use the 1st section to re-enter a long position.
The 2nd section at the bottom is important,
and if it is pushed to this section according to the movement of Nasdaq today,
it can fall strongly.
Please check the real-time support line shape.
From the breakout, Bottom -> 3 sections are open.
If you touch the 3rd section after tomorrow, the mid-term pattern will be restored.
This is the 12+ day section.
Up to this point, I ask that you simply use my analysis for reference and use only.
I hope that you will operate safely with the principle of trading and stop loss.
Thank you.
Technical ClassA Technical Class for Trading is a structured learning program that helps aspiring traders understand how to analyze financial markets using technical analysis. Unlike guessing market movements or relying on news, technical analysis is a science of price behavior, built on charts, patterns, indicators, and market psychology. This class is essential for anyone who wants to become a self-reliant trader in stocks, options, futures, forex, or crypto.
✅ What You Learn in a Technical Trading Class
A good technical trading class teaches how to analyze price action, spot trading opportunities, and apply disciplined risk management. Here’s what’s typically covered:
📈 1. Introduction to Technical Analysis
What is Technical Analysis?
Difference between Technical and Fundamental Analysis
Importance of studying price action and volume
Types of traders: Day Trader, Swing Trader, Positional Trader, Scalper
🕯️ 2. Candlestick Chart Reading
Candlestick charts tell stories of price movement and trader psychology.
You'll learn:
Structure of a candlestick (open, high, low, close)
Key single candlestick patterns (Hammer, Doji, Marubozu)
Dual & triple patterns (Engulfing, Morning Star, Evening Star)
How to use candles to detect reversals or continuations
📊 3. Chart Types and Timeframes
Line chart vs Bar chart vs Candlestick chart
Timeframe selection for different trading styles:
Intraday (5 min, 15 min)
Swing (1 hour, 4 hour)
Positional (Daily, Weekly)
📌 4. Support and Resistance
What are support and resistance levels?
How to identify major levels using price action
Role of psychological round numbers
Breakouts and false breakouts
How to use them for entry, exit, and stop-loss
📉 5. Trend Analysis
Understanding the direction of the market is critical.
You will learn:
How to spot uptrends, downtrends, and sideways markets
How to draw trendlines correctly
Using price structure: Higher Highs / Higher Lows
Tools like Moving Averages to confirm trends
📐 6. Chart Patterns
Chart patterns help forecast future moves.
Key patterns covered:
Reversal Patterns: Head & Shoulders, Double Top/Bottom
Continuation Patterns: Flags, Pennants, Triangles
Breakout strategies and volume confirmation
⚙️ 7. Technical Indicators
Indicators help confirm entries and manage trades.
Most-used indicators:
Moving Averages (SMA/EMA)
Relative Strength Index (RSI)
MACD (Moving Average Convergence Divergence)
Bollinger Bands
Volume analysis
How to combine indicators for smarter entries
⏳ 8. Time, Volume & Volatility
Importance of volume spikes
Volatility analysis for risk management
Understanding market sessions and timing your trades
🎯 9. Risk Management
This is where most traders fail. A technical class teaches:
How much to risk per trade (1–2%)
Risk-to-reward ratios
Where to place a stop-loss
How to avoid revenge trading
Capital preservation first, profit later
🧠 10. Trading Psychology
Handling emotions: Greed, Fear, Impatience
Importance of discipline and patience
Building confidence through planning
Developing a trading journal and sticking to rules
⚡ 11. Practical Strategy Building
The real power of a technical class lies in combining all the knowledge to build strategies:
Trend-following strategy
Reversal setups
Breakout/breakdown trades
Momentum-based trades
Intraday vs swing setups
📚 Benefits of Joining a Technical Class
Learn systematic trading instead of gambling
Avoid common beginner mistakes
Practice through live market examples
Prepare to move toward professional-level trading
Save time by learning from expert mentors
🔎 Who Should Take a Technical Class?
Aspiring full-time or part-time traders
Stock market beginners
Intraday traders, swing traders, or positional investors
Option traders who want to improve timing
Anyone who wants clarity and structure in their trading
📌 Final Thoughts
A Technical Class for Trading is not just about indicators and charts. It’s about learning a structured, rule-based approach to understanding the market. It empowers you to make trading decisions confidently and helps you grow from a beginner to a skilled, strategy-driven trader.
Whether you’re trading stocks, Bank Nifty, Nifty50, or even crypto — technical analysis is your foundation. Learn it well, practice with discipline, and your chances of success in the markets will dramatically improve.

BTCUSDT – Uptrend Remains IntactBitcoin is undergoing a mild pullback after breaking out to a recent high near 120,000 USD. The price is currently consolidating within a price box ranging from 112,325 to 120,016 USD – a healthy pause before a potential continuation of the bullish trend.
The key support zone lies at 112,325 USD (Fibonacci 0.618), which could act as a launchpad if retested. Should buying pressure clearly re-emerge at this level, BTC may resume its upward trajectory and aim for the 1.618 Fibonacci extension at 132,459 USD.

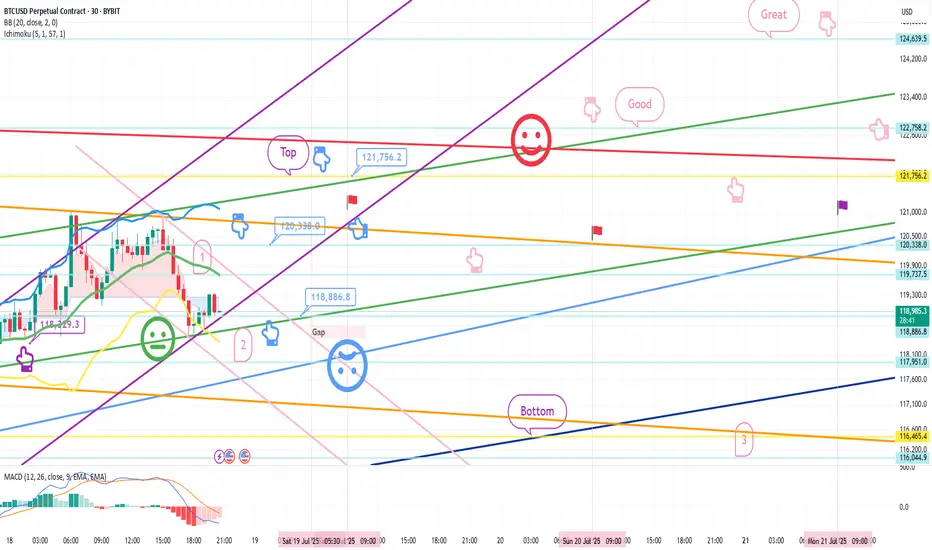
Bitcoin Bybit chart analysis July 18
Hello
It's a Bitcoin Guide.
If you "follow"
You can receive real-time movement paths and comment notifications on major sections.
If my analysis was helpful,
Please click the booster button at the bottom.
Bitcoin 30-minute chart.
There is no Nasdaq indicator announcement today.
The mid-term pattern was broken in the morning wave,
but I proceeded as safely as possible.
At the bottom left, I connected the final long position switching section in the analysis article on the 15th with a purple finger.
*When the blue finger moves,
Bidirectional neutral
Short->Long or long waiting strategy
1. Short position entry section of $120,338 / Stop loss price when orange resistance line is broken
2. Long position switching of $118,886.8 / Stop loss price when blue support line is broken
3. Long position 1st target of $121,756.2 -> Target price in the order of Good and Great
If it falls immediately from the current position or
touches the top once and falls, it is a vertical decline condition.
If it falls immediately, it is the final long waiting in section 2.
(When the sky blue support line breaks, the stop loss price is the same)
From the sky blue support line break, the 6+12 section is where the mid-term pattern is restored,
and it is roughly the bottom section.
If the strategy is successful, I have left a simulation with a pink finger on the right,
so please check the switching and profit-taking section,
and operate safely in each position, long, short, and no position, based on whether the purple support line breaks from the current position.
From the green support line break, the low point of today's daily candle is broken,
so it would not be good for a long position, right?
Up to this point, please use my analysis article only for reference and use,
and operate safely with principle trading and stop loss price.
Thank you.
Advance Option Trading📊 Advance Option Trading – Complete Professional Guide
Advance Option Trading focuses on mastering professional-grade strategies that go beyond simply buying Call and Put options. This approach uses multi-leg strategies, Option Greeks, and volatility analysis to help traders profit in bullish, bearish, sideways, or even volatile and low-volatility markets with better control over risk and reward.
This is how professional traders and institutions trade options — systematically, with probability, and smart risk management.
💡 What is Advanced Options Trading?
In Advanced Options Trading, you learn:
✅ Complex Strategies like Spreads, Straddles, Strangles, Iron Condor
✅ How to combine multiple options in one trade
✅ Reading and using Option Greeks to manage your trades
✅ Analyzing Implied Volatility (IV) to predict market reactions
✅ Managing risk and reward scientifically
🎁 What You Master in Advanced Option Trading
1. Option Greeks
Delta — How much option price moves with the underlying.
Theta — Time decay; how much premium you lose every day.
Gamma — Rate of change of Delta; helps in intraday adjustments.
Vega — Sensitivity to volatility changes.
Rho — Impact of interest rates (minor but useful).
➡️ Professionals use Greeks to adjust their positions and decide when to enter, exit, or hedge trades.
2. Volatility Trading
High IV Strategies → Sell Options (Iron Condor, Credit Spread).
Low IV Strategies → Buy Options (Straddle, Strangle).
IV Crush → Profit from fast drop in implied volatility after events (like earnings/news).
3. Advance Risk Management Techniques
Adjusting trades dynamically as price moves.
Hedging positions when necessary.
Avoiding big losses using proper position sizing.
Managing trades based on Greeks exposure
✅ Benefits of Advanced Options Trading
✅ Predictable Profitability — higher consistency
✅ Works in all market conditions
✅ Controlled Risk, Limited Loss
✅ Higher Win Rate Strategies
✅ Option Greeks help you stay professional
✅ Volatility analysis increases trade accuracy
📝 Who Should Learn Advanced Options Trading?
✅ Traders who know basics and want more control
✅ Those interested in hedging and capital protection
✅ Swing or positional traders wanting steady income
✅ Intraday traders aiming for high probability setups

BTCUSD | 15-Min Chart SetupBitcoin has successfully broken out of the ascending triangle pattern after consolidating near the resistance zone around $118,800. This pattern generally indicates bullish continuation, and today’s breakout confirms the strength of buyers at this level.
🔹 Pattern: Ascending Triangle
🔹 Entry: Around $118,887 (post-breakout)
🔹 Stop-Loss: Below $118,000
🔹 Target: $119,700+ (based on measured move of the triangle)
Price action is showing a retest of the breakout zone, which could act as a solid support base for the next leg up. If this level holds, BTC could rally further in the short term.

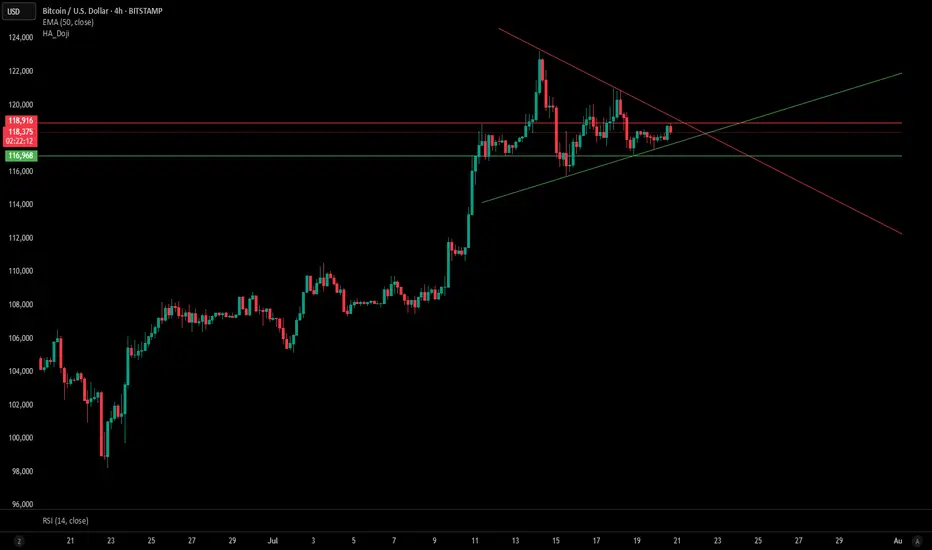
BTC/USD – Symmetrical Triangle Forming | Key Breakout Zone nearBitcoin is currently consolidating within a symmetrical triangle pattern on the 4H chart, with both trendlines converging toward a decision point. Price is hovering just below the resistance line (~$118,900) and holding above key support at ~$116,968.
📊 Key Levels:
Resistance: $118,916 (triangle top / horizontal resistance)
Support: $116,968 (horizontal support)
EMA 50 (4H): $117,550 – currently acting as dynamic support
📉 RSI (14): Hovering near 50, indicating neutral momentum — awaiting confirmation of breakout direction.
A breakout above the descending trendline could trigger bullish momentum, while a break below the rising support may indicate further downside. Watch for volume confirmation on the breakout.
Target Hit in 6BTC/USDhe BTC/USD pair represents the exchange rate between Bitcoin, the world’s most popular cryptocurrency, and the US dollar. It is one of the most actively traded cryptocurrency pairs in the world. BTC/USD attracts traders because of Bitcoin’s volatility and the liquidity of the US dollar, offering ample opportunities for profit.
Trading BTC/USD involves buying Bitcoin when traders expect its price to rise relative to the dollar, or selling (shorting) it when they anticipate a decline. Many platforms and exchanges allow both spot trading and derivative trading, such as futures or contracts for difference (CFDs), to capitalize on price movements in both directions.
One of the key challenges in BTC/USD trading is managing volatility. Bitcoin prices can swing by several percent within minutes due to market sentiment, regulatory news, or large transactions by whales. This makes risk management strategies—like stop-loss orders and position sizing—crucial for traders.
Technical analysis is commonly used to identify trends, support and resistance levels, and momentum. On the other hand, macroeconomic factors and Bitcoin-specific news often drive price moves as well.
Overall, BTC/USD remains a favorite for both short-term traders seeking volatility and long-term investors betting on Bitcoin’s potential growth against fiat currencies.
TARGET HIT BTC/USD WAIT FOR 9
HOURS

BTC/USD Today, I executed a trade on the BTC/USD pair based on technical analysis and current market sentiment. Bitcoin continues to show volatility, offering both opportunity and risk. After evaluating the market structure and considering key support and resistance levels, I found a favorable setup to enter the market.
My entry point was carefully chosen after observing a consolidation pattern near a significant support zone. Price action showed signs of accumulation with bullish divergence on the RSI, and volume supported the possibility of an upward breakout. This suggested that buyers were gradually stepping in, which gave me confidence to open a long position.
In addition to technical signals, I kept an eye on fundamental news. There were no negative headlines about regulation or institutional withdrawals, which helped maintain a bullish bias. Moreover, the U.S. dollar index (DXY) showed signs of weakening, which historically benefits BTC/USD trades, as Bitcoin often strengthens when the dollar loses ground.
I set a clear stop-loss to manage risk, slightly below the previous swing low. Risk management is crucial in crypto due to its unpredictable nature. For my take-profit level, I aimed near a recent resistance where price previously reversed, ensuring a good risk-to-reward ratio.
During the trade, I stayed updated with 1-hour and 4-hour charts to monitor momentum and volume. As price approached my target, I trailed my stop to lock in some profit while allowing for further upside if momentum continued. Thankfully, the move played out in my favor, and I was able to secure a solid profit.
What I learned from this trade is the importance of patience and discipline. Waiting for confirmation, rather than jumping in too early, made the difference. I also reinforced my belief in sticking to a trading plan and not reacting emotionally to market noise.
Overall, I’m pleased with how this BTC/USD trade unfolded. It reminded me of the importance of balancing technical indicators, market sentiment, and sound risk management. I’ll continue analyzing price action closely and stay adaptive to market shifts in the days ahead.

BTC/ USD Live Chat.BTC/ USD TARGET
Today, I executed a trade on the BTC/USD pair based on technical analysis and current market sentiment. Bitcoin continues to show volatility, offering both opportunity and risk. After evaluating the market structure and considering key support and resistance levels, I found a favorable setup to enter the market.
My entry point was carefully chosen after observing a consolidation pattern near a significant support zone. Price action showed signs of accumulation with bullish divergence on the RSI, and volume supported the possibility of an upward breakout. This suggested that buyers were gradually stepping in, which gave me confidence to open a long position.
In addition to technical signals, I kept an eye on fundamental news. There were no negative headlines about regulation or institutional withdrawals, which helped maintain a bullish bias. Moreover, the U.S. dollar index (DXY) showed signs of weakening, which historically benefits BTC/USD trades, as Bitcoin often strengthens when the dollar loses ground.
I set a clear stop-loss to manage risk, slightly below the previous swing low. Risk management is crucial in crypto due to its unpredictable nature. For my take-profit level, I aimed near a recent resistance where price previously reversed, ensuring a good risk-to-reward ratio.
During the trade, I stayed updated with 1-hour and 4-hour charts to monitor momentum and volume. As price approached my target, I trailed my stop to lock in some profit while allowing for further upside if momentum continued. Thankfully, the move played out in my favor, and I was able to secure a solid profit.
What I learned from this trade is the importance of patience and discipline. Waiting for confirmation, rather than jumping in too early, made the difference. I also reinforced my belief in sticking to a trading plan and not reacting emotionally to market noise.
Overall, I’m pleased with how this BTC/USD trade unfolded. It reminded me of the importance of balancing technical indicators, market sentiment, and sound risk management. I’ll continue analyzing price action closely and stay adaptive to market shifts in the days ahead.

Support and Resistence Part-2✅ The True Meaning of Support and Resistance
At the core, support and resistance levels are psychological price areas where supply and demand dynamics shift. However, in institutional trading, these levels are engineered by large players to trigger retail reactions — such as false breakouts, stop hunts, and liquidity grabs.
Institutions use these levels to:
Accumulate large positions without moving the market.
Manipulate price to create breakout traps.
Trigger liquidity pools where retail stop-losses and pending orders are stacked.
✅ Types of Advanced Support and Resistance
1. Liquidity-Based Zones
Institutions seek liquidity to fill their large orders. They target zones where retail traders:
Place stop losses.
Have pending buy/sell orders.
Expect breakout continuations.
These zones are rarely clean horizontal lines but broader zones where price can spike in and quickly reverse.
2. Order Blocks
Order blocks are the last bullish or bearish candles before a significant price move caused by institutional orders. These are key institutional support/resistance levels where price often returns for mitigation or re-entry.
Bullish Order Block = Support Zone
Bearish Order Block = Resistance Zone
3. Breaker Blocks
When support breaks and flips to resistance (or vice versa), institutions often retest breaker blocks to add positions or induce liquidity.
4. Fibonacci Confluence Zones
Advanced traders use Fibonacci retracement and extension levels in combination with support and resistance zones to identify high-probability trade setups. Common levels like 61.8% and 78.6% often align with key order blocks.
5. Dynamic Support & Resistance (Moving Averages, VWAP)
Institutions monitor:
200 EMA/SMA on higher timeframes as dynamic resistance/support.
VWAP (Volume Weighted Average Price) as an institutional support/resistance during intraday moves.
These dynamic levels often act as price magnets during trend days.
✅ Institutional Manipulation Around Support/Resistance
🔹 Liquidity Grabs (Fake Breakouts):
Price breaks a key level (support or resistance), triggers stops, grabs liquidity, and violently reverses.
Common in forex, indices, and crypto markets.
🔹 Stop Loss Hunting:
Institutions drive price into known stop zones to fill large orders cheaply, especially during low-volume sessions.
🔹 Re-Tests and Confirmations:
Professional traders wait for confirmation after breakouts.
A common method: Break – Retest – Continuation setup, especially around higher timeframe support/resistance.
✅ How to Trade Support and Resistance Like an Institution
Mark Zones, Not Lines: Use zones (20-50 pip zones in forex or 1-2% zones in stocks), not fixed lines.
Use Multi-Timeframe Confluence: Identify higher timeframe levels (Daily, Weekly) and trade based on lower timeframe confirmations (M15, M30, H1).
Wait for Confirmations: Avoid blind entries. Wait for:
Rejection Candles (Pin Bar, Engulfing, Doji)
Break of Structure (BOS) or Change of Character (CHoCH) after grabbing liquidity.
Target Imbalance Zones: Combine support/resistance with fair value gaps (FVG) or imbalances where price is likely to revisit.
Track Volume Reaction: Volume spikes at support/resistance zones often indicate institutional activity.
✅ Pro Tips for Mastering Support and Resistance
Never chase price. Let the market come to your zones.
Higher timeframe levels = stronger reaction zones.
Watch for ‘fakeouts’ during news releases – institutions use volatility to create liquidity spikes.
Learn to recognize exhaustion (long wicks, low momentum) after liquidity grabs to confirm reversals.
Institutional levels often align with market sessions – London Open, New York Open tend to respect these zones more than Asian session.
✅ Final Thoughts
At an advanced level, support and resistance aren’t simple price levels — they are strategic zones used by institutions to trap uninformed traders. Once you start recognizing these patterns, you’ll stop reacting emotionally and start anticipating market behavior like a professional. You’ll know when to stay patient, when to avoid traps, and when to capitalize on market inefficiencies with high-probability, low-risk trades.

Sell on riseBtc seems to have entered wave C.
Currently at a good support level.
But could be sold on rises.
Till 119,775 is a good level to take a short position

BTCUSD - Smart Money Trap Before the Next Move?1. Market Structure & BOS (Break of Structure):
We can observe multiple BOS levels around July 10–12, signaling a strong bullish transition.
2. Break of Structure (BOS)
Definition: BOS occurs when price breaks above a previous swing high with conviction.
Application on Chart: The BOS on July 11 marked the continuation of bullish market structure.
This indicated strong buying pressure, often driven by institutional order flow.
📉 3. Fair Value Gap (FVG)
Definition: A Fair Value Gap is an inefficiency or imbalance in the market where price moves too quickly, skipping potential orders.
On Chart: The FVG is present between July 11–12.
Expectation: Price often returns to these zones to “rebalance” or mitigate orders before continuing the trend.
Educational Note: FVGs act as magnet zones and are often used to identify entry points or liquidity pools.
💧 4. Liquidity Sweep
Definition: A liquidity grab occurs when price spikes above a recent high or low to trigger stop-loss orders before reversing.
On Chart: Just above resistance, a liquidity grab took place.
Purpose: Institutions often sweep liquidity before large moves to fill larger orders.
🔹 Resistance & Supply Zone:
The resistance area between 122,150–123,500 has held firmly, causing a notable correction.
This region aligns with institutional order blocks, suggesting potential smart money selling.
🔹 Support & Demand Zone:
The nearest support zone lies at 115,984, marked by previous consolidation and BOS.
Price is likely to revisit this zone, acting as a retest for demand re-entry, providing a strong buy-side opportunity if confirmed.
🔹 Current Price Action:
BTC is consolidating around 119,253, with a possible liquidity sweep above short-term highs.

Bitcoin (BTC/USD) – 1D Timeframe✅ Closing Summary:
Closing Price: ~$119,138 USD
Change: +$836 (+0.7%)
Opening Price: ~$118,302
Intraday High: ~$120,714
Intraday Low: ~$117,715
Bitcoin continued to show resilience by holding above the crucial $118,000 support level, despite facing overhead resistance near its previous high. The price action reflects bullish consolidation following recent surges above $120,000.
🔍 Key Reasons Behind the Price Action:
Institutional Demand Strengthening:
Bitcoin ETFs in the U.S. are witnessing rising inflows.
Hedge funds and family offices are seen increasing allocations, especially as digital assets gain legitimacy post-regulation discussions.
Regulatory Momentum:
U.S. Congress is pushing clearer frameworks around crypto taxation and stablecoins.
Global regulatory certainty (from EU & Japan) boosts confidence among investors and traders.
Weakening U.S. Dollar Index (DXY):
The DXY declined slightly, indirectly aiding BTC’s upward momentum.
Bitcoin remains a favored alternative store of value during fiat uncertainty.
Limited Miner Selling:
On-chain data shows a decline in miner distribution, meaning less sell-side pressure.
Miners seem optimistic about long-term prices and are holding reserves.
📈 Technical Outlook (Short-Term):
Support Zone: $117,500 to $118,000
Price found strong buyers in this range. It’s crucial that Bitcoin holds this level to maintain bullish structure.
Resistance Zone: $120,700 to $122,500
Previous highs around $122K serve as the next resistance. A daily candle close above this may trigger momentum buying.
Indicators:
RSI (Relative Strength Index): ~62 (bullish but not overbought)
MACD: Bullish crossover confirmed
Volume: Moderate, but above 20-day average
📆 Recent Trend Performance:
1-Day Return: +0.7%
1-Week Return: +2.1%
1-Month Return: +12.8%
3-Month Return: +35.4%
YTD Return: +61.2%
Bitcoin continues to outperform traditional asset classes, showing strong long-term growth despite short-term volatility.
🧠 What Traders & Investors Should Know:
Short-Term Traders: Consider range trading between $118K–$122K. Breakout above $122K may signal fresh upside potential.
Swing Traders: Watch for bullish continuation patterns (bull flags or cup-and-handle). Enter long if price closes above $121.5K on high volume.
Long-Term Investors: Accumulation at current levels could be ideal before the next halving cycle and broader adoption via ETFs and institutions.
🛠️ Chart Behavior and Candlestick Analysis:
Candle Type: Bullish candle with long lower wick, indicating buying pressure near support.
Pattern: Minor flag formation with potential breakout above $121K on next daily move.
🧭 Macro-Level Catalysts to Watch:
U.S. Bitcoin ETF weekly flows (Friday updates)
Fed interest rate guidance (next FOMC meeting)
Crypto regulation developments in U.S., EU, and APAC
On-chain metrics: exchange inflow/outflow, whale accumulation
💬 Conclusion:
BTC/USD is showing solid structure in the 1D chart. With strong institutional demand, improving global regulation, and technical support holding, Bitcoin is in a healthy uptrend. The short-term outlook remains bullish as long as BTC holds above $118K. A breakout above $122K could fuel the next leg towards $125,000–$130,000.

Advance Option Trading✅ What is Advanced Options Trading?
At the advanced level, traders use option combinations, multi-leg strategies, and hedging techniques to:
Maximize profits
Minimize risks
Take advantage of market volatility and time decay (Theta)
You don’t just predict direction; you trade direction, volatility, and time decay together.
✅ Core Concepts in Advanced Options Trading
1. Greeks Mastery
Delta: Measures how much the option price moves with the underlying asset.
Gamma: Rate of change of Delta.
Theta: Time decay — how much the option loses value every day.
Vega: Sensitivity to volatility changes.
Rho: Impact of interest rate changes (used less by retail).
Understanding Greeks helps you manage profits and risks more precisely
3. Volatility Trading
Institutions trade implied volatility (IV), not just price direction. Advanced traders use tools like IV Rank and IV Percentile to:
Sell options when IV is high (premium rich)
Buy options when IV is low (cheap options)
4. Hedging Techniques
Use options to protect your portfolio from major losses.
Example: Holding stocks and buying Protective Puts to limit downside risk.
Example: Selling Covered Calls to generate monthly income on stock holdings.
✅ Benefits of Advanced Options Trading
💸 Profit in Any Market Condition (up, down, sideways)
⏳ Earn from Time Decay (Theta Decay)
🛡️ Control Risk with Defined Risk Strategies
🎯 Higher Probability of Consistent Returns
📉 Less Capital, More Leverage
✅ Who Should Learn Advanced Option Trading?
✅ Traders with basic options knowledge
✅ Investors wanting to hedge portfolios
✅ Intraday or positional traders
✅ Those seeking consistent monthly income
✅ Final Thoughts
Advanced Options Trading transforms you from a simple buyer/seller to a strategic trader who uses market forces smartly. You don’t chase trades — you set up calculated, high-probability positions and let the market work for you.

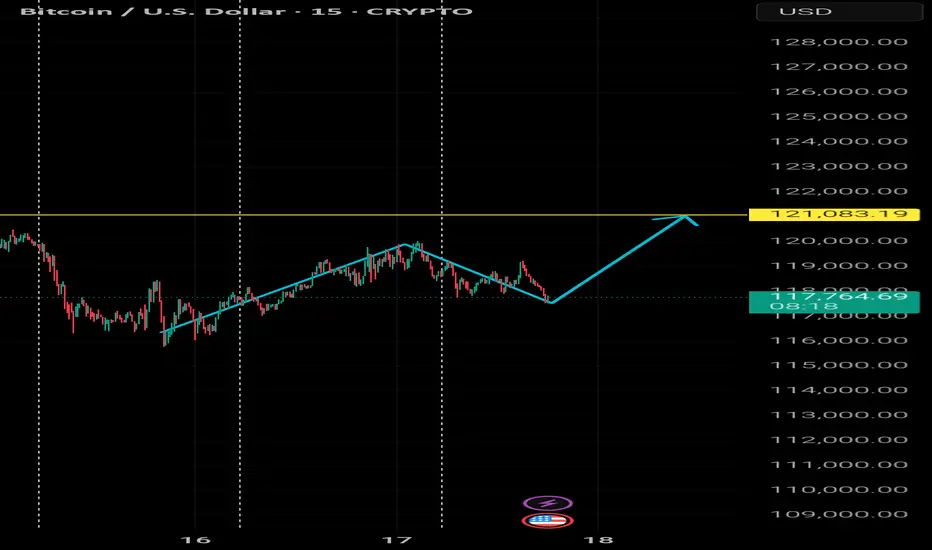
BTCUSD Forming Bullish W Pattern – Targeting 121083In this 15-minute chart of BTCUSD, we can observe a potential bullish reversal pattern forming—commonly referred to as a "W" or double bottom. The price recently retraced from the 119000 zone and found support around 117000, completing the second leg of the pattern.
The structure indicates strong buying interest at lower levels and a possible continuation to the upside. If the pattern completes, we can expect the price to break above the neckline resistance at 119500 and target the next key resistance level at 121083.19, marked by the yellow horizontal line.
Trade Plan:
Entry: Around 117500–118000 (after confirmation of support)
Target: 121083
Stop Loss: Below recent swing low ~116500
Risk-to-Reward: Approximately 1:2+
This setup is valid as long as the price holds above the 116500 level. A break below that would invalidate the bullish structure.