BTCUSD SHOWING A GOOD DOWN MOVE WITH 1:10 RISK REWARD BTCUSD SHOWING A GOOD DOWN MOVE WITH 1:10 RISK REWARD
DUE TO THESE REASON
A. its following a rectangle pattern that stocked the market
which preventing the market to move any one direction now it trying to break the strong resistant lable
B. after the break of this rectangle it will boost the market potential for break
C. also its resisting from a strong neckline the neckline also got weeker ald the price is ready to break in the outer region
all of these reason are indicating the same thing its ready for breakout BREAKOUT trading are follws good risk reward
please dont use more than one percentage of your capitalfollow risk reward and tradeing rules
that will help you to to become a bettertrader
thank you
BTCUSD.P trade ideas

Bitcoin Bybit chart analysis March 4Hello
It's a Bitcoinguide.
If you have a "follower"
You can receive comment notifications on real-time travel routes and major sections.
If my analysis is helpful,
Please would like one booster button at the bottom.
This is the Bitcoin 30-minute chart.
There is no Nasdaq indicator announcement.
In the analysis I left today,
I would be grateful if it moves sideways without breaking the green support line.
Today's two main points of view are
Whether the 12-hour chart MACD dead cross is in progress
and
The Tether Dominance 4-hour chart center line is above
The thin section of the cloud (possibility of a crash).
I thought it would be complicated if I explained it in both directions,
so I approached it very simply.
It is an ambiguous position before the decline in Tether Dominance (tail section when taking a short position in a plunge)
Bitcoin also touched the support line of the 2-hour Bollinger Band chart today
(additional downtrend or sideways section)
Since there was no short position entry position today,
we proceeded with the final sweep (plunge) of Tether Dominance in line with the 12-hour chart MACD dead cross imprint from 9 PM to 9 AM when the 12-hour candle is created.
If you don't understand, please read it repeatedly.
*When the blue finger moves,
it is a short position strategy
short->long switching strategy.
1. $85,584.5 short position entry section / stop loss price when breaking through the pink resistance line
(The pink resistance line section is the center line of the 4-hour Bollinger Band chart based on Tether Dominance,
but since it is the order of the 4-hour chart MACD dead cross and the positive cloud is maintaining thin,
you should be careful because it can rise strongly when breaking through this section.)
2. $80,103 long position switching section / stop loss price when breaking through the blue support line
(A strong rebound before and after breaking through the blue support line is sweeping through Tether Dominance -> a crash condition.)
3. $86,935.5 long position 1st target
-> After the 12-hour chart MACD dead cross is imprinted, the 2nd target price is the top section
Currently, in Tether Dominance, the 6+12 pattern has touched the daily center line, so the mid-term pattern It's broken.
From reaching the top section, continue to maintain a long position
If the condition is Tether Dominance
Based on the recovery of the 12+ daily pattern
You can see the resistance line of the Bollinger Band 12-hour chart -> near the daily central line.
(Here, take profit and final short switching depending on the situation)
If there is no rebound in the bottom section today
You should look at the 2nd section from Gap7 at the bottom
And if it continues to fall, this week's major rebound section
I will organize it again later.
Please use my analysis article for reference and use only
I hope you operate safely with principle trading and stop loss prices.
Thank you.

Bitcoin Fresh Technical Analysis and Price Prediction AnalysisBTC/USDT – Technical Analysis Update
📊 Current Price: ~$93,000
📈 Recent Move: Strong bounce from $79,000, surging $17,000 in just a few hours.
Key Technical Levels & Market Structure
🔸 Resistance Zone: $95,000 – This level acts as a critical supply zone. A strong rejection here may trigger short-term corrections.
🔸 Breakout Confirmation (BOS - Break of Structure): A decisive close above $99,600 with volume could confirm bullish continuation towards new highs.
🔸 Support & Downside Risk:
If BTC fails to hold above $95,000, a pullback towards $75,000-$70,000 remains a possibility.
EMAs & Trendline Support: Watch for dynamic support from 50 EMA & ascending trendline in case of retracement.
Market Outlook:
- BTC remains in a bullish structure, but volatility is high.
- RSI & Volume Analysis: Overbought conditions on lower timeframes suggest possible consolidation before the next leg up.
⚠️ Risk Management: Always trade with stop-loss and avoid overleveraging in this volatile market.
📡 Stay tuned for real-time insights!
Note: NFA & DYOR

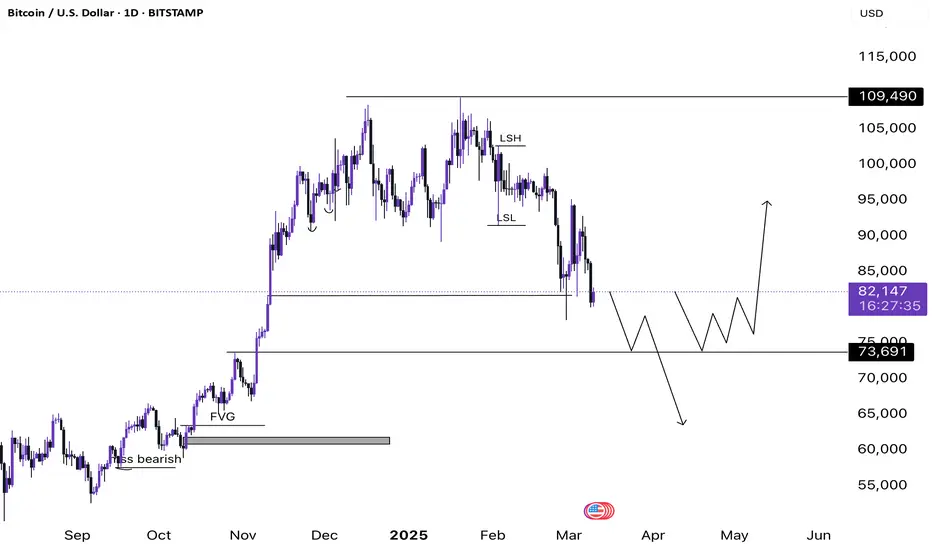
Bitcoin 1D Bear Market Technical Analysis - Bitcoin is currently trading at 82,249$
- Bitcoin has so far erased 24.98% from its All Time Highs and especially after Trump's presidency.
- Market Structure shift looks completely bearish, unless we flip above 96,000$ on a daily timeframe
- We have many inefficiencies left until 73,691$ and I have drawn those paths as well.
- The first path shows price filling the inefficiency and then taking out more liquidity to fall further and clear the fair value gap sitting at about 63,329$
- The second path shows we might not not fall below 73k after filling the inefficiency rather we start building a base before moving towards the upside.
- Market doesn't look good from a structure perspective be very selective when it comes to punching trades.
Raoul Pal’s Investment Edge: The Art of Predicting Market ShiftHello Traders! First of all, no, this is not about me! 😆 I am Rahul Pal , and this is about Raoul Pal , the legendary macro investor! But don’t worry— my time will come too! Until then, let’s take this opportunity to learn from one of the best in the game and explore his key investment principles and strategies that have made him a market icon.
Raoul Pal is not just another investor—he is a master of macro trends who has successfully predicted major shifts in financial markets, global liquidity cycles, and the rise of digital assets. From his early bets on Bitcoin and Ethereum to his deep understanding of monetary policies and their impact on financial markets , his approach has helped thousands of traders and investors navigate volatile conditions and stay ahead of the curve.
So, let’s break down his top investing lessons and see how we can apply them to build wealth, manage risks, and seize big market opportunities!
Raoul Pal’s Key Investment Strategies
Macro Investing Approach – Pal focuses on big-picture economic trends, analyzing global debt cycles, interest rates, and monetary policies to predict major market movements.
Early Crypto Adoption – He was one of the early institutional investors to bet big on Bitcoin and Ethereum, predicting their rise as alternative financial systems.
Liquidity Matters More Than Fundamentals – Pal believes that liquidity in financial markets drives asset prices more than just company fundamentals.
Bet on Big Trends Early – He identified major shifts in technology, crypto, and decentralized finance (DeFi) before mainstream adoption.
Understanding Market Cycles – He studies boom-and-bust cycles to anticipate major economic shifts and position himself accordingly.
Diversification with a Focus on Asymmetry – Pal emphasizes investments with high potential upside and limited downside risks, such as Bitcoin and tech stocks.
Raoul Pal’s Bold Market Predictions
Bitcoin to Reach $1M? – Pal has predicted massive upside potential for Bitcoin, citing global money printing and institutional adoption.
The Rise of Digital Assets – He believes that crypto, NFTs, and tokenized assets will be a major part of the financial future.
US Dollar Liquidity Crisis – Pal has warned about potential economic instability caused by excessive debt and monetary easing.
What Traders Can Learn from Raoul Pal
Follow the Macro Trends – Pay attention to global interest rates, central bank policies, and economic cycles to position yourself ahead of big moves.
Be Open to New Asset Classes – Consider crypto, technology, and emerging financial innovations for long-term wealth creation.
Risk Management is Key – Even with bold predictions, Pal manages risk and focuses on asymmetrical returns.
Adopt a Long-Term Perspective – Major trends don’t happen overnight, so patience is crucial when investing in macro shifts.
Conclusion
Raoul Pal’s macro investing strategies provide valuable insights into navigating global markets, identifying emerging trends, and managing risk effectively. His focus on big-picture thinking has helped him stay ahead of market shifts, making him a legend in the world of investing.
Do you follow macro trends in your trading? Let me know in the comments! 👇

Will Bitcoin going toward $65000 ?#Bitcoin Following Perfectly 🔻
Strong Resistance: $95000 ( Bullish Above )
Strong Support: $70000
CRYPTOCAP:BTC

Bitcoin Trend Precision – Combining VWAP, MACD, and Parabolic SABitcoin’s price moves erratically, making it tough to catch high-probability entries without getting shaken out. But what if you had a system that combines trend strength, momentum shifts, and key price levels to improve accuracy?
This strategy uses:
🔹 VWAP (Volume Weighted Average Price) – The institutional price benchmark for trend direction.
🔹 MACD (Moving Average Convergence Divergence) – To track momentum shifts.
🔹 Parabolic SAR – For trend continuation confirmation.
⸻
📌 How This Strategy Works for BTC Trading
🔹 Step 1: Identify Trend Using VWAP
• Price above VWAP = Uptrend (Look for longs) ✅
• Price below VWAP = Downtrend (Look for shorts) ❌
🔹 Step 2: Use MACD for Momentum Confirmation
• Bullish Setup: MACD crossover happens above 0, and price is above VWAP → Look for a long entry.
• Bearish Setup: MACD crossover below 0, and price is below VWAP → Look for short setups.
🔹 Step 3: Confirm Entry with Parabolic SAR
• If dots flip below price, it’s a strong confirmation for a long position.
• If dots flip above price, it signals potential downside continuation.
⸻
🚀 Why This Works?
✅ VWAP ensures we only trade with the trend – no more counter-trend traps!
✅ MACD confirms trend momentum, filtering out false entries.
✅ Parabolic SAR gives early signals on when the trend is likely to continue or reverse.
⸻
🔥 Live Example: How This Worked on BTC/USD?
📊 BTC was trading near $42,300, hovering around VWAP.
📌 MACD gave a bullish crossover above 0, and Parabolic SAR flipped bullish at $42,400.
📈 Result? BTC pushed to $43,200 within hours, offering a perfect long entry!
⸻
Final Thought: Are You Using VWAP & MACD Together?
Many traders use MACD in isolation, but when combined with VWAP & Parabolic SAR, it becomes a powerful confirmation system.
📢 How do you filter out fake breakouts in BTC? Let’s discuss below! 👇
BTC Showing A big down moveWait for weekly candle closing
If close maintain stoploss
Do not use high leverage in this type of market

BTCUSDT TRADING POINT UPDATE >READ THE CHAPTIAN Buddy's dear friend 👋
SMC Trading Signals Update 🗾🗺️ crypto Traders SMC-Trading Point update you on New technical analysis setup for crypto BTC USDT BTC still rejected supply zone. Again. Back Short Trade. FVG level) 83k I'm want to Sell now short trend 📈
Key Resistance level 93k + 95k
Key Support level 85k - 83k
Mr SMC Trading point
Pales support boost 🚀 analysis follow)

BTCUSD SHOWING A GOOD DOWN MOVE WITH 1:10 RISK REWARD BTCUSD SHOWING A GOOD DOWN MOVE WITH 1:10 RISK REWARD
DUE TO THESE REASON
A. its following a rectangle pattern that stocked the market
which preventing the market to move any one direction now it trying to break the strong resistant lable
B. after the break of this rectangle it will boost the market potential for break
C. also its resisting from a strong neckline the neckline also got weeker ald the price is ready to break in the outer region
all of these reason are indicating the same thing its ready for breakout BREAKOUT trading are follws good risk reward
please dont use more than one percentage of your capitalfollow risk reward and tradeing rules
that will help you to to become a bettertrader
thank you

Possible Elliott Waves Counts of BITCOINHello friends, today we're analyzing the Bitcoin chart based on Elliott Wave Theory. We're using a 4-hour chart, where we can clearly see that we've completed the intermediate degree 3rd, 4th, and 5th waves means the completion of the primary degree ((3)) wave marked in black. After that, we completed another primary degree ((4)) wave marked in black.
Currently, we're moving upwards, which should be the primary degree ((5)) wave, containing five sub-divisions marked in blue as (1), (2), (3), (4) and (5) We've almost completed the (1) sub-division and are nearing the completion of the (2) sub-division.
According to Elliott Wave Theory, if the recent low wave ((4)) at around $70,200 holds and doesn't break below, the price has the potential to reach new highs towards $110,000 to $120,000. This analysis is entirely based on Elliott Wave Theory and its structure.
In this study we used Elliott Wave Theory & Structures, here we have plotted possible wave counts on daily time frame chart of DXY Dollar Index, it involves multiple possibilities, and the analysis presented focuses on one potential scenario. The provided information is for educational purposes only, not trading advice. There's a risk of being completely wrong.
I am not Sebi registered analyst.
My studies are for educational purpose only.
Please Consult your financial advisor before trading or investing.
I am not responsible for any kinds of your profits and your losses.
Hope this post is helpful to community
Thanks
RK💕
Disclaimer and Risk Warning.
The analysis and discussion provided on in.tradingview.com/u/RK_Charts/ is intended for educational purposes only and should not be relied upon for trading decisions. RK_Charts is not an investment adviser and the information provided here should not be taken as professional investment advice. Before buying or selling any investments, securities, or precious metals, it is recommended that you conduct your own due diligence. RK_Charts does not share in your profits and will not take responsibility for any losses you may incur. So Please Consult your financial advisor before trading or investing.

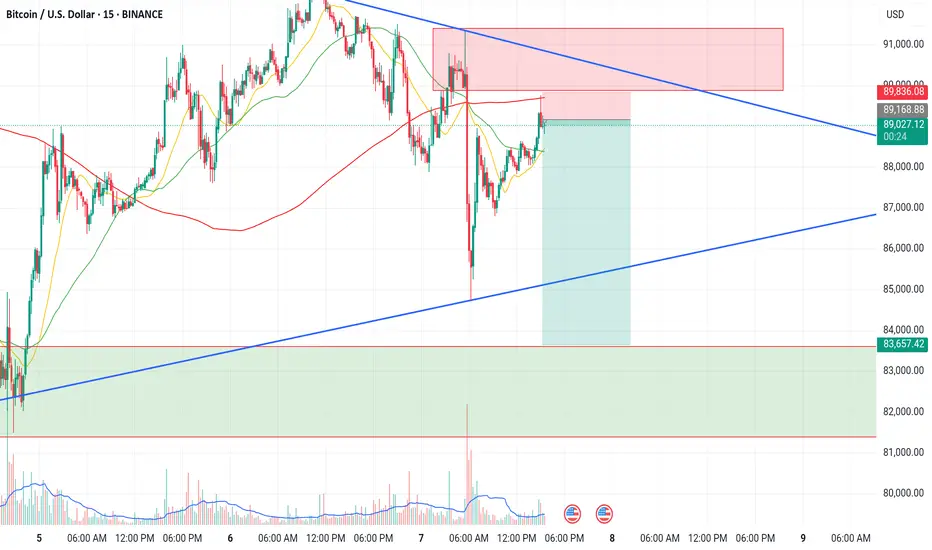
Very good shorting opportunity in BTC. Trade setup explainedBtc is getting rejection from 1hour supply zone. We can short btc with sl of 89840. We can target level of 83650. Risk reward ratio of the trade is very good i.e 1:8. Below at 83000 levels We have a demand zone which will be our target for the trade.
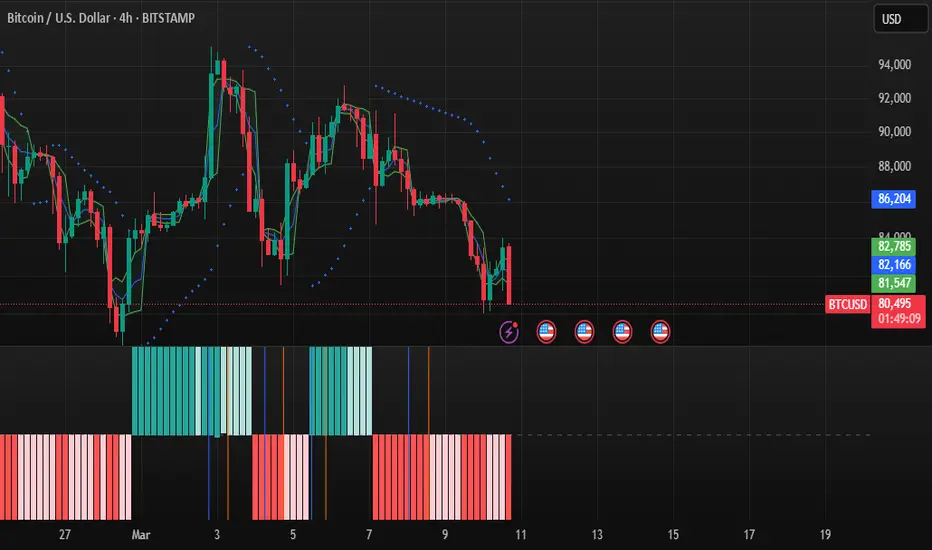
Bitcoin Bybit chart analysis March 6Hello
It's a Bitcoinguide.
If you have a "follower"
You can receive comment notifications on real-time travel routes and major sections.
If my analysis is helpful,
Please would like one booster button at the bottom.
This is the Bitcoin 30-minute chart.
There will be a Nasdaq index announcement at 10:30 in a little while.
At the bottom left is the long position entry point on March 5th.
The purple finger is connected to $88,407.
*Red finger movement path
One-way long position strategy
First wave check in section 1 at the top
1. Long position entry section of $90,698 / Stop loss price when purple support line is broken
2. Long position 1st target of $94,236.5 -> Gap8 2nd target
(Today's 4-hour chart, 12-hour chart resistance line section is $94,236.5
Since we don't know how much the adjustment will come out, it's okay to use a short position.)
3. After long profit cut, section 1, $91,884.5 long position utilization section
After that, long position target price in order of Top -> Good section.
Section 1 at the top
If there is an adjustment after the touch, a short->long movement will occur in NASDAQ
and it is more advantageous to wait for a long than a short,
and Section 2 at the bottom is a safe long position entry section where a short-term pattern is maintained.
From Section 3, there may be an additional decline,
so it would be good to check Bottom -> $83449.5 as indicated.
My waist and shoulders are not so good
I will enter early here today
Please use my analysis article as a reference only
Don't forget the 6 principles of trading and the essential stop loss price
and operate safely
Thank you.

BTC/USD TECHNICAL ANALYSIS – WHAT’S NEXT?📌 Timeframe: 2H
BTC/USD is currently trading within a symmetrical triangle pattern, signaling a phase of accumulation before a potential major breakout.
📈 TREND ANALYSIS & KEY PRICE LEVELS
1️⃣ Current Trend
BTC is trading around $86,301, moving within a narrowing price channel.
Price is caught between the ascending trendline support and the key resistance zone at $90,000 - $92,000.
A breakout above this zone could trigger a strong bullish move towards $98,000+.
Conversely, a failure to hold support may push BTC down to $82,764, with further downside potential towards $78,000 - $80,000.
2️⃣ Key Levels to Watch
🔺 Major Resistance Levels:
$90,000 - $92,000: Strong resistance; a breakout here could lead to a rally.
$98,000: The next target if BTC successfully breaks above resistance.
🔻 Major Support Levels:
$82,764: Closest support; a breakdown could trigger further downside.
$78,000 - $80,000: A strong demand zone that could provide a solid bounce if BTC dips further.
📉 POTENTIAL TRADING SCENARIOS
📌 Scenario 1 – Bullish Breakout 🟢
If BTC breaks above $90,000 - $92,000, it could confirm a bullish trend continuation toward $98,000+.
Watch for strong volume confirmation and a clear close above resistance.
📌 Scenario 2 – Bearish Rejection 🔴
If BTC fails to break $90,000 - $92,000, it could retrace to $82,764.
A further break below this level could send BTC down to $78,000 - $80,000 before finding strong support.
⏳ CONCLUSION – PREPARE FOR A BIG MOVE!
📊 BTC is in a critical accumulation phase, setting up for a major breakout soon.
📈 If BTC clears $90,000 resistance, the bullish trend will likely continue toward $98,000+.
📉 If BTC rejects and drops below $82,764, a deeper correction to $78,000 is possible.
⚠ Traders should wait for a clear breakout signal & manage risk carefully ahead of the big move!
📢 Do you think BTC will break out or correct further? Share your thoughts below! 🚀🔥

BTCUSDT TRADING POINT UPDATE >READ THE CHPTAIN SMC Trading Signals Update 🗾🗺️ crypto Traders SMC-Trading Point update you on New technical analysis setup for crypto BTC USDT. ) crypto Traders BTC USD ) list time post signals 🚀 Hit sucksfully My target point ) Now update on New analysis setup. BTC USDT still drop 💧. Trend 📉. Technical patterns FVG) 85k. Back down trand target point 78k.
Key Resistance level 85k
Key Support level 81k- 78k
Mr SMC Trading point
Pales support boost 🚀 analysis follow)

BTCUSD WEEKLY GANN ANALYSIS UPDATED 04 MARCH 2025We are seeing a bout of profit booking on the BTCUSD with the long awaited 6 figure targets achieved on it. Earlier swing high of 69000 could be back tested if it sustains below 78000. 69000 was hit in Nov 2021.Recent ATH of 109,356 hit in Jan 2025. Swing low in between these two highs was 16256 in Nov 2022. I was looking for a high around 108362. we got 109,356 not bad with my targets achieved. Critical time to watch is second week of May 2025. Momentum can be seen above 104421 and downside can continue below 83260 levels. in between these range we can see consolidation. Caution below 83260. Time window to watch is between 10 March 2025 to 12 May 2025. It will be trader's paradise as it has always been in the recent past.
Happy Trading !!!

BTCUSD: Trendline Support vs. Key Resistance - What's Next ?Previous Support Turned Resistance: The 91,000-93,000 range that previously acted as support has now flipped to resistance, confirming a classic price action principle.
Diagonal Trendline Support: Currently, price is respecting an upward diagonal trendline (marked by the red lines on the chart), providing short-term support.
Market Structure:
Bitcoin experienced a sharp drop from the 96,000 level in late February
Price found a bottom around the 80,000 mark before forming the current ascending trendline
Recent price action shows a series of higher lows along this trendline, suggesting potential bullish momentum building
Trading Outlook:
As long as price remains above the diagonal trendline support, we can expect a continued move higher
Immediate target would be a retest of the 91,000-93,000 resistance zone and if price sustain above this then more upisde possible.
A successful break above this resistance could signal a resumption of the larger bullish trend
However, a break below (Close on daily) the trendline support would invalidate this bullish scenario

We're so back?/It's over ? ! BTC UPDATE !BINANCE:BTCUSDT 4H
1. On Sunday, 02.03, we saw a massive market pump due to the news about the potential creation of a cryptocurrency reserve.
2. In terms of volume, the price increase was not equivalent to the buyer's investment efforts - an obvious manipulative bearish divergence pump!
3.On Monday, we saw the price drop to pre-pump levels, and some people are already thinking about continuing the decline.
4.This drop was not accompanied by equivalent volumes of sellers and we can assume that it has stopped.
EXPECTATIONS: I see the pair rising to 94.460, then pulling back and rising to 98.000 (assuming no breaking news)

BTCSymmetrical triangle formed. Breakout out on either side can take it to 12000 point up or down. Draw it on your chart. Will help you to trade better.

Bitcoin Bybit chart analysis March 7Hello
It's a Bitcoinguide.
If you have a "follower"
You can receive comment notifications on real-time travel routes and major sections.
If my analysis is helpful,
Please would like one booster button at the bottom.
Bitcoin 30-minute chart.
There will be a Nasdaq index announcement at 10:30 in a little while,
6-hour chart MACD dead cross is in progress.
*Red finger movement path
Long position strategy
1. 88,624 dollars long position entry section / cut-off price when purple support line is broken
2. 1st section at the top 1st target -> Top 2nd -> Target in order during the weekend
1st section at the top pink resistance line / green support line sideways to 3rd section
There is a possibility of additional decline from bottom breakout
Please check 4th section at the bottom -> 80,118.5 dollars
Thank you.

Bitcoin showing weakness. It may test 76076Bitcoin chart is weak now. weakly RSI below 60 MACD also negative. Double top pattern form and correction showing. As per chart it may test 76076 soon. It can short on any bounce up to 92000.
These is Neckline place near 76076 of Inverse H&S pattern. It would be retest of neckline.

BTC updateBTC
is in either B wave to upside, yet it already completed ABC correction 5 wave
but looks like expanding in 5th wave, it may create ED to the upside. as 5th wave's first
wave is abc, and looks like3 is also abc, as per this 3 must not go beyond 94607 and correct below 90877 to complete 4th wave for ED.
Let see how it plays out

BTCBitcoin is a form of digital currency that aims to eliminate the need for central authorities such as banks or governments. Instead, Bit
