Trendline Support Retest in BTCUSDBTCUSD is currently retesting a crucial trendline support after a sharp pullback. Price broke above resistance earlier and has now returned to retest the breakout zone — a classic setup where buyers may step back in. ✅
📉 After a strong downtrend, we saw a bullish reversal pattern forming, followed by a clean breakout. This retest can act as a potential entry point for a long setup, provided the support holds.
📌 Key Levels:
Support Zone: ~$115,250 – $115,280
Resistance Zone: ~$116,180 – $118,200
Risk-Reward looks balanced with a well-placed SL below the retest candle.
🛡️ Watch for bullish confirmation (like a strong bullish engulfing or volume spike) before entering!
📅 Timeframe: 15-Minute Chart
BTCUSD.P trade ideas

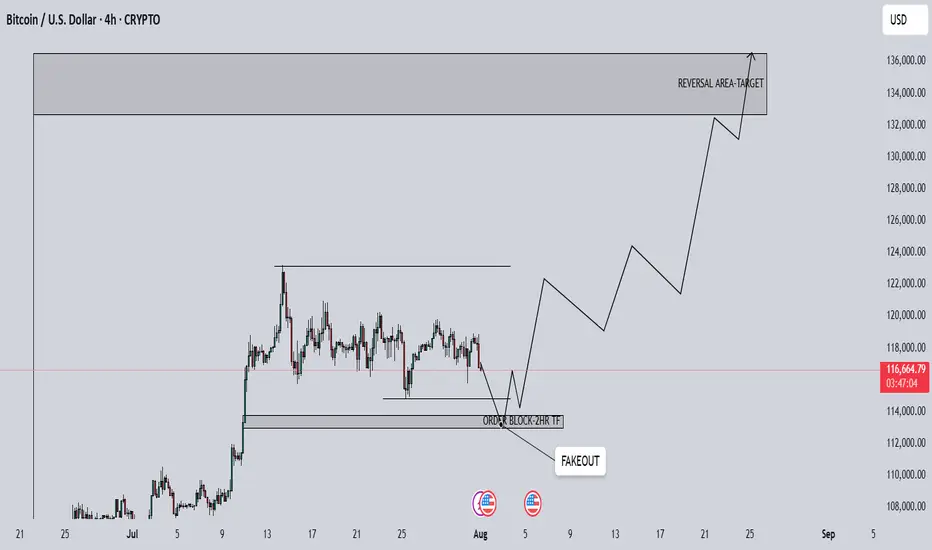
BTCUSD 4H Analysis1. Overall BTC is bullish but currently its at central area of
demand. so we can see a consolidation here.
2. There is a inducement/wicks at downside, so we can expect
a fake out at downside to fill the inducement and then market
can go to target area.
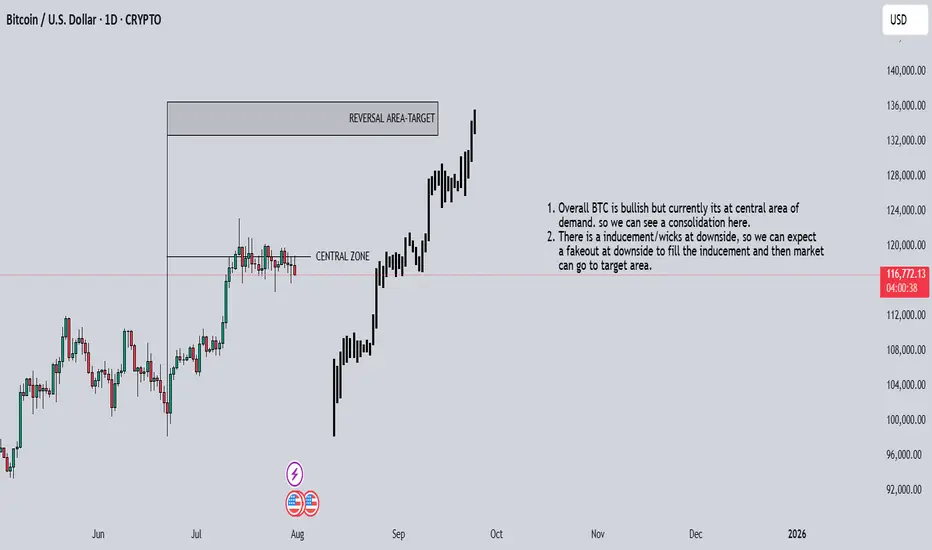
BTCUSD 1D Analysis1. Overall BTC is bullish but currently its at central area of
demand. so we can see a consolidation here.
2. There is a inducement/wicks at downside, so we can expect
a fake out at downside to fill the inducement and then market
can go to target area.
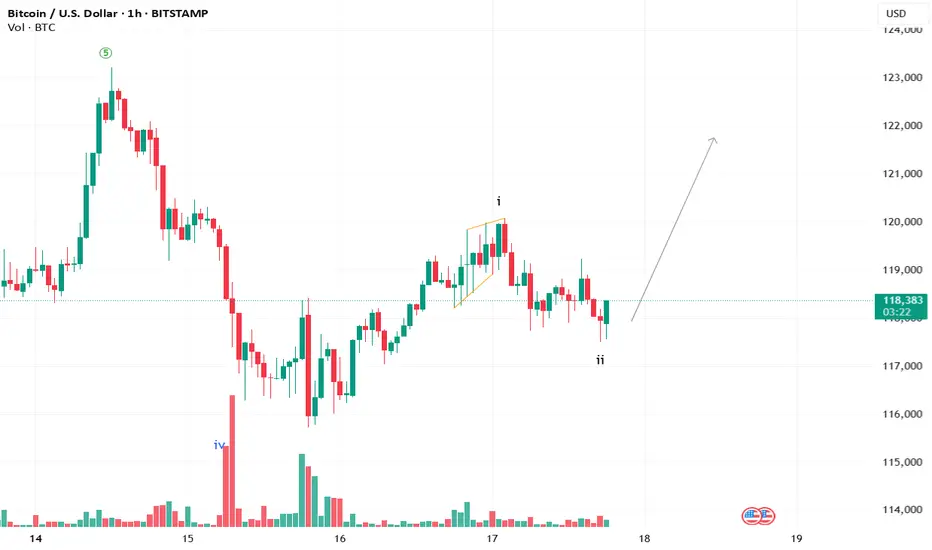
BTC ready to move up?An impressive wave 2 structure is about to be completed. We may observe the next wave 3 on the upside.
BTC Took Support – Big Move from Demand Zone Expected!🚀 BTC Took Support – Big Move from Demand Zone Expected!
Bitcoin (BTC/USD) has touched the demand zone and now showing signs of upside reversal. After taking out sell-side liquidity, price is getting ready for a bullish push toward higher targets.
📊 Technical Analysis:
🟤 Demand Zone (115,000 – 116,000):
Market came down and respected this zone. This is a strong area where buyers entered again.
🧲 Sell-Side Liquidity Grab:
Price formed equal lows, then broke them to collect liquidity before reversing — typical smart money behavior.
🔁 Break of Structure (BOS):
Structure break confirmed that trend might reverse now from bearish to bullish.
🟪 Fair Value Gap (FVG):
A clean FVG is also visible near the top side, and price may move to fill this imbalance.
🎯 Target: 119,000 USD:
If bulls hold the demand zone, BTC can easily move towards this resistance area. This is the short-term upside target.
📚 Key Learning Points:
Liquidity was collected below equal lows
Buyers stepped in from the demand zone
Break of structure confirms bullish pressure
FVG + Resistance area aligns with target
✅ Conclusion:
As long as BTC holds above 116,000, bulls are in control. This is a good zone for long entries, with a target near 119,000. Traders should watch for confirmation with minor BOS or strong bullish candles.

What is RSI divergences ?RSI divergences are one of the most powerful clues in technical analysis that signal potential trend reversals or continuation. they occur when the price action and the RSI indicator move in opposite directions.
📈 types of divergences:
🔸bullish divergence – price makes lower lows, but RSI makes higher lows. this often indicates that bearish momentum is weakening, and a bullish reversal may be near.
🔸bearish divergence – price makes higher highs, but RSI makes lower highs. this suggests that bullish momentum is fading, and a bearish reversal might follow.
🧠 why does this work?
divergences show a disconnect between price and momentum. while price may be pushing further in one direction, the underlying strength (as measured by RSI) is not confirming it. this imbalance often leads to a correction.
🛠 how to use it effectively:
* combine divergences with key support/resistance zones
* look for confirmation through candlestick patterns or volume
* use proper risk management — not every divergence plays out
🚨 tip: not all divergences are equal. use higher timeframes for stronger signals and avoid trading solely based on divergence without confluence.
📌 RSI divergences can add a powerful edge to your trading when used with other tools. master this concept and you'll start seeing hidden opportunities on your charts.
Disclaimer :
This Idea post is not financial advice, it's for educational purposes only, I am not a SEBI-registered advisor. Trading and investing involve risk, and you should consult with a qualified financial advisor before making any trading decisions. I do not guarantee profits or take responsibility for any losses you may incur.

BTCUSD Bullish biasBuying Bitcoin as demand stays strong with more big investors joining in. Positive global news like trade deals and clearer crypto rules are boosting confidence. Bitcoin is near its highs and could break out to new levels if momentum continues. Some risks exist but trend and fundamentals look bullish short-term. Watching ETF flows, US news, and altcoin trends too. Aiming for a move toward $120k if support holds.

BTC USD -- Short Term Trade🧠 Technical Setup:
🟢 Buying Area: Price is hovering over a well-tested demand zone near $117,700–$117,000, showing signs of defense by bulls.
✅ Risk-Reward Favourable: Stop loss is clearly defined below support, allowing tight risk with high upside.
📈 RSI Bounce: RSI shows a bounce from oversold, adding confluence to the long setup.
🔼 Targets:
🎯 Target 1: ~$119,500 (recent lower high)
🎯 Target 2: ~$120,800 (supply test zone)
📊 Market Context:
⚠️ Volume remains modest — aggressive entries should be managed with caution.
A break below $116,000 would invalidate this idea.
⚠️ Disclaimer:
This chart is for educational and informational purposes only. It is not financial advice. Cryptocurrency trading involves high risk. Always do your own research and consult a registered financial advisor.
🔔 Follow @Alpha_Analyst10 for daily chart setups | 💬 Share your thoughts below
#BTCUSDT #BitcoinAnalysis #CryptoSetup #TechnicalAnalysis #TradingView #AlphaAnalyst

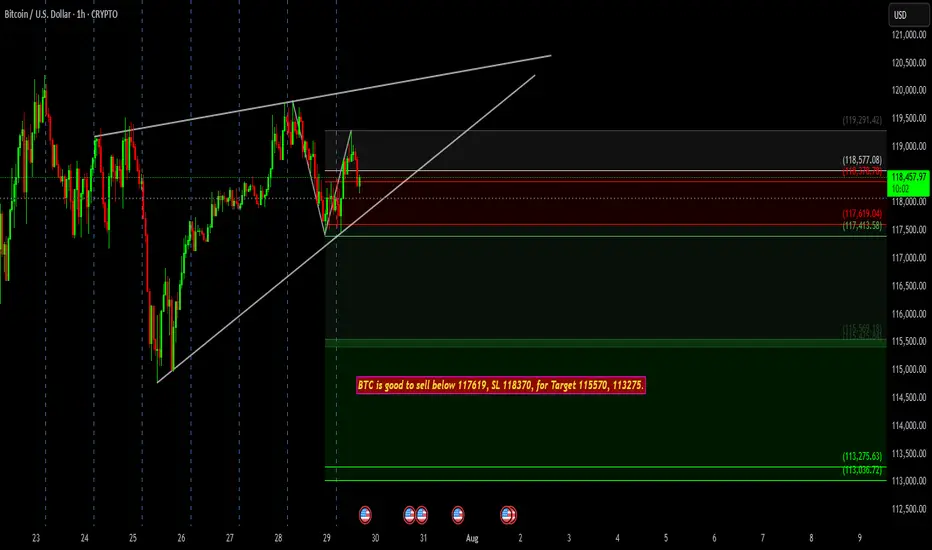
BTC is showing weakness near resistance.BTC is showing weakness near resistance and forming a possible rising wedge breakdown pattern on the 1H chart. A sell setup is active below 117619, with a stop loss at 118370.
🎯 Targets:
1️⃣ 115570
2️⃣ 113275
BTCUSD - Consolidation Breakout & RetestBitcoin has successfully broken out of its consolidation zone on the 15-minute chart. After a strong breakout above the horizontal resistance, we are now seeing a textbook retest of the breakout level, which may act as a fresh support.
✅ Bullish confirmation if price sustains above the breakout zone
📍 Resistance turned support at ~118,700
🎯 Upside momentum likely to continue if this retest holds

Bitcoin rebounds with strength after whale dumpAfter a surprising sell-off triggered by whale pressure, Bitcoin (BTCUSD) has shown impressive internal strength, bouncing quickly from the Fibonacci support zone between 114,488 and 116,571 USD (0.618 – 0.5 levels).
The D1 chart reveals that the bullish structure remains intact, with EMA 34 and EMA 89 acting as solid support levels. The recent "dump" did not alter the overall trend; on the contrary, it created an opportunity for reaccumulation within the price box—serving as a vital base for the next breakout.
A likely scenario is that BTCUSD will continue to move sideways for a few more sessions before targeting the 1.272 Fibonacci extension near the 128,000 USD area. If this plays out, it would be a strong confirmation of the next growth phase for Bitcoin.
Do you believe Bitcoin is ready to break all-time highs and set a new record? Share your thoughts below!

Corrective DownBitcoin seems to be completing Wave F of a diametric formation.
Generally, Wave B and Wave F are related to each other and till now, Wave F is almost equal to Wave B, so a potential area of resistance
After this a corrective downside in form of Wave G could start.

Bitcoin fall possible from current price buy on dip near supportBitcoin short term view negative , fall will come from current price buy near support 113500-112900. , at current price buying risky wait for dip, levels mentioned on chart
BTCUSD BTC/USD update: considering a move like this. However, a close above 120,222 may open an opportunity to go long, but that isn't an optimal range for opening a long position.

Target hit on BTC/USD
The entry price of 117,605 is likely chosen based on technical analysis, where Bitcoin shows bullish signals, such as a breakout above resistance or confirmation from indicators like RSI, MACD, or moving averages. Entering at this price suggests that the trader expects upward momentum to continue, aiming for the target of 118,857.
The stop-loss at 117,000 is set just below a support level to protect against unexpected downward moves. If Bitcoin fails to sustain above the entry zone, this stop-loss helps minimize losses. Setting the stop at a strategic level prevents being stopped out by normal market fluctuations while still managing risk.
The exit price at 118,857 acts as the take-profit level, aligned with a resistance area or projected price target. Exiting at this level ensures that profits are locked in without waiting for unpredictable price reversals.
This trade setup reflects disciplined trading with predefined risk management. Using a clear entry, stop-loss, and exit strategy avoids emotional decision-making. Because BTC/USD is highly volatile, continuous monitoring of price action and market news is essential. Sticking to the plan ensures the trader can capture potential gains while limiting downside risk, making this trade a balanced and calculated approach to cryptocurrency trading.

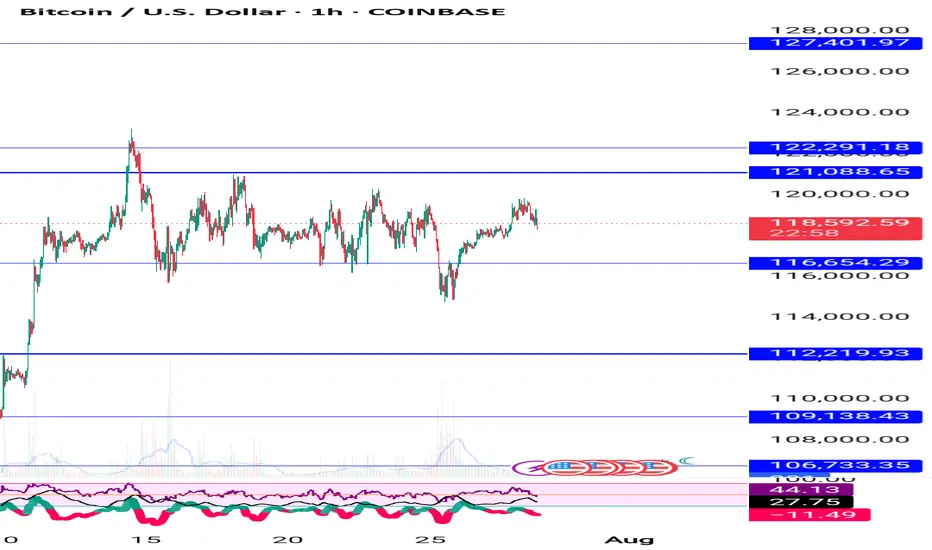
BTCUSD 1D TimeframeBitcoin is trading near $117,800 – $118,400
It’s in a sideways consolidation zone after a strong uptrend
📊 Technical Summary
📈 Trend Direction:
Primary Trend: Bullish (long-term)
Short-Term Trend: Sideways to slightly bullish
Structure: Higher highs and higher lows still intact
🔍 Key Support & Resistance Levels
🟢 Support Zones:
$117,000 — Immediate support zone
$115,000 — Minor demand zone
$112,000 — Key swing low support
$108,000 – $110,000 — Strong base if correction deepens
🔴 Resistance Zones:
$119,000 — Current price ceiling
$121,000 — Breakout target
$123,000 – $125,000 — All-time high resistance area
🧠 Indicators Overview
📌 RSI (Relative Strength Index):
Around 58–60
Shows moderate bullishness — not overbought
📌 MACD (Moving Average Convergence Divergence):
MACD line above signal line, but momentum is weakening
Indicates potential slowing of bullish push
📌 Moving Averages:
20-day EMA: Below price — short-term support
50-day EMA: Also below — confirms mid-term uptrend
200-day EMA: Far below — strong long-term bullish signal
🕯️ Candlestick Behavior
Recent candles are small-bodied: suggests indecision
Wicks both sides: market waiting for next trigger
No bearish reversal patterns visible yet

Institutional Trading🏛️ Institutional Trading 📊
Trade Like the Smart Money
Institutional Trading refers to the high-volume, data-driven buying and selling of financial assets by large entities such as hedge funds, banks, mutual funds, insurance companies, pension funds, and proprietary trading firms. Unlike retail traders, institutional traders have access to advanced tools, deep liquidity, insider networks, and strategic research that give them a significant edge in the market.
These market participants don’t chase price—they move it. Their trades are structured, well-researched, and often hidden from the public eye through techniques like iceberg orders, dark pools, and algorithmic execution.
🔍 Key Features of Institutional Trading:
✅ Volume & Scale: Trades are executed in massive quantities, often spread across multiple venues to avoid detection.
✅ Market Influence: Institutions drive trends and liquidity. Their positioning can define entire market cycles.
✅ Strategic Execution: Every move is planned, including accumulation, distribution, and fakeouts to trap retail participants.
✅ Advanced Tools: They use sophisticated algorithms, AI-based models, high-frequency data, and institutional-grade charting.
✅ Focus on Risk-Reward: Strict risk management and portfolio balancing govern every trade decision.
🚀 Elevate Your Trading:
Learning Institutional Trading isn’t about copying big players—it’s about thinking like them, reading the market through their lens, and upgrading your strategy with smart money logic.
📈 Trade with structure. Trade with logic. Trade like an institution.

"BTC’s Liquidity Grab: Is the Bull Ready to Charge?"🧠 Key Observations:
Break of Structure (BOS):
Multiple BOS levels confirm shifts in market structure from bullish to bearish and back.
The latest BOS near the support zone suggests a possible shift from bearish to bullish trend.
Support & Resistance Zones:
Resistance marked near the 120,241 level, which is also the target zone.
Support is clearly respected around the 114,898 level with price reacting strongly near the equal lows.
Liquidity Hunt:
Price swept the sell-side liquidity below the equal lows around 114,000 and bounced.
This indicates smart money might have collected liquidity before pushing the price higher.
Bearish FVG (Fair Value Gap):
A bearish imbalance around the 117,000 zone acted as a resistance during the previous rally.
Price might revisit this area for a mitigation before continuation to the upside.
Volume Profile (left side):
High volume nodes indicate significant trading interest in that region, confirming key price acceptance zones.
🎯 Expected Move:
If price sustains above the support zone and confirms bullish intent with higher highs, we may see a move towards the target at 119,637 – 120,241 zone.
📌 Conclusion:
Market has potentially formed a liquidity grab and BOS, signaling a bullish reversal. If this structure holds, BTCUSD could target the resistance area. However, if the price breaks below 114,000 again, it might invalidate this bullish setup.

BTCUSD Bullish biasLooking at a bullish move on BTCUSD post confirmation. Awaiting major bullish moves if not sooner, at least eventually. Would pretty much expect the similar movement on other cryptos as well.

Option Trading📘 Option Trading
Option Trading is a type of trading where you buy and sell contracts called options, instead of directly buying stocks. These contracts give you the right (but not the obligation) to buy or sell an asset at a set price within a specific time.
There are two main types:
🟢 Call Option – Right to buy the asset
🔴 Put Option – Right to sell the asset
Traders use options to:
📈 Make profits from price movements
🛡️ Hedge their investments
💰 Generate consistent income
⚖️ Manage risk with limited capital
Options are powerful because they offer leverage (small investment, big potential), but they also come with higher risks if not used carefully.
📌 In simple words:
Option Trading lets you bet on whether a stock will go up 📈 or down 📉, without owning it — and helps smart traders manage risk and reward like a pro.

BTC/USD TRADE
The entry price of 117,605 is likely chosen based on technical analysis, where Bitcoin shows bullish signals, such as a breakout above resistance or confirmation from indicators like RSI, MACD, or moving averages. Entering at this price suggests that the trader expects upward momentum to continue, aiming for the target of 118,857.
The stop-loss at 117,000 is set just below a support level to protect against unexpected downward moves. If Bitcoin fails to sustain above the entry zone, this stop-loss helps minimize losses. Setting the stop at a strategic level prevents being stopped out by normal market fluctuations while still managing risk.
The exit price at 118,857 acts as the take-profit level, aligned with a resistance area or projected price target. Exiting at this level ensures that profits are locked in without waiting for unpredictable price reversals.
This trade setup reflects disciplined trading with predefined risk management. Using a clear entry, stop-loss, and exit strategy avoids emotional decision-making. Because BTC/USD is highly volatile, continuous monitoring of price action and market news is essential. Sticking to the plan ensures the trader can capture potential gains while limiting downside risk, making this trade a balanced and calculated approach to cryptocurrency trading.

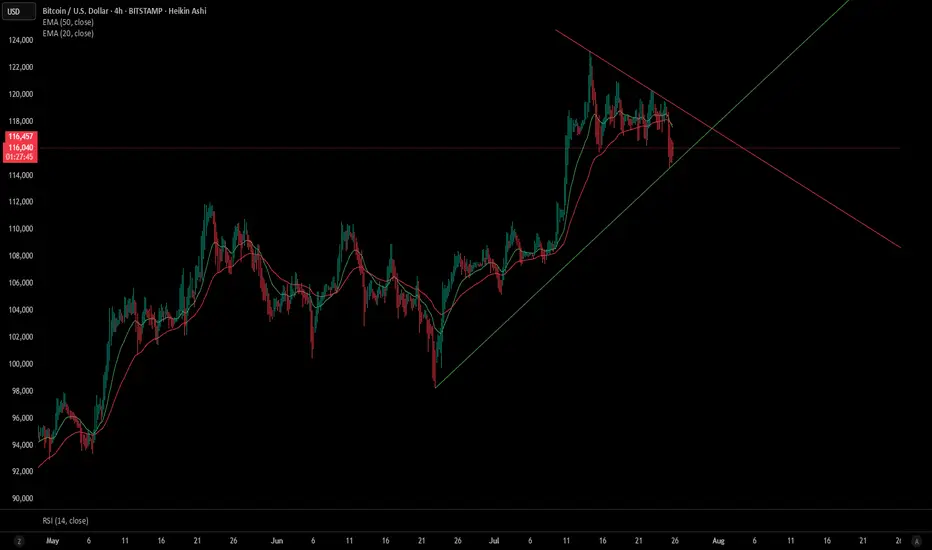
Bitcoin (BTC/USD) – Key Triangle Breakdown Test on 4H ChartBitcoin is currently testing critical support at the base of a rising wedge / symmetrical triangle on the 4-hour Heikin Ashi chart. The market recently rejected a descending resistance trendline, and price is now threatening to break the ascending support.
EMAs: Trading below both the 20 EMA ($117,554) and 50 EMA ($117,762), signaling near-term bearish momentum.
RSI (14): At 45.38, pointing to weakening bullish pressure, approaching neutral-bearish territory.
Pattern Watch: Price has broken below the uptrend support zone, with the next few candles likely to confirm a breakdown or fake out.
Invalidation Zone: Reclaiming $117,500+ would invalidate immediate downside risk.
Downside Confirmation: Sustained move below $115,500 may open downside targets near $112,000–$110,000.
This is a crucial technical juncture. Traders should watch for volume spikes and price reaction to confirm direction. A breakout or breakdown from this triangle will likely define Bitcoin's next multi-thousand-dollar move.
BTCUSD-Eyes 120000 after Liquidity Sweep & Support RetestPrice action on the 15-min chart shows Bitcoin forming a potential bullish continuation after a liquidity sweep below short-term support. Here’s what stands out:
🔹 Triple Tap Support: Price respected a key zone multiple times, hinting at strong buyer interest.
🔹 Post-Sweep Reaction: Sharp recovery followed by consolidation suggests demand re-entered the market.
🔹 SignalPro Context: Leola Lens™ SignalPro highlighted key zones (yellow + orange), offering caution and trend context.
🔹 Projected Path: With price stabilizing above the reclaimed zone, potential upside target aligns with the 120000 region.
📌 Educational Note:
This setup highlights how liquidity collection below support and subsequent recovery can offer clues to short-term directional intent. Always manage risk based on volatility and session context.
