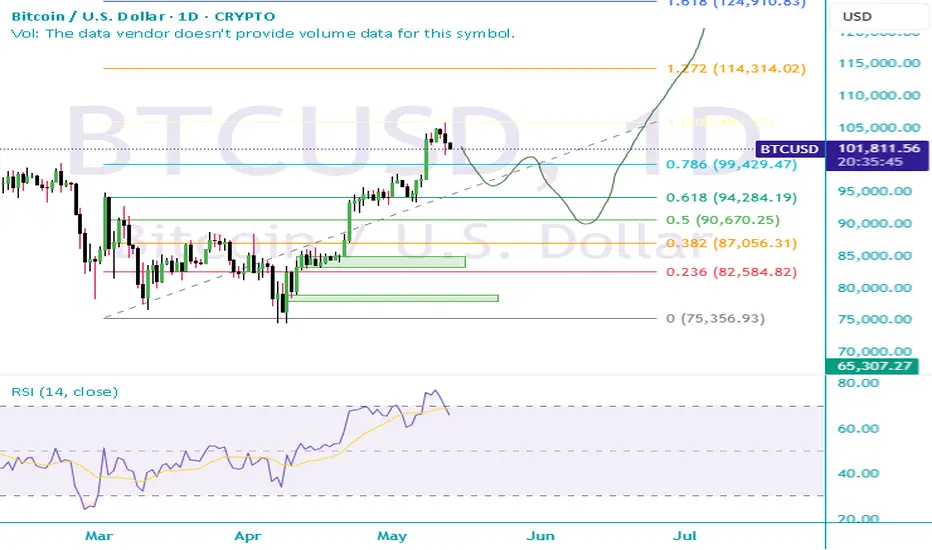
Is BTCUSD still in WXY correction phase ?BTCUSD continues to be correcting till 48K-62K band, this is weekly chart so it will take time.
Current up-move seems to be X wave as indicated.,
Why 51-62K is the band where correction will end ?
a. Technical divergence gets resolved here
b. 1.618 Fib relation of assumed corrective Wave-W falls in this band
Can the current rising segment impulsive ?
No because current rising segment is pretty corrective supporting high probability of next wave-Y
Will the correction stop at Wave-Y ?
May not be as one more leg up (Wave-X) and one more Leg down (Wave-Z) can be formed
BTCUSD.P trade ideas

Bitcoin facing resistance near ATH buy above 105600 or buy 98800How to take trades using Harmonic pattern projection Trade setup is explained below :-
Entry : 1st SL point : 0% is recent top or bottom.
Trailing D: 15.1% is work as trailing SL of buy or sell trade if hit then we have to book profit
.If price goes below 2nd D 22.5% to 24.5% range then early traders can make fresh reversals trade after breaking 1st D 15.1% safe traders can reversal trade after breaking Point D 22.5.4% to 24.5% range
Targets :
Target T1 : 36.1% to 38.3%
Target T3 : 49.1% to 52.5%
T3: 60.9% to 64.8% is our 3rd Target since this is reversal zone so must book profit if break then take fresh trade again
Target T4 : 76.4% to 79.7%
Next Targets are 100% , 127.2% ,141.4% and final Target 161.8%.
How to take reversal trade :
If price going upside/ downside then then buy or sell levels appear on Chart ( Automatically show when price reach any reversal zone of harmonic projection ).
Trailing SL:
After reach 1st Target trail SL to just above or below cost ( for example we are holding sell trade from 100 1st Target 110 hit then move trailing sl to 104-105 and move SL as price move upside or Downside)
Re- Entry :
For Re-entry in any pull back Point D ( 15.1% ) is used for re-entry then SL recent high or low Point SL ( 0% ) .
Blue Line is 1st support/ Resistance
Green line is 2nd support/ resistance
Red line is 3rd Support/ resistance

bitcoin zonecould this pink line act as a mirror? Can we perhaps range sideways in this region for a while and then shoot up eventually? It appears it can happen. These prices are uncharted waters so nothing can be said for certain. But we can hope for the best. Perhaps while bitcoin ranges there will be an eth season

BTC zeroIf BTC doesn't break the top, it will return to the stone age
1) Too much news, everyone knows about the coin
and stores it as an asset!
2) Trading volume is down
3) All information is consistent with the 5th wave of the elliot theory

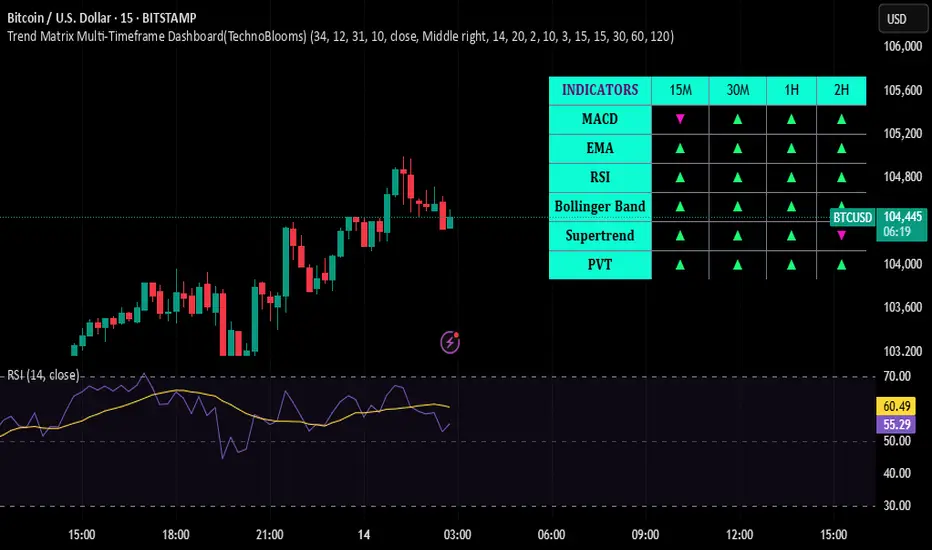
Trend Matrix+RSI: Simple Multi‑Timeframe Strategy for Confident 🔰 Trend Matrix + RSI: Simple Multi‑Timeframe Strategy for Confident Trades 🚀
Want a strategy that’s easy for beginners yet powerful enough for pros? This TradingView idea combines the Trend Matrix Multi-Timeframe Dashboard with the classic RSI indicator to create a visually compelling, high-probability trading method. By aligning multi-timeframe trend signals with momentum confirmation, you get clear guidance on when to enter and exit trades on any market – from Bitcoin and Gold to Nifty 50. 📈✨
Strategy Overview 🎯
• Trend Matrix MTF Dashboard: This is a multi-timeframe trend analyzer that compresses several trusted indicators into one simple dashboard . It displays a grid of up/down arrows showing the trend signal from multiple indicators (like MACD, EMA, RSI, Bollinger Bands, Supertrend, PVT) across different timeframes . If most arrows are green (up), the market’s trend is bullish; if mostly red (down), it’s bearish. Think of it as a “trend at a glance” panel – a quick green-light/red-light system that helps you trade with confidence by filtering out noise . It’s designed to be clean and beginner-friendly (no messy charts!) , so you can instantly gauge the dominant trend without flipping through multiple timeframes.
• RSI (Relative Strength Index): RSI measures momentum and identifies overbought/oversold conditions. It’s a favorite tool for confirming entries: when RSI is low (oversold) in an uptrend, it suggests a good buy the dip opportunity; when RSI is high (overbought) in a downtrend, it suggests a good sell the rally spot . RSI also has a midpoint at 50 – above 50 generally indicates bullish momentum, below 50 indicates bearish momentum. By combining RSI with the Trend Matrix, we add an extra layer of confirmation so we’re not just blindly following trend signals – we’re waiting for momentum to agree with the trend direction.
Why this combo? The Trend Matrix gives you the big picture trend alignment (across 1H, 15M, etc.) while RSI pinpoints timing for entries. This way, you trade with the larger trend but only enter when momentum swings in your favor. The result is a simple strategy that catches strong moves and avoids false signals. This works best in trending markets (when the Trend Matrix shows a clear majority direction) – that’s when our trend+momentum combo shines. In choppy/ranging markets (mixed signals on the dashboard), it’s wise to be patient or use tighter confirmation (e.g. require an extra indicator or higher RSI threshold) because signals can flip-flop in ranges. Always remember: no indicator is 100%, but combining them stacks the odds in our favor by aligning trend and momentum. 💪
Entry & Exit Rules 📌
Timeframes: Higher timeframe: 1H (for trend direction) – Lower timeframe: 15M (for entries). We use 1H Trend Matrix to define the context, and 15M with RSI for execution. (You can adapt to other pairs like 4H/1H for swing trades or 15M/5M for scalping, but 1H/15M is a universal starting point that works for crypto, commodities, and indices.)
1️⃣ Identify the Trend (1H Chart): Check the Trend Matrix dashboard on the 1H timeframe for the asset you’re trading (e.g., BTC/USD, XAUUSD, NIFTY). If the majority of signals on 1H are up (mostly green arrows), your bias is LONG. If the majority are down (mostly red arrows), your bias is SHORT. No clear majority? The market might be sideways – consider waiting. 👍
2️⃣ Align Lower Timeframe (15M Chart): Switch to the 15M chart. Ensure the 15M Trend Matrix is at least mostly aligned in the same direction as the 1H. You want to see that the short-term trend is not fighting the higher timeframe. This keeps you trading in the direction of the dominant trend, avoiding counter-trend traps  .
3️⃣ RSI Confirmation for Entry: Now use RSI on the 15M chart to time your entry:
• For a Long Trade: Wait for RSI to dip into an oversold zone (below ~30) during that uptrend. An oversold reading in a bullish-trending market means price pulled back against the trend – a potential entry point. Enter long when RSI starts rising back up (e.g., crosses above 30 or 40 from below) and the Trend Matrix still shows bullish alignment. Another method: if RSI was below 50 and then pushes back above 50, it signals momentum is regaining in the upward direction . This is your green light to buy.
• For a Short Trade: Wait for RSI to spike into an overbought zone (above ~70) during that downtrend. Overbought in a bearish trend = a bounce that could reverse down. Enter short when RSI turns down from high levels (e.g., drops below 70 or 60) and the Trend Matrix still shows bearish alignment. Alternatively, an RSI cross from above 50 downwards back below 50 can confirm momentum turning down with the trend .
✨ The idea is to buy dips in an uptrend and sell rips in a downtrend. RSI is your trigger to make sure you’re entering when momentum is resetting in your favor, rather than chasing an already overextended move.
4️⃣ Exiting the Trade: Set clear exit rules to lock in profit and limit risk:
• Take Profit/Exit on Momentum Extremes: In a long, consider taking profit when RSI reaches back into overbought (>70) on the 15M or shows a bearish divergence (signs of trend exhaustion). In a short, take profit when RSI goes oversold (<30) or shows bullish divergence. This way, you exit as the move reaches the opposite extreme of momentum.
• Dashboard Trend Reversal: If the Trend Matrix starts to flip signals against your trade (e.g., you were long and you see several key cells turn from green to red on the 15M or 1H dashboard), that warns the trend may be weakening. You could exit if 4-5 or more of the 15M signals turn opposite or if the 1H majority is no longer aligned . For example, if you’re long and the dashboard goes from mostly green to half red, it’s time to secure profits or tighten your stop.
• Stop Loss: Always use a stop! A common approach is placing a stop-loss below the recent swing low (for longs) or above the recent swing high (for shorts) on the 15M chart. If price hits this, it means the setup failed and you exit the trade to prevent larger losses. 🔒
By following these entry/exit rules, you’ll ride the trend when both the trend structure (Trend Matrix) and momentum (RSI) agree, and step aside when they don’t.
Tips for Beginners 💡
• Stick to Clear Trends: This strategy shines in clear uptrends or downtrends. If the Trend Matrix panel is mixed (some green, some red), the market may be choppy – be patient or skip trading until a direction emerges. 🔃
• Use 1H/15M as a Starting Point: For versatility, start with 1H trend and 15M entries, which works well for intraday and short swing trades on BTC, Gold, Nifty, etc. Once comfortable, you can experiment with other timeframe pairs (e.g., 4H/1H for longer swings, or 15M/5M for faster scalps).
• Don’t Ignore Risk Management: Even the best strategy can have losses. Always set a stop-loss and manage your trade size. For example, if the dashboard and RSI setup looks perfect, still only risk a small percentage of your capital on the trade. Risk management is key to long-term success. 📉🔒
• Practice and Review: Try this combo out on historical data or a demo account first. Observe how often the signals would have worked and how you might fine-tune entry timing. With practice, you’ll get a feel for how the Trend Matrix and RSI interact. 📝✅
• Stay Emotionally Disciplined: The dashboard gives a quick green/red view, and RSI adds confidence, but avoid taking trades out of FOMO if the criteria aren’t met. It’s okay to miss a move – there will always be another opportunity. Keep a cool head and stick to the rules. 👍
By following this beginner-friendly game plan, you’ll be leveraging a powerful multi-timeframe edge. The Trend Matrix + RSI combo helps ensure you trade with the trend and with momentum on your side – a recipe for more confident and higher-probability trades. Good luck and happy trading! 🍀🚀
#BTCUSD #XAUUSD #NIFTY50 #TrendMatrix #RSI #TradingStrategy #MultiTimeframe #DayTrading #SwingTrading #TechnoBlooms #Beginners
Bitcoin updated levels 98700-98000 support buy dip or after ATH How to take trades using Harmonic pattern projection Trade setup is explained below :-
Entry : 1st SL point : 0% is recent top or bottom.
Trailing D: 15.1% is work as trailing SL of buy or sell trade if hit then we have to book profit
.If price goes below 2nd D 22.5% to 24.5% range then early traders can make fresh reversals trade after breaking 1st D 15.1% safe traders can reversal trade after breaking Point D 22.5.4% to 24.5% range
Targets :
Target T1 : 36.1% to 38.3%
Target T3 : 49.1% to 52.5%
T3: 60.9% to 64.8% is our 3rd Target since this is reversal zone so must book profit if break then take fresh trade again
Target T4 : 76.4% to 79.7%
Next Targets are 100% , 127.2% ,141.4% and final Target 161.8%.
How to take reversal trade :
If price going upside/ downside then then buy or sell levels appear on Chart ( Automatically show when price reach any reversal zone of harmonic projection ).
Trailing SL:
After reach 1st Target trail SL to just above or below cost ( for example we are holding sell trade from 100 1st Target 110 hit then move trailing sl to 104-105 and move SL as price move upside or Downside)
Re- Entry :
For Re-entry in any pull back Point D ( 15.1% ) is used for re-entry then SL recent high or low Point SL ( 0% ) .
Blue Line is 1st support/ Resistance
Green line is 2nd support/ resistance
Red line is 3rd Support/ resistance

"BTC/USD Short from 104,855 – Target 93,159. Entry Point
104,855 USD is marked as the entry point (likely for a short position).
The current price is around 103,775 USD, slightly below the entry level.
2. Resistance Zone
Highlighted just below the entry point (~103,000–104,855 USD).
Price is currently testing this zone, possibly indicating a failed breakout or pullback setup.
3. Stop Loss
Placed around 104,807 USD, just above the resistance area, in a shaded purple zone.
Suggests the trade strategy is based on shorting near resistance with a tight stop.
4. Target
EA Target Point is marked at 93,159 USD.
Implies a projected downward move of about −11,264 USD (−10.76%) from entry.
5. Indicators & Tools Used
Moving Averages: 200-period (blue) and a shorter MA (red), showing bullish momentum.
Support/Resistance Zones: Multiple purple rectangles denote demand/supply areas.
Trend Lines: Used to capture recent bullish momentum; a break of the lower line may confirm a trend reversal.
6. Pattern Recognition
Series of lower highs forming after a strong uptrend could suggest bearish divergence or distribution phase.
The price appears to be stalling at the resistance area, aligning with a potential short setup.
🧾 Trade Setup Analysis:
Bias: Bearish (short position).
Entry: 104,855
Stop Loss: 104,807 (tight SL above resistance zone)
Take Profit: 93,159
Risk-Reward Ratio (RRR): Roughly 1:10, which is aggressive and would require high conviction or confirmation

XAU/USD - Mirror Move PredictionBest opportunity for Traders?
This analysis covers the potential upside move that XAU/USD can make over the next couple of days.
Applying the age old - Mirror Market Concept to the Gold chart, it is extremely clear that the potential levels that Gold will react to for sure are as follows:
1. Interim Resistance - $3434
2. Strong Resistance - $3480-$3500 (ATH)
3. Strong Support - $3200
Mirror Market Concept basically tells us that - whatever has already happened in the markets, will eventually happen again, with a few volume bursts here and there. Markets often tend to mirror their already existing moves but traders hardly take it seriously. It's all infront of your eyes traders! All the time. Try to take advantage of it.
Gold is at a very important support zone right now and is creating a similar structure, exactly like the previous upside move it just made in the first week of May , let's all hope that it gets enough volume to push prices upwards from here on, at least to the All Time High once again. Even if Gold has to fall, it has to sweep the sellers side liquidty created at the ATH and fall from there on, creating a Double Top structure.
What do you guys think? Let me know in the comments. Open to discussion :)
Trade Safe & don't over-leverage your positions!
Cheers!

BTC will revisit 90k before moving higherThe last distribution time has come for this Bull run
BTC.D will be recovered for a bit
BTC will retrace to CME gap at 91k and accumulate for the next push up.
The market is irrational, so it is not definite plan.
Bitcoin Bybit chart analysis May 9Hello
It's a Bitcoinguide.
If you have a "follower"
You can receive comment notifications on real-time travel routes and major sections.
If my analysis is helpful,
Please would like one booster button at the bottom.
This is the Nasdaq 30-minute chart.
There is no separate indicator announcement today.
With the green support line maintenance condition, I created a strategy for a sideways market with a red finger long position strategy.
The main sections are indicated by price, so
Please refer to it.
This is a Bitcoin 30-minute chart.
At the bottom left, with a purple finger,
I just connected the 99,222.6 dollar long position strategy from the 8th analysis article.
*When the red finger moves,
One-way long position strategy
1. 102,536 dollar long position entry section / cut-off price when the green support line breaks
2. Top section 105,417.6 dollar long position 1st target -> Target price in order from Good to Miracle.
From Miracle, the report is updated,
and the possibility of the report being updated has greatly increased due to yesterday's movement.
The 1st purple finger section at the top
If it doesn't break through, it's a sideways market, but if it breaks through, it can be directly connected to an upward trend,
so it seems safer to operate it as a long position waiting rather than taking a short. (Horizontal range until convergence section 1, 2)
From the green support line deviation of section 2 at the bottom
Because of the full candle on the left, it can be pushed hard,
So you must follow the stop loss price.
This week, it is open from Bottom-> 3rd -> 97086.1,
So please use it well in real time.
Up to this point, I ask that you simply refer to and use my analysis
And I hope that you operate safely with principle trading and stop loss price.
Thank you for your hard work this week.
Thank you.

Bitcoin avoid buying at current price 98500-97000 support How to take trades using Harmonic pattern projection Trade setup is explained below :-
Entry : 1st SL point : 0% is recent top or bottom.
Trailing D: 15.1% is work as trailing SL of buy or sell trade if hit then we have to book profit
.If price goes below 2nd D 22.5% to 24.5% range then early traders can make fresh reversals trade after breaking 1st D 15.1% safe traders can reversal trade after breaking Point D 22.5.4% to 24.5% range
Targets :
Target T1 : 36.1% to 38.3%
Target T3 : 49.1% to 52.5%
T3: 60.9% to 64.8% is our 3rd Target since this is reversal zone so must book profit if break then take fresh trade again
Target T4 : 76.4% to 79.7%
Next Targets are 100% , 127.2% ,141.4% and final Target 161.8%.
How to take reversal trade :
If price going upside/ downside then then buy or sell levels appear on Chart ( Automatically show when price reach any reversal zone of harmonic projection ).
Trailing SL:
After reach 1st Target trail SL to just above or below cost ( for example we are holding sell trade from 100 1st Target 110 hit then move trailing sl to 104-105 and move SL as price move upside or Downside)
Re- Entry :
For Re-entry in any pull back Point D ( 15.1% ) is used for re-entry then SL recent high or low Point SL ( 0% ) .
Blue Line is 1st support/ Resistance
Green line is 2nd support/ resistance
Red line is 3rd Support/ resistance

BTC USD Weekly analysis (10-05-25 to - 17-05-25)₿ BTC/USD Outlook – Mid to Late May 2025
Current Price: $103,516
Timeframe: 4H
Bias: Bearish Reversal Expected
Projection: Drop toward $92,000 or lower
Key Date Marked: May 9, 2025 (potential cycle top or reversal trigger)
📊 Technical Analysis
Trend: Strong rally from late April into early May; now facing exhaustion
Resistance: Around $104,000–$105,000
Bearish Divergence Risk: Price is rising steeply; volume appears to be thinning — potential blow-off top
Projected Move:
Green arrow suggests an impulse sell-off expected soon — a likely correction from the top zone toward:
Target 1: $98,500 (early support)
Target 2: $94,000
Target 3: $91,500–$90,000 (major support)
🌐 Macro Triggers to Watch
CPI Data (May 15, 2025): U.S. inflation print could cause a sharp BTC move
USDT Dominance / DXY: Watch stablecoin inflows or dollar strength
ETF Flows or Outflows: Any institutional outflow could accelerate the correction
🧠 Final Insight
The chart suggests caution for bulls and readiness for a profit-taking wave. A parabolic move often ends with a sharp pullback. Confirmation below $102K can be a key trigger for the sell-off projection.

BTC - Eyes on Correction, Consolidation, & Fresh BreakoutMay 10, 2025 – WaveNodes Desk Report
BTC has surpassed AI Target 3, signaling strong bullish momentum. However, with the move now extended and the AI state showing imbalance, a phase of correction or consolidation is likely. Traders are advised to wait for a fresh breakout from new AI demand or supply zones before taking the next position.
Price action is now in "Imbalanced" territory. With volatility high at 302.72 PPB, yet below the "Good Volatility" threshold of 314.69 PPB, traders are likely to face choppy conditions in the immediate term.
The AI engine shows a razor-thin edge between bullish and bearish sentiment:
AI Prob Green: 50.1% (+0.2) <-- Reducing now
AI Prob Red: 49.9%
This close probability split, along with no current AI Trap Alert, implies an environment ripe for consolidation or minor correction rather than aggressive continuation — unless a new breakout emerges from fresh AI-defined demand or supply zones.
Key levels to watch:
Next re-entry opportunities hinge on whether price can retest the Impact Range at 95601.70 – 95915.63, or break above fresh supply zones that form post-Target 3.
Full hedge zone remains at 95776.93, serving as a critical downside invalidation area.
In summary: BTC has met its upward targets, and with the AI engine entering a balanced state, traders should now await a new structural cue — either from demand absorption or supply rejection — before initiating fresh positions.

BTC/USD – Daily Trade Plan | 10 May 2025🟢 BTC/USD – Daily Trade Plan | 10 May 2025
"Breakout Incoming? Price Coiling Tighter Near Key Resistance!"
🔍 Market Overview:
Bitcoin has shown strong upward momentum after breaking past the $99,000 mark, reaching a short-term high at $104,269.47. Since then, price has consolidated within a narrowing range. The daily structure remains bullish, but short-term selling pressure is visible — especially ahead of the weekend and macro uncertainty.
🧭 Technical Landscape:
🔺 Resistance Zones:
$104,269.47 – Local top, price has failed to break this level several times.
$105,765 – $106,917 – Previous rejection zone + Fibonacci confluence.
$108,045 – Possible extension target if breakout confirms.
🔻 Support Zones:
$102,301 – Immediate intraday support; likely first retest.
$99,379 – Strong mid-range support, aligned with Moving Average & FVG.
$97,093 – Long-term trendline & high-demand zone.
📊 Scenario 1: Bullish Breakout Continuation
If BTC holds above $102,300 and breaks H4 resistance:
🔵 Buy Entry: $102,500 – $102,300
🎯 Targets: $104,000 → $105,700 → $106,900 → $108,000
🛑 Stop Loss: $101,800
📉 Scenario 2: Liquidity Grab & Deep Pullback
If BTC loses $102,300 support, expect a move to collect liquidity around $99K:
🔵 Buy Entry: $97,200 – $97,000
🎯 Targets: $99,000 → $101,000 → $102,500
🛑 Stop Loss: $96,400
⚠️ Key Market Considerations:
🧊 DXY Recovery: Short-term USD strength may cap BTC upside.
🏦 Fed Policy Tone: Remains hawkish. Any USD volatility can shift crypto sentiment.
🔼 Long-Term Trend: Still bullish. Focus on buy-the-dip setups rather than chasing highs.
📝 Final Thoughts:
Bitcoin is entering a coiled zone, awaiting high-volume confirmation. Breakouts or sharp rejections from the current range will decide the next leg.
🚀 Stay patient — Wait for clean candle closes (H4 preferred)
🔒 Stick to your SL/TP — Discipline defines success
💡 Avoid mid-range FOMO. Let price tell the story.

Bitcoin looks bullish BTC looks bullish with volume and ascending in price , given with targets and safe exits, Just for educational purpose

Bitcoin 4H Technical Analysis Bullish Continuation Toward $111kCurrent Price Context:
BTC/USD: $103,696.63
EMA (70): $96,211.07
Trend: Bullish 📈
---
Key Zones & Analysis:
1. RBR Zone (Demand Zone) 💙
Price Range: $95,435.39 – $97,986.81
This area is a bullish support zone where price previously consolidated before the breakout.
Potential entry/buy zone 📍
If price pulls back: Bounce expected here 🔁
🟦 RBR Zone:
🔵 97,986.81
🔵 96,211.07 (EMA support)
🔵 95,435.39
---
2. Resistance / Short-Term Supply 🟥
Small blue box above current price
May cause a minor rejection before a breakout
Keep an eye out for price action signals here 👀
🟥 Resistance:
🟥 ~103,700 – 105,000
---
3. Target Zone 🎯
Main Target Point: $111,415.32
Target Range: $111,281.04 – $112,959.60
If price breaks above resistance, this is the next major target
Take profit zone 💰
🎯 Target Area:
🔵 111,281.04
🔵 111,415.32
🔵 112,959.60
---
Possible Price Path:
1. 🔼 Break above current resistance
2. 🔁 Or pull back to RBR zone
3. 🎯 Final move toward target zone

BTC next bull cycle has just started!The bull cycle for BINANCE:BTCUSDT is different.
While everyone waited to start the cycle in December 2024, the actual cycle is starting now.

Bitcoin 101000 Target hit ,next 104800 and 107500 , How to take trades using Harmonic pattern projection Trade setup is explained below :-
Entry : 1st SL point : 0% is recent top or bottom.
Trailing D: 15.1% is work as trailing SL of buy or sell trade if hit then we have to book profit
.If price goes below 2nd D 22.5% to 24.5% range then early traders can make fresh reversals trade after breaking 1st D 15.1% safe traders can reversal trade after breaking Point D 22.5.4% to 24.5% range
Targets :
Target T1 : 36.1% to 38.3%
Target T3 : 49.1% to 52.5%
T3: 60.9% to 64.8% is our 3rd Target since this is reversal zone so must book profit if break then take fresh trade again
Target T4 : 76.4% to 79.7%
Next Targets are 100% , 127.2% ,141.4% and final Target 161.8%.
How to take reversal trade :
If price going upside/ downside then then buy or sell levels appear on Chart ( Automatically show when price reach any reversal zone of harmonic projection ).
Trailing SL:
After reach 1st Target trail SL to just above or below cost ( for example we are holding sell trade from 100 1st Target 110 hit then move trailing sl to 104-105 and move SL as price move upside or Downside)
Re- Entry :
For Re-entry in any pull back Point D ( 15.1% ) is used for re-entry then SL recent high or low Point SL ( 0% ) .
Blue Line is 1st support/ Resistance
Green line is 2nd support/ resistance
Red line is 3rd Support/ resistance

Bitcoin At Big Resistance level so What Next?#BTC/USDT Update – Price at Critical Resistance
The chart structure remains unchanged from our previous update.
🔸 After entry, price dipped ~5% below our zone, but has now printed a strong bullish candle, signaling potential upside momentum.
🔸 However, Bitcoin is currently trading at the upper boundary of the ascending channel, acting as resistance.
Key Level to Watch:
If the HTF candle closes above $99,500, it will signal strength, and I’ll consider closing short positions and initiating fresh long setups.
Important Note:
The current pattern resembles a liquidity trap, not a clean bullish continuation. That’s why I remain cautious.
✅ Plan:
🔸 Wait for confirmation > $99,500
🔸 Use tight stop-loss – no blind trades.
Stay sharp, monitor price action closely.

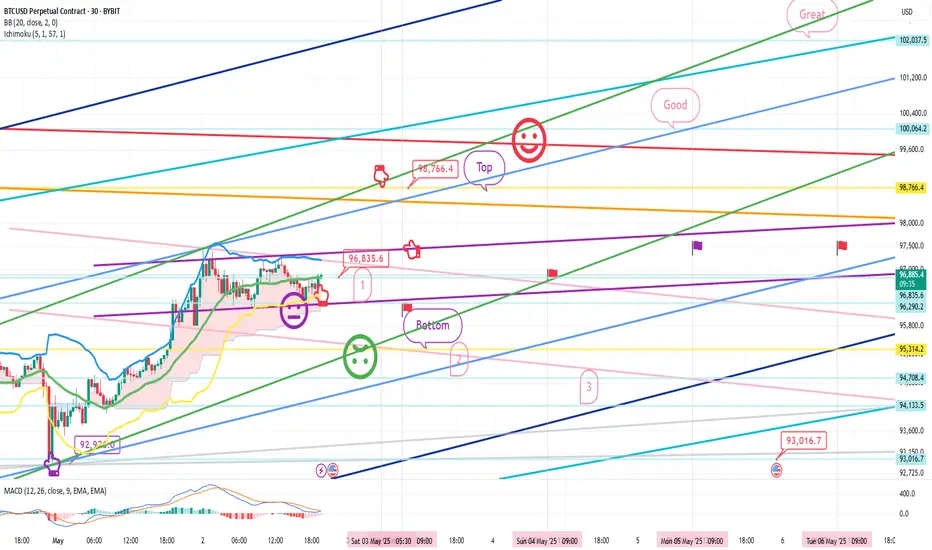
Bitcoin Bybit chart analysis May 2 Hello
It's a Bitcoinguide.
If you have a "follower"
You can receive comment notifications on real-time travel routes and major sections.
If my analysis is helpful,
Please would like one booster button at the bottom.
Here is the Bitcoin 30-minute chart.
There will be an indicator announcement at 9:30 in a little while.
Unlike Nasdaq, Bitcoin touched the upper Bollinger Band first and is on the verge of an upward trend.
Since there is a possibility of missing the entry point at the current position,
I set the stop loss price short and proceeded aggressively.
*One-way long position strategy when the red finger moves
1. Pursuit purchase at $96,835.6 / When the purple support line is broken,
or when the bottom section is touched, stop loss price
2. Long position target price at $98,766.4 -> Good 2nd target -> Great 3rd target
If the Great section is broken at the top,
the probability of a new high price is high.
From the bottom touch, the mid-term pattern will be broken
(currently 6+12 in progress)
When looking at the candle shape, from the green support line bottom breakout
It can break out strongly, so please refer to the bottom 2, 3 times up to 93016.7 dollars, and if 93K breaks, a downward trend can be connected again, so
You should be careful.
I left the analysis article up to May 6th
and the main points and the drawing section on one page, so it's hard
Please just refer to and use my analysis article up to here
I will see you next week after the holiday.
Thank you.
BITCOIN ON THE MOVE - BULLS IN CHARGE OR A TRAP AHEAD?Symbol - BTCUSD
CMP - 96000
BTCUSD has reached a new local high of 97900. The overall market structure remains constructive. However, its sustainability continues to be influenced by macroeconomic fundamentals and the performance of the S&P 500 index.
Recent gains have been supported by improvements in the US tariff landscape and the ongoing stabilization of US-China relations. Bitcoin's rally was further reinforced by the concurrent rise in the SPX 500, with which it maintains a relatively strong correlation. During the second half of this week, BTCUSD broke out of a two week consolidation phase, surpassing the resistance level at 95500 and establishing a new local high. A corrective movement is now developing within the confines of the existing upward channel.
The 95000 level represents a key liquidity and risk zone. If bullish momentum sustains above this threshold during a potential retest, the upward trend is likely to persist in the short to medium term. Conversely, a decisive break below 95000 may lead to a deeper decline toward the 92000–88000 range.
Resistance levels: 97425, 99475
Support levels: 95500, 92000
Market attention is focused on the 95500 support level, beneath which a significant liquidity pool has accumulated. Continued growth may result from a retest-induced rebound or a market imbalance favoring buyers. However, caution is warranted as upcoming economic data releases may significantly influence price action.
Important note: A return to the sell zone below 95000–95500, accompanied by an inability to sustain upward momentum, could lead to a broader correction and potential liquidation events.

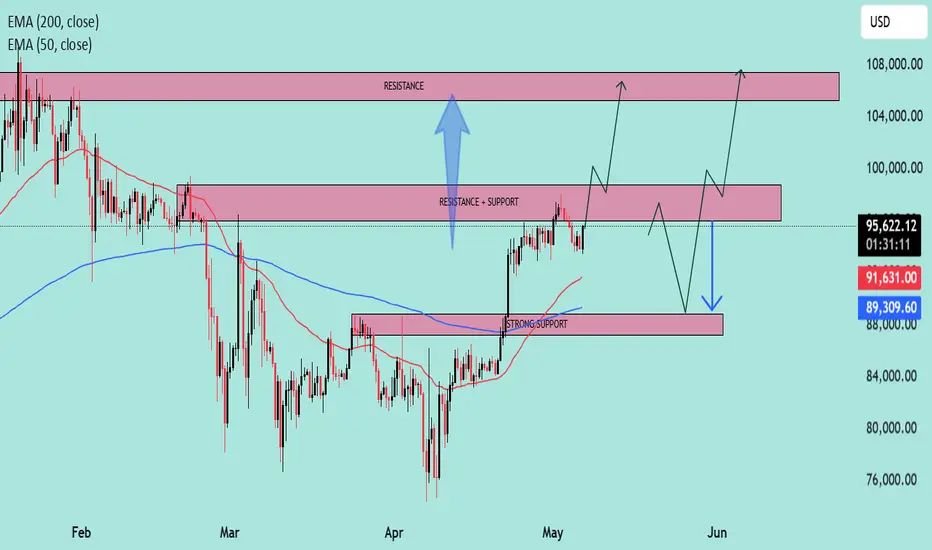
BTC at Key Inflection Zone – Breakout or Rejection Ahead?Asset: BTC/USD
Timeframe: 4H or Daily (based on visual pattern structure)
As of: May 6, 2025
Indicators:
50 EMA (Red): $91,615.79
200 EMA (Blue): $89,305.75
Key Technical Zones:
🔴 Resistance Zone: ~$104,000 – $108,000
This area has historically acted as a major supply zone.
Price has been rejected from this level multiple times, indicating strong selling pressure.
🔁 Flip Zone (Resistance turned Support/Support turned Resistance): ~$95,500 – $100,000
The current price ($95,234.23) is testing this zone from below.
A confirmed break and hold above could signal continuation toward the higher resistance.
🟢 Strong Support Zone: ~$88,000 – $91,000
Confluence of 50 EMA and 200 EMA adds strength to this demand zone.
Previous breakout level and accumulation area.
EMA Outlook:
50 EMA > 200 EMA: Short-term bullish crossover is active, indicating bullish momentum.
Both EMAs are sloping upward slightly, suggesting trend strengthening.
Price is currently above both EMAs, which acts as dynamic support.
Potential Scenarios:
✅ Bullish Scenario:
If price reclaims the $95,500–$100,000 resistance-turned-support zone:
Expect upward momentum to continue.
Target: $104,000–$108,000 zone.
Break of $108K could lead to a macro bull continuation.
⚠️ Bearish Scenario:
If price rejects the current zone and fails to hold above the $91,000 support:
Look for retest of $88,000–$89,000 area (confluence with EMAs).
Breakdown below that zone would invalidate bullish structure and signal potential deeper correction.
Summary:
Bias: Bullish above $91K, Neutral between FWB:88K –$91K, Bearish below $88K.
Key Confirmation Needed: Daily close above $100,000 for strong bullish continuation.
Risk Management: Watch for fakeouts within the $95K–$100K range due to past volatility.
Bitcoin Ready to Dump Again till $85000?CRYPTOCAP:BTC just tapped a key Short POI near resistance!
Bears stepping in hard below $99,550 — this is prime sniper zone.
▶️ Trade Setup (SMC x ICT):
▶️ Entry: $93,800–94,200
▶️ Targets: $90,000 → $86,000
▶️ Stop Loss: $99,600 (above structure)
Liquidity swept ✅
FVGs below ✅
Momentum shifting ✅
