Bitcoin upmove will continue until 91500 not break 96990 targetHow to take trades using Harmonic pattern projection Trade setup is explained below :-
Entry : 1st SL point : 0% is recent top or bottom.
Trailing D: 15.1% is work as trailing SL of buy or sell trade if hit then we have to book profit
.If price goes below 2nd D 22.5% to 24.5% range then early traders can make fresh reversals trade after breaking 1st D 15.1% safe traders can reversal trade after breaking Point D 22.5.4% to 24.5% range
Targets :
Target T1 : 36.1% to 38.3%
Target T3 : 49.1% to 52.5%
T3: 60.9% to 64.8% is our 3rd Target since this is reversal zone so must book profit if break then take fresh trade again
Target T4 : 76.4% to 79.7%
Next Targets are 100% , 127.2% ,141.4% and final Target 161.8%.
How to take reversal trade :
If price going upside/ downside then then buy or sell levels appear on Chart ( Automatically show when price reach any reversal zone of harmonic projection ).
Trailing SL:
After reach 1st Target trail SL to just above or below cost ( for example we are holding sell trade from 100 1st Target 110 hit then move trailing sl to 104-105 and move SL as price move upside or Downside)
Re- Entry :
For Re-entry in any pull back Point D ( 15.1% ) is used for re-entry then SL recent high or low Point SL ( 0% ) .
Blue Line is 1st support/ Resistance
Green line is 2nd support/ resistance
Red line is 3rd Support/ resistance
BTCUSD.P trade ideas
BTC ANALYSISLooking for Long Position on a DIP to $88700 zone or Breakout of 94700 so inshort BTC is stuck in range of 6000 Pts. Hopefully the breakout will be very strong.
Keep a watch 2 probabilities already mentioned on chart.
Disclaimer: We are SEBI & NISM Certified but not registered hence do your own analysis before trading or investing. We are also not responsible for your profits or losses in Crypto markets.

Real Success Rates of the Falling Wedge in TradingReal Success Rates of the Falling Wedge in Trading
The falling wedge is a chart pattern highly valued by traders for its potential for bullish reversals after a bearish or consolidation phase. Its effectiveness has been extensively studied and documented by various technical analysts and leading authors.
Key Statistics
Bullish Exit: In 82% of cases, the exit from the falling wedge is upward, making it one of the most reliable patterns for anticipating a positive reversal.
Price Target Achieved: The pattern's theoretical target (calculated by plotting the height of the wedge at the breakout point) is achieved in approximately 63% to 88% of cases, depending on the source, demonstrating a high success rate for profit-taking.
Trend Reversal: In 55% to 68% of cases, the falling wedge acts as a reversal pattern, signaling the end of a downtrend and the beginning of a new bullish phase.
Pullback: After the breakout, a pullback (return to the resistance line) occurs in approximately 53% to 56% of cases, which can provide a second entry opportunity but tends to reduce the pattern's overall performance.
False Breakouts: False exits represent between 10% and 27% of cases. However, a false bullish breakout only results in a true bearish breakout in 3% of cases, making the bullish signal particularly robust.
Performance and Context
Bull Market: The pattern performs particularly well when it appears during a corrective phase of an uptrend, with a profit target reached in 70% of cases within three months.
Gain Potential: The maximum gain potential can reach 32% in half of cases during a bullish breakout, according to statistical studies on equity markets.
Formation Time: The wider the wedge and the steeper the trend lines, the faster and more violent the post-breakout upward movement will be.
Comparative Summary of Success Rates:
Criteria Rate ..........................................Observed Frequency
Bullish Exit ........................................................82%
Price Target Achieved ........................................63% to 88%
Reversal Pattern ..............................................55% to 68%
Pullback After Breakout .....................................53% to 56%
False Breakouts (False Exits) ...............................10% to 27%
Bullish False Breakouts Leading to a Downside ..............3%
Points of Attention
The falling wedge is a rare and difficult pattern to correctly identify, requiring at least five contact points to be valid.
Performance is best when the breakout occurs around 60% of the pattern's length and when volume increases at the time of the breakout.
Pullbacks, although frequent, tend to weaken the initial bullish momentum.
Conclusion
The falling wedge has a remarkable success rate, with more than 8 out of 10 cases resulting in a bullish exit and a price target being reached in the majority of cases. However, it remains essential to validate the pattern with other technical signals (volume, momentum) and to remain vigilant against false breakouts, even if their rate is relatively low. When mastered, this pattern proves to be a valuable tool for traders looking for optimized entry points on bullish reversals.
Bitcoin Scalping Strategy with 21/24 Trend Dashboard Title:
Bitcoin Scalping Strategy with 21/24 Trend Dashboard — Ultra-Clear Entry & Exit
Looking for clear, fast trade entries on BTC?
This scalping setup using the Trend Matrix Multi-Timeframe Dashboard by TechnoBlooms simplifies decision-making by compressing trend signals into one powerful grid.
⸻
Scalping Logic:
→ Enter a position when 21 or more out of 24 signals point in the same direction.
→ Exit the trade when 5 or more signals flip or diverge.
This rule-based setup is ideal for scalpers who need fast confirmations on fast charts like 1m, 3m, 5m, and 15m.
⸻
Chart Setup:
• Asset: BTC/USD
• Timeframe: 15 Minutes (scalping)
• Tool: Trend Matrix MTF Dashboard
• Dashboard Configuration:
• 6 Indicators × 4 Timeframes = 24 signals
• Timeframes: 1M, 2M, 3M, 5M
⸻
Why It Works:
This dashboard simplifies complex analysis by combining multiple trusted indicators into a single view. It helps avoid hesitation, misreads, or false setups — and gives scalpers green-light moments to strike.
⸻
Indicators Used in Dashboard:
• MACD – Momentum & trend crossovers
• EMA – Fast-moving dynamic trend bias
• RSI – Momentum strength & reversals
• Bollinger Bands – Volatility squeeze & trend pressure
• Supertrend – Strong trailing trend confirmation
• PVT – Volume-backed trend strength
⸻
Scalping Entry Flow:
1. Watch for 21+ signals to align (all ▲ or ▼).
2. Enter a trade in the same direction.
3. Monitor for any divergence.
4. Exit when 5+ signals flip.
This strategy helps avoid premature entries and keeps you on the right side of momentum.
⸻
#BTCUSD #BitcoinScalping #ScalpBTC #TrendMatrix #TechnoBlooms #ScalpingSignals #MultiTimeframe #DashboardTrading #DayTradingTools #CryptoScalping

Bitcoin's side ways or bearish ?!I think that Bitcoin is still moving in sideways in higher time frame.
It's most likely to go back to 80k range or even 70k range.
Long way btw. Might take days, jFYI.

BTC/USD) Trend channel analysis setup Read The ChaptianSMC Trading point update
technical analysis of Bitcoin (BTC/USD) on the 1-hour timeframe. It showcases a potential breakout continuation vs. pullback scenario, depending on how price reacts around a key short-term resistance area.
---
Key Observations:
1. Current Price:
$93,754 — Price is consolidating just below a local high.
2. Support and Resistance Zones:
Support BOS (Break of Structure): Around the $87,351 level, highlighted in yellow.
Upper Target Zone: $98,954–$98,983
200 EMA: Near $86,926, offering dynamic support.
3. Two Possible Scenarios:
A. Bullish Continuation:
If the price holds above the immediate structure and breaks out of the short-term consolidation near the top:
It may surge toward the upper target zone ($98,983).
This aligns with the ascending channel and continuation pattern.
B. Bearish Pullback:
If the price fails to sustain above the resistance area:
A correction down to the support BOS zone (~$87,351) is likely.
This pullback may be temporary, potentially offering a re-entry zone for bulls.
4. RSI Analysis (Bottom of Chart):
RSI is showing signs of bearish divergence (price making higher highs while RSI makes lower highs).
This suggests momentum is weakening, and a short-term pullback could occur.
---
Trade Ideas:
Long Setup (Breakout):
Entry: Above recent high (~$94,500).
Target: ~$98,950
Stop Loss: Below ~$92,000
Short Setup (Rejection):
Entry: Rejection near ~$94,000–$94,500
Target: ~$87,350
Stop Loss: Above ~$94,800
Mr SMC Trading point
---
Summary:
This analysis reflects a critical decision point for BTC/USD. Price is nearing a local high with RSI divergence suggesting a pullback may come first — but if buyers remain strong and break resistance, a continuation toward GETTEX:98K is likely. Wait for confirmation of direction before entering.
Pales support boost 🚀 analysis follow)

Bitcoin Bybit chart analysis April 22Hello
It's a Bitcoinguide.
If you have a "follower"
You can receive comment notifications on real-time travel routes and major sections.
If my analysis is helpful,
Please would like one booster button at the bottom.
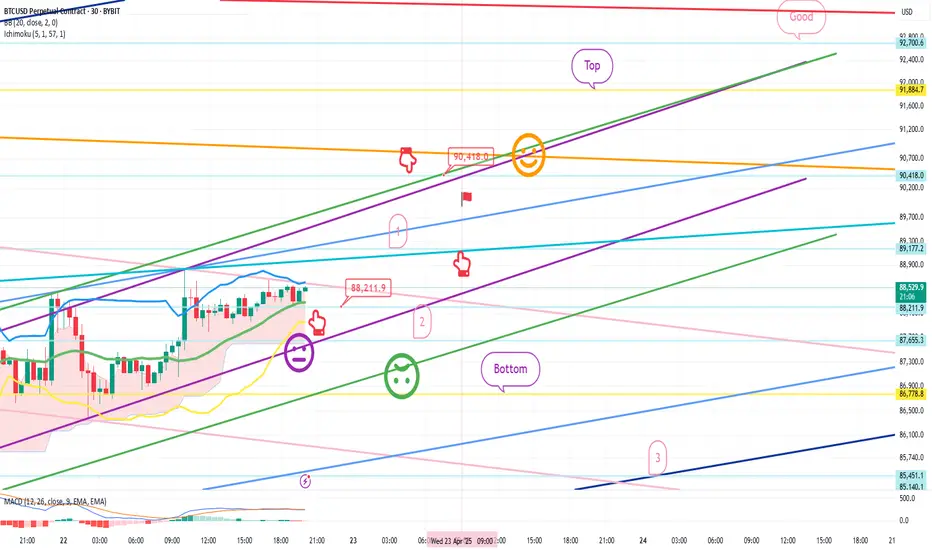
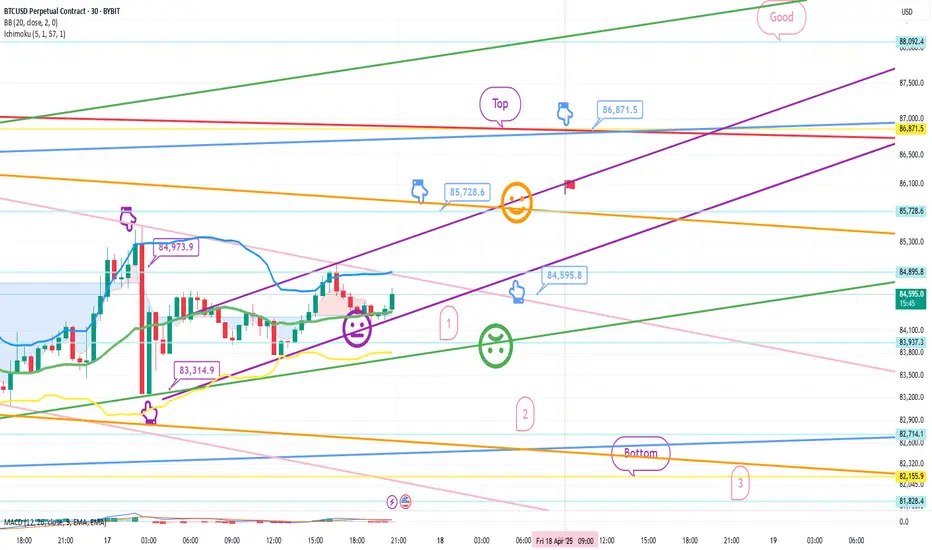
This is the Bitcoin 30-minute chart.
There is no Nasdaq indicator announcement.
Tether dominance is in a vertical decline.
First, I ignored Nasdaq and focused on Bitcoin based on my perspective on recent movements.
In the case of Bitcoin, I proceeded with a conservative strategy when the short-term pattern was broken.
*One-way long position strategy when the red finger moves
1. 88,211.9 dollars long position entry section / cut-off price when the green support line is broken
2. 90,418 dollars long position 1st target -> Top 2nd target
If the strategy is successful, the 1st section at the top
can be used as a long position re-entry section,
but from the Top section -> Good section, it is the center line of the weekly Bollinger Band chart,
so there is a possibility of a strong adjustment this week.
Section 1 at the top and section 2 at the bottom are extreme horizontal support sections.
If section 2 is broken, it is a section where the short-term pattern is broken,
and since the bottom touch at the bottom is the lowest point of the daily chart,
it is not good,
and since the support line is open, it can be directly connected to section 3.
Up to this point, I ask that you simply refer to and use my analysis,
and I hope that you operate safely with principle trading and loss cut prices.
Thank you.
Will BTC fill 78k CME gap and reach 75k for the C waveCrypto market has been crazy this cycle
A lot of memes got listed for many milions dollars
But not other coin like Gaming, RwAs
I guess the market is so early for overvalued project just pumped randomly like Dotcom bubble 2008.
The Crypto bubble needs to implode so that quality project, real application, real uses can stay.
Crypto Bubble.

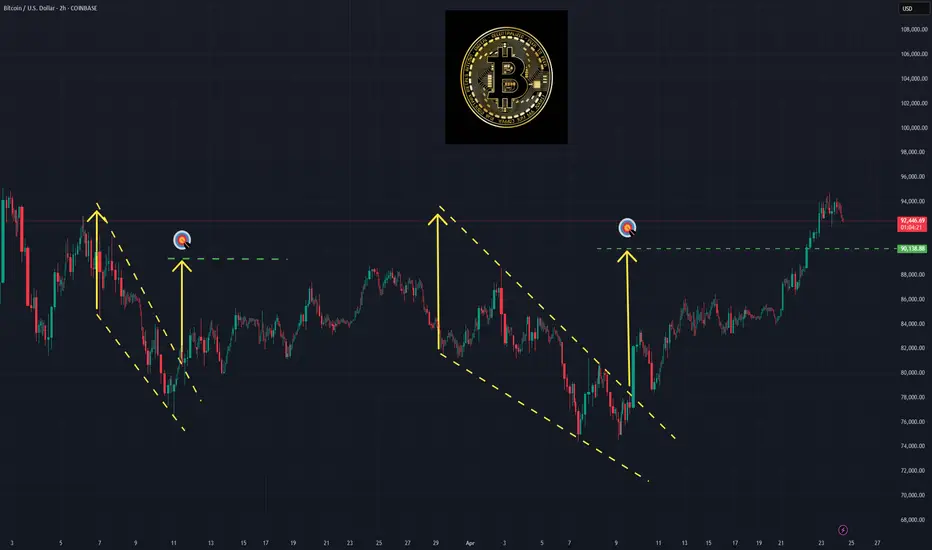
BTC/USD 1H – Bullish Breakout with FVG Entry & $91K TargetChart Breakdown:
📈 Trend Structure:
BTC is moving in an ascending channel with:
🔵 Resistance Line on top
🟢 Support Line below
🔁 Recently, it broke out above the resistance with a bullish move!
Key Zones & Levels:
🟦 Fair Value Gap (FVG)
This is your potential buy zone:
✅ Entry Point: $86,135
❌ Stop Loss: $85,098
🎯 Target: $91,000
📌 Plan:
Wait for price to retrace into the FVG zone
Look for a bullish bounce ✅
Enter long at $86,135
Set your SL and target accordingly
Risk-Reward Setup:
Risk: Small (below FVG zone) ❗
Reward: Big upside toward $91,000 🚀
Gain Potential: +5.74% ($4,948 per BTC)
Visual Flow:
1️⃣ Price breaks resistance 🔼
2️⃣ Pullback expected to FVG 🔽
3️⃣ Entry triggers around $86,135
4️⃣ Targeting moon shot to $91K 🌕
Conclusion:
This setup shows a bullish continuation with solid RR.
If BTC holds the FVG on a retest, the move to $91K looks likely!

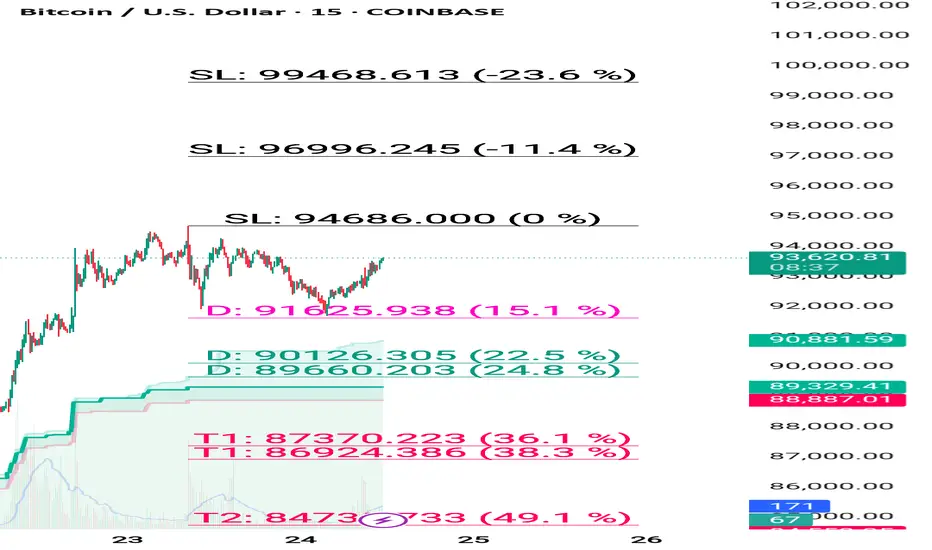
Bitcoin many times buy given near 82500 , 93000 Target hit How to take trades using Harmonic pattern projection Trade setup is explained below :-
Entry : 1st SL point : 0% is recent top or bottom.
Trailing D: 11.4% is work as trailing SL of buy or sell trade if hit then we have to book profit
.If price goes below 2nd D 21.4% to 23.6% range then early traders can make fresh reversals trade after breaking 1st D 11.4% safe traders can reversal trade after breaking Point D 21.4% to 23.6% range
Targets :
Target T1 : 35.1% to 38.3%
Target T3 : 49.1% to 53.2%
T3: 60.9% to 64.8% is our 3rd Target since this is reversal zone so must book profit if break then take fresh trade again
Target T4 : 76.4% to 79.7%
Next Targets are 100% , 127.2% ,141.4% and final Target 161.8%.
How to take reversal trade :
If price going upside/ downside then then buy or sell levels appear on Chart ( Automatically show when price reach any reversal zone of harmonic projection pattern based .
After showing reversal levels wait for confirmation until 21.4% or 28.3 % level not break if break then exit from current buy / sell trade and take fresh reverse trade buy/ sell .
Trailing SL:
After reach 1st Target trail SL to just above or below cost ( for example we are holding sell trade from 100 1st Target 110 hit then move trailing sl to 104-105 and move SL as price move upside or Downside)
Re- Entry :
For Re-entry in any pull back Point D ( 11.4% ) is used for re-entry then SL recent high or low Point SL ( 0% ) .
Blue Line is 1st support/ Resistance
Green line is 2nd support/ resistance
Red line is 3rd Support/ resistance

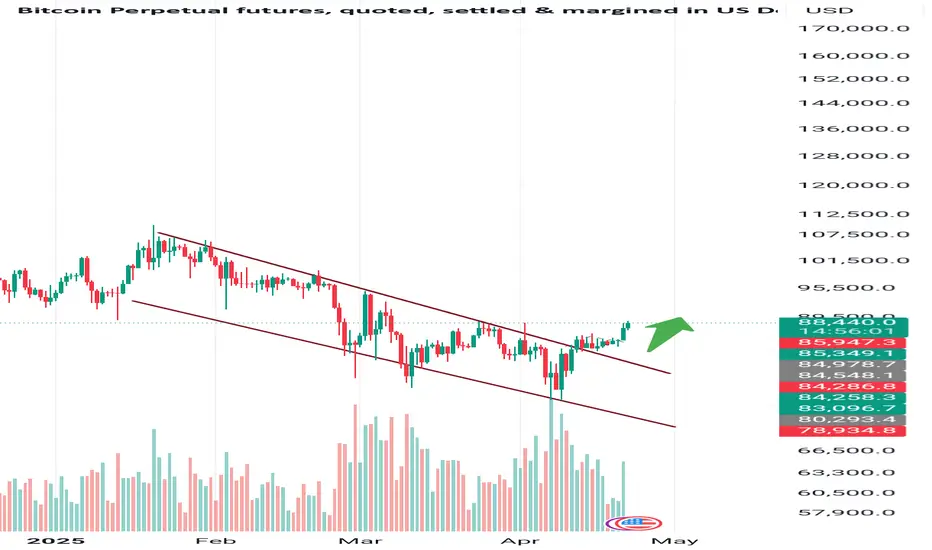
Bitcoin Daily Breakout – Trend Reversal in Play?BTCUSD | Breakout Alert!
Bitcoin has been trading within a downward channel on the daily chart, but today it has finally broken out to the upside with strong momentum. This breakout could signal the beginning of a bullish move. If the breakout sustains above key resistance levels, BTC has significant potential to move higher in the coming days. Keep an eye on the volume and price action for confirmation.
Targets & Key Levels:
Next Target: 110000++
Support: 80000
Stay cautious and manage your risk accordingly!
#BTCUSD #Bitcoin #CryptoBreakout #TechnicalAnalysis #CryptoTrading #BTC #CryptoCharts #BullishBreakout #PriceAction #TradingView
Bitcoin Bybit chart analysis April 17Hello
It's a Bitcoinguide.
If you have a "follower"
You can receive comment notifications on real-time travel routes and major sections.
If my analysis is helpful,
Please would like one booster button at the bottom.
This is the Bitcoin 30-minute chart.
Nasdaq indicators will be announced at 9:30 in a little while.
The purple finger section on the left
is connected to the short->long switching section that was performed on the 16th.
* When the blue finger moves,
Bidirectional neutral
Short->long switching strategy or long waiting if it goes down right away.
1. 85,728.6 dollars short position switching / cut-off price when orange resistance line is broken
2. 84,595.8 dollars long position switching / cut-off price when green support line is broken
3. 86,871.5 dollars long position 1st target -> Good 2nd target
Today's 12-hour chart MACD dead cross is an ignoring strategy. Check if the purple support line deviates from the current position,
and from the 1st section of the green support line deviates,
even those who have been holding long positions since yesterday can operate at the same stop loss price.
If the short position entry section at the top comes down without touching,
the 2nd section at the bottom is the final long waiting section (6+12 pattern),
and if the rebound is not good in this section and it is pushed,
it may continue to fall to the 3rd section at the bottom due to the pressure of the 12-hour chart MACD dead cross.
Up to this point, please use my analysis article only for reference and use,
and I hope you operate safely with the principle trading and stop loss price.
Thank you.
BTCUSD READY TO FLY 4200 POINTS 84830 TO 89000+++BTCUSD strong zone above only 84830
There is no resistance upto 89000
Wait for active mode
Buy above 84830................
Stoploss..........................84400....430 points
Target1..........................87000.....2170 points
Target2..........................89000.....4170+ points
Disclaimer - This level only for education purpose . Do ur own analysis

Bitcoin buy given many times @82000, 87800 Target hit 91500 nextHow to take trades using Harmonic pattern projection Trade setup is explained below :-
Entry : 1st SL point : 0% is recent top or bottom.
Trailing D: 11.4% is work as trailing SL of buy or sell trade if hit then we have to book profit
.If price goes below 2nd D 21.4% to 23.6% range then early traders can make fresh reversals trade after breaking 1st D 11.4% safe traders can reversal trade after breaking Point D 21.4% to 23.6% range
Targets :
Target T1 : 35.1% to 38.3%
Target T3 : 49.1% to 53.2%
T3: 60.9% to 64.8% is our 3rd Target since this is reversal zone so must book profit if break then take fresh trade again
Target T4 : 76.4% to 79.7%
Next Targets are 100% , 127.2% ,141.4% and final Target 161.8%.
How to take reversal trade :
If price going upside/ downside then then buy or sell levels appear on Chart ( Automatically show when price reach any reversal zone of harmonic projection pattern based .
After showing reversal levels wait for confirmation until 21.4% or 28.3 % level not break if break then exit from current buy / sell trade and take fresh reverse trade buy/ sell .
Trailing SL:
After reach 1st Target trail SL to just above or below cost ( for example we are holding sell trade from 100 1st Target 110 hit then move trailing sl to 104-105 and move SL as price move upside or Downside)
Re- Entry :
For Re-entry in any pull back Point D ( 11.4% ) is used for re-entry then SL recent high or low Point SL ( 0% ) .
Blue Line is 1st support/ Resistance
Green line is 2nd support/ resistance
Red line is 3rd Support/ resistance

Will Bitcoin Hit $1 Million in Future?Everyone’s Scared of #Bitcoin Red Candles... I see Opportunity.
1⃣ This ain’t just a dip — it’s a Discounted future begging to be Grabbed.
2⃣ My Chart will Age like fine wine 🍷
3⃣ Buy fear. Stack smart.
4⃣ In a few years, You'll wish you did.
Let the smart money eat. 🚀
NFA & DYOR

BTC PlanBTC has just dropped 35% the same rate as previous bull market.
There are two scenarios:
1. BTC pulls off the Classic Deadcat Bounce.
- When BTC reaches the level of Golden Area of Fibo: 0.618-0.786 and do not create any INCREASE INERTIA: Run for your life. This time ALTS will Pump hard -> GET OUT!!!!
2. BTC pulls off a FAKE DOWN:
- In Bull market, BTC can drop -35% just to shake out of all the FOMERS and Long before continuing higher. To distribute tokens, Market Maker will lure Retailers into believing some crazy targets, the FOMO did not yet to appear on this Cycle.
- Signs: The recover after this drop: creating the INCREASING INERTIA on hourly, daily timeframe -> Bull market back on track.

BUY BTCUSDIn my opinion, I am looking for buying BTCUSD in areas of strong Support zone.
you have to make your on small timeframe entry pattern Make your entry decisions based on facts and not on emotions. Monitor your trades and adjust them as needed. Be patient and stay focused

BTC - wait bull trap and bear trapWait for confirmation of bull trap closing below liquidity line then sell
Wait for confirmation of bear trap closing above liquidity line then buy
--
Trade carefully

btcusdTradingView India. Watch live Bitcoin to Dollar chart, follow BTCUSD prices in real-time and get bitcoin price history. Check the Bitcoin technical analysis ...

Bitcoin buy on dip near support 82800-81900 , Target 91800-93500How to take trades using Harmonic pattern projection Trade setup is explained below :-
Entry : 1st SL point : 0% is recent top or bottom.
Trailing D: 11.4% is work as trailing SL of buy or sell trade if hit then we have to book profit
.If price goes below 2nd D 21.4% to 23.6% range then early traders can make fresh reversals trade after breaking 1st D 11.4% safe traders can reversal trade after breaking Point D 21.4% to 23.6% range
Targets :
Target T1 : 35.1% to 38.3%
Target T3 : 49.1% to 53.2%
T3: 60.9% to 64.8% is our 3rd Target since this is reversal zone so must book profit if break then take fresh trade again
Target T4 : 76.4% to 79.7%
Next Targets are 100% , 127.2% ,141.4% and final Target 161.8%.
How to take reversal trade :
If price going upside/ downside then then buy or sell levels appear on Chart ( Automatically show when price reach any reversal zone of harmonic projection pattern based .
After showing reversal levels wait for confirmation until 21.4% or 28.3 % level not break if break then exit from current buy / sell trade and take fresh reverse trade buy/ sell .
Trailing SL:
After reach 1st Target trail SL to just above or below cost ( for example we are holding sell trade from 100 1st Target 110 hit then move trailing sl to 104-105 and move SL as price move upside or Downside)
Re- Entry :
For Re-entry in any pull back Point D ( 11.4% ) is used for re-entry then SL recent high or low Point SL ( 0% ) .
Blue Line is 1st support/ Resistance
Green line is 2nd support/ resistance
Red line is 3rd Support/ resistance

Is it possible ?This chart shows BTC is in a sideways accumulation phase with bullish bias, supported by the rising 30-period EMA. The RSI indicates there's room to move higher without being overbought yet. We may be eyeing a breakout above resistance (~$85,800–$85,900 zone).

BITCOIN back in action to new all time high!!!As per my analysis shows in the charts.
Btc is already breaking the levels and accumulating for days to shoot up higher.
My target is 103.5k and new all time high.
Just my view, the action should be taken by next week or else regret will sink you.
Price action already shows lots of valid points to go higher.
I think next week some big news will come. But price will show you before it comes.
Like and comment genuinely if you feel this will happen. If not just chill with summer.

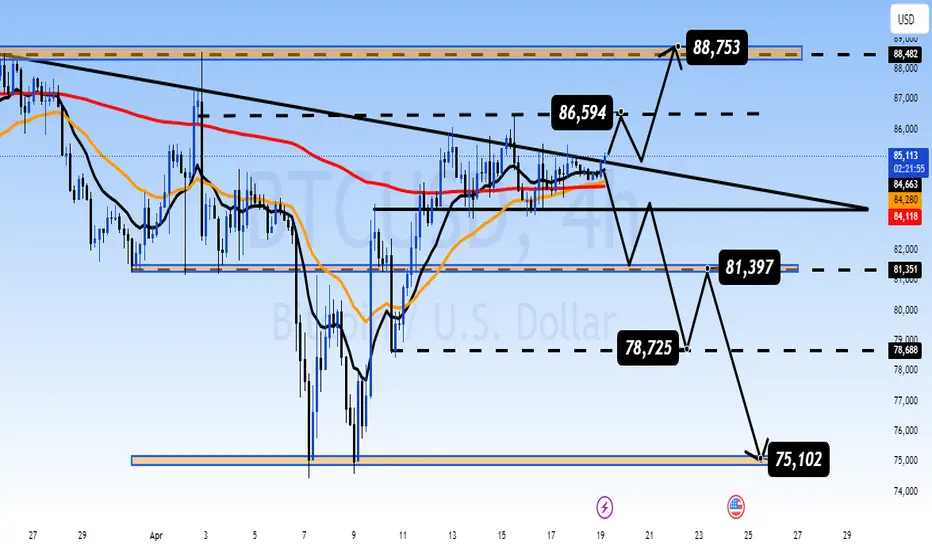
Consolidation Phase Before Breakout – Key Levels to Watch Bitcoin Technical Analysis: Consolidation Phase Before Breakout – Key Levels to Watch 📈💰
Market Overview: Bitcoin (BTC/USD) is currently navigating through a consolidation phase, forming a symmetrical triangle pattern on the 4-hour chart. The price action has been fluctuating between significant resistance at 86,594 and support at 78,725. As we approach the apex of the triangle, volatility is expected to rise, and a breakout from this range could set the direction for the next major move in Bitcoin's price.
Key Technical Levels:
Resistance: 86,594, 88,753
Support: 78,725, 75,102
Technical Indicators:
Bitcoin is holding above both the 50-day and 200-day moving averages (MA), confirming the overall bullish structure in the market. The price’s proximity to key resistance levels suggests that BTC is preparing for either a breakout or a pullback.
Currently, BTC is testing the upper trendline of the triangle, which means the market is gearing up for a potential decisive move. A break above the 86,594 level could send the price toward 88,753, and potentially higher, with 91,000 as a psychological target.
Chart Analysis:
Symmetrical Triangle Pattern: Bitcoin’s price movement has been restricted within the triangle’s boundaries. If the price breaks the 86,594 resistance, we could see BTC push to 88,753, and possibly even 91,000. However, if the breakout fails, BTC might retrace to the support levels at 78,725 or 75,102, which could provide better entry points for long positions.
The formation of the triangle indicates that the market is waiting for a clear direction. A breakout will likely be followed by a sharp movement either upwards or downwards, so traders should be prepared for a spike in volatility.
Macro Factors and Market Sentiment:
Geopolitical Tensions and Economic Uncertainty: The ongoing geopolitical tensions between major global economies, particularly the U.S. and China, have increased demand for safe-haven assets like Bitcoin. In addition, global inflation concerns continue to push investors toward digital gold as a store of value.
U.S. Federal Reserve Policies: The Fed’s actions regarding interest rates and monetary policy will have a direct impact on Bitcoin’s price. Any dovish stance or indications of more easing could benefit Bitcoin, as it is seen as a hedge against inflation and currency devaluation.
Market Outlook:
Bullish Scenario: A breakout above 86,594 could lead Bitcoin towards 88,753 and potentially 91,000. With Bitcoin’s bullish setup and safe-haven status, the next move might be strongly in favor of the bulls.
Bearish Scenario: If Bitcoin fails to break through resistance, we might see a retracement towards the support zones at 78,725 or 75,102, where buying opportunities may arise.
Trading Strategy:
BUY Zone: 78,725 - 75,102 (Look for a confirmation above support levels)
SELL Zone: 86,594 - 88,753 (Watch for a breakout above resistance for further upside)
Conclusion:
Bitcoin’s current consolidation phase has set the stage for a potential breakout. The price is testing crucial resistance levels, and the next few days could determine whether BTC will make a new push towards ATHs or pull back to retest lower levels. With the broader economic and geopolitical conditions favoring Bitcoin as a hedge, the long-term outlook remains bullish, but short-term volatility is expected.