Indian SME IPOs: High Rewards Amidst High RisksPart 1: Introduction to SME IPOs in India
Small and Medium Enterprises (SMEs) are the backbone of India’s economy, contributing significantly to employment, GDP, and innovation. Recognizing their importance, the Indian government and capital markets have encouraged SMEs to access public funding through Initial Public Offerings (IPOs). Unlike traditional IPOs on the main board, SME IPOs are specifically designed to allow smaller companies to raise capital efficiently while offering retail and institutional investors opportunities to participate in potentially high-growth ventures.
Definition and Characteristics of SME IPOs
SME IPOs are offerings of equity by small and medium enterprises listed on the SME segment of recognized stock exchanges, primarily the BSE SME and NSE Emerge platforms. The eligibility criteria for SMEs include:
Minimum net worth and profitability standards.
A track record of at least two years of operations.
Compliance with corporate governance standards.
SME IPOs typically have a lower investment size compared to mainboard IPOs, making them accessible to retail investors. The minimum application amount is often around ₹1–2 lakh, while the maximum may vary depending on the issue size.
Why SMEs Go Public
SMEs pursue IPOs for several reasons:
Capital for Expansion: SME IPOs provide companies with funds to expand operations, invest in new technology, or enter new markets.
Brand Visibility: Listing enhances a company’s visibility and credibility among clients, suppliers, and investors.
Liquidity and Exit Opportunities: Founders, early investors, and venture capitalists gain a structured exit route.
Attract Talent: A public listing makes it easier to offer stock options and attract skilled professionals.
Potential for High Rewards
SME IPOs are high-risk, high-reward opportunities. Unlike established companies, SMEs operate in niche markets or emerging sectors, meaning a successful IPO can yield significant returns. Historically, some SME IPOs have delivered returns of 50–200% within a year of listing, attracting speculative and growth-focused investors. However, it’s important to note that the risks are also higher, including market volatility, limited liquidity, and operational challenges.
Conclusion of Part 1
The SME IPO segment offers a unique avenue for investors seeking exposure to high-growth, smaller companies in India. With regulatory support, increasing investor awareness, and improved market infrastructure, SME IPOs are becoming a mainstream avenue for wealth creation.
Part 2: Regulatory Framework and Listing Process
The growth of SME IPOs in India has been facilitated by clear regulatory frameworks established by SEBI (Securities and Exchange Board of India) and the stock exchanges. These frameworks ensure investor protection while promoting SME participation in public markets.
SEBI Guidelines for SME IPOs
SEBI has set distinct rules for SMEs to streamline the IPO process:
Companies must have a post-issue capital of at least ₹10 crore.
Mandatory appointment of a merchant banker to manage the issue.
Submission of a prospectus detailing financials, business model, risks, and future plans.
Listing on SME platforms like BSE SME or NSE Emerge, not the mainboard initially.
The IPO Process for SMEs
The process for an SME IPO typically includes:
Appointment of Merchant Banker: To ensure compliance with SEBI regulations and guide the company through the listing process.
Preparation of Draft Prospectus: Includes financial statements, growth plans, risk factors, and use of IPO proceeds.
SEBI Approval: Draft prospectus is submitted to SEBI for review and approval.
Pricing and Marketing: The IPO can be priced via fixed price or book-building route. SMEs often use book-building to determine fair value.
IPO Launch and Subscription: Investors, including retail and institutional, subscribe to the shares during the IPO period.
Listing: Once shares are allotted, they get listed on SME platforms, enabling trading and liquidity.
Investor Protection Measures
Despite being high-growth, high-risk investments, SME IPOs incorporate measures for investor protection:
Disclosure of risk factors and financials.
Requirement of a market maker to maintain liquidity.
SEBI guidelines for lock-in periods for promoters, reducing the risk of sudden sell-offs.
Conclusion of Part 2
A strong regulatory framework ensures transparency, investor confidence, and orderly growth of the SME IPO market. Understanding this framework helps investors evaluate the potential risks and rewards before committing capital.
Part 3: Factors Driving High Returns in SME IPOs
High returns in SME IPOs are driven by a combination of market dynamics, company fundamentals, and investor sentiment.
1. Growth Potential of SMEs
Many SMEs operate in emerging sectors such as technology, renewable energy, healthcare, and specialty manufacturing. These sectors have higher growth potential compared to mature industries, making them attractive for investors seeking exponential returns.
2. Market Inefficiencies and Speculation
SME stocks often have lower liquidity, creating price inefficiencies. Early investors who identify strong companies can benefit from rapid price appreciation after listing.
3. Promoter Credibility and Track Record
A promoter’s experience, credibility, and operational success significantly influence investor confidence. Companies with visionary leadership tend to perform better post-IPO, often rewarding early investors.
4. Favorable Economic Conditions
Macroeconomic factors like GDP growth, low interest rates, and government incentives for SMEs can amplify returns. For instance, policies promoting Make in India or technology adoption can increase SME valuations.
5. Undervalued Offerings
SME IPOs often carry lower valuations compared to mainboard companies. Investors with careful fundamental analysis can identify undervalued opportunities poised for growth.
6. Role of Market Makers
BSE and NSE mandate market makers for SME stocks, ensuring continuous buying and selling, which can reduce volatility and provide price support during initial trading days.
Conclusion of Part 3
High returns in SME IPOs are a result of the interplay between intrinsic company value, sector growth potential, market sentiment, and regulatory mechanisms. However, investors must exercise caution and due diligence to avoid speculative pitfalls.
Part 4: Risks and Challenges in Investing in SME IPOs
While SME IPOs promise high rewards, they are accompanied by unique risks that investors must understand.
1. Limited Operational Track Record
SMEs often have shorter business histories. Any operational misstep, market slowdown, or competitive threat can significantly impact profitability and share price.
2. Lower Liquidity
SME stocks trade on smaller platforms with fewer participants, leading to thin order books. This can result in higher price volatility and difficulty in exiting positions quickly.
3. Market Volatility
SME IPOs are more sensitive to broader market swings. Even positive company performance may not prevent stock prices from falling during bearish market conditions.
4. Regulatory and Compliance Risks
Although SEBI regulates SME IPOs, non-compliance, reporting delays, or governance lapses can affect investor confidence and share performance.
5. Sector-Specific Risks
Many SMEs operate in niche sectors that may face rapid technological changes, policy shifts, or demand fluctuations, affecting long-term sustainability.
6. Overvaluation at Listing
Due to hype, some SME IPOs may be overpriced relative to fundamentals, exposing investors to short-term losses post-listing.
Risk Mitigation Strategies
Diversification: Avoid concentrating capital in one SME IPO.
Fundamental Analysis: Study financials, business model, and growth prospects.
Monitor Market Maker Activity: Ensure liquidity support is sufficient.
Long-Term Perspective: SME IPOs often perform better over 1–3 years than in the immediate post-listing period.
Conclusion of Part 4
Understanding risks is critical for balancing potential high rewards. While SME IPOs can deliver significant returns, careful due diligence, prudent investment size, and long-term perspective are essential to mitigate inherent risks.
Part 5: Strategies for Successful Investment in SME IPOs
Investors can maximize rewards from SME IPOs by combining research, timing, and portfolio management strategies.
1. Identifying Promising SMEs
Focus on companies with:
Strong fundamentals and consistent revenue growth.
Experienced promoters with proven track records.
Products or services in emerging or high-demand sectors.
2. Timing and Market Sentiment
Investors should monitor:
IPO subscription trends: Oversubscription indicates strong demand.
Market conditions: Bullish markets often favor strong listing gains.
Listing day performance and early trading trends for post-IPO opportunities.
3. Diversification Across Sectors
Investing in multiple SME IPOs across different industries reduces sector-specific risk and increases chances of capturing high-growth opportunities.
4. Leveraging Advisory Services
Merchant bankers, financial analysts, and SEBI-registered advisors can provide insights into valuation, risk factors, and listing prospects.
5. Long-Term Investment Approach
While short-term gains are possible, many SME IPOs achieve substantial growth over 1–3 years. Investors focusing on long-term growth can benefit from compounding returns and company expansion.
6. Monitoring Post-Listing Performance
After listing, track:
Quarterly financial results.
Market share growth and competitive positioning.
Promoter activity and adherence to corporate governance.
7. Exit Strategies
Plan exits based on valuation targets or fundamental deterioration. Avoid panic selling during short-term market volatility.
Conclusion of Part 5
SME IPOs represent a compelling opportunity for investors willing to take calculated risks. By combining careful research, diversification, long-term vision, and active monitoring, investors can participate in India’s growth story and potentially achieve high rewards from the SME IPO segment.
Overall Conclusion
Indian SME IPOs are a vibrant, high-potential segment that balances risk with opportunity. Regulatory support, growth potential, and market mechanisms make it possible for investors to reap significant rewards, provided they adopt disciplined investment strategies. By understanding the nuances, risks, and strategies discussed, investors can confidently navigate the SME IPO landscape in India.
BTCUSD.P trade ideas

Divergence SecretsPart 1: Factors Affecting Option Pricing
Option pricing is dynamic, influenced by multiple factors:
1. Intrinsic Value
Difference between underlying price and strike price.
2. Time Value
Longer time to expiry = higher premium due to uncertainty.
3. Volatility
Higher volatility increases probability of profit → higher premium.
4. Interest Rates
Affects call and put pricing slightly, more relevant in long-term options.
5. Dividends
Expected dividend reduces call price but increases put price.
Popular Models:
Black-Scholes Model: Pricing for European options.
Binomial Model: Pricing for American options.
Part 2: Option Strategies for Beginners
Beginners can start with simple strategies:
Long Call: Buy call, bullish view, limited risk.
Long Put: Buy put, bearish view, limited risk.
Covered Call: Own stock + sell call → generate income, moderate risk.
Protective Put: Own stock + buy put → hedge downside.
Tip: Always define your risk and target before trading.
Part 3: Advanced Option Strategies
For experienced traders, multi-leg strategies can maximize returns:
Straddle: Buy call + buy put (same strike & expiry) → profit from volatility.
Strangle: Buy OTM call + OTM put → cheaper than straddle, still bets on volatility.
Vertical Spread: Buy & sell calls (or puts) at different strikes → limit risk & reward.
Iron Condor: Sell OTM call + buy further OTM call, sell OTM put + buy further OTM put → profits in range-bound markets.
Butterfly Spread: Combine calls or puts to profit near a strike price with limited risk.
Key: Advanced strategies reduce risk or cost but require precise market view.
Part 4: Risk Management in Option Trading
Options are powerful but risky. Effective risk management is critical:
Limited vs Unlimited Risk: Buyers have limited loss (premium), sellers can face unlimited loss.
Position Sizing: Never risk more than 1–2% of trading capital on a single trade.
Hedging: Use protective puts or spreads to reduce downside.
Stop Loss: Predefine maximum loss.
Volatility Awareness: High IV → expensive options; low IV → cheap options.
Part 5: Option Trading in Indian Markets
In India, NSE (National Stock Exchange) is the primary platform. Key points:
Instruments: Nifty, Bank Nifty, Stocks (F&O).
Lot Size: Defined per contract; standard for indices & stocks.
Expiry: Weekly, monthly, quarterly.
Regulation: SEBI regulates, ensures margin & settlement rules.
Example:
Nifty current level: 25,000
Buy Nifty 25,100 CE (call)
Lot size: 50 → Pay premium × 50
Settlement:
Cash-settled for indices.
Physical delivery possible for stock options.
Part 6: Tips for Success in Option Trading
To trade options successfully:
Learn Before Trading: Understand Greeks (Delta, Gamma, Theta, Vega, Rho).
Start Small: Focus on a few stocks or indices.
Track Volatility: Higher IV → cautious buying.
Plan Exits: Define profit and loss targets.
Diversify Strategies: Mix spreads, protective puts, and hedges.
Stay Updated: News, earnings, and macro events affect premiums.
Paper Trade: Practice virtual trading before risking real capital.
Mindset: Option trading is about probability, not certainty. Patience and discipline are key.

Trading Master Class With ExpertsPart 1: Introduction to Option Trading
Options are financial derivatives that derive their value from an underlying asset such as stocks, indices, commodities, or currencies. Unlike shares, buying an option doesn’t mean you own the asset—it gives you the right but not the obligation to buy or sell the asset at a pre-agreed price within a set period. This flexibility makes options a powerful tool for hedging, speculation, and income generation.
Part 2: What is a Derivative?
A derivative is a financial contract whose value depends on another asset. Futures and options are the two most popular derivatives. While futures require you to buy/sell at expiry, options give you the choice. This “choice” is what makes them unique—and sometimes tricky.
Part 3: The Two Types of Options
Call Option – Gives the buyer the right to buy an asset at a fixed price (strike price).
Example: If you buy a call option of Reliance at ₹2500, and the stock moves to ₹2600, you can still buy it at ₹2500.
Put Option – Gives the buyer the right to sell an asset at a fixed price.
Example: If you buy a put option at ₹2500 and the stock falls to ₹2400, you can still sell it at ₹2500.
Part 4: Key Terminologies
Strike Price – The pre-decided price of buying/selling.
Premium – The cost paid to buy the option.
Expiry Date – The last date till which the option is valid.
In-the-Money (ITM) – Option has intrinsic value.
Out-of-the-Money (OTM) – Option has no intrinsic value.
At-the-Money (ATM) – Strike price is close to market price.
Part 5: Call Option in Detail
A call option is ideal if you expect the price of an asset to rise. Buyers risk only the premium paid, while sellers (writers) can face unlimited losses if prices rise sharply. Traders often buy calls for bullish bets and sell calls to earn premium income.
Part 6: Put Option in Detail
A put option is profitable when asset prices fall. Buyers of puts use them for protection against a market crash, while sellers hope prices won’t fall so they can pocket the premium. Investors holding stocks often buy puts as insurance against downside risk.
Part 7: How Option Premium is Priced
Option premium = Intrinsic Value + Time Value
Intrinsic Value: Actual value (e.g., if Reliance is ₹2600 and strike is ₹2500, intrinsic = ₹100).
Time Value: Extra cost traders pay for the possibility of favorable movement before expiry.
Pricing is also influenced by volatility, interest rates, and dividends.
Part 8: The Greeks in Options
The Greeks measure option sensitivity:
Delta – Measures how much option price moves for a ₹1 move in stock.
Gamma – Measures how delta changes with stock movement.
Theta – Measures time decay (options lose value as expiry approaches).
Vega – Measures sensitivity to volatility.
Rho – Measures sensitivity to interest rates.
Part 9: Why Traders Use Options
Options are versatile. Traders use them to:
Speculate on price movements with limited risk.
Hedge against adverse market moves.
Generate Income by selling options (collecting premiums).
Leverage positions with less capital compared to buying shares directly.
Part 10: Buying vs Selling Options
Buying Options: Limited risk (premium), unlimited profit potential.
Selling Options: Limited profit (premium), unlimited risk.
Example: Selling a naked call when markets rise aggressively can cause heavy losses.

Types of Trading in India: An In-Depth Analysis1. Equity Trading (Stock Trading)
Overview: Buying and selling shares of companies listed on stock exchanges like NSE and BSE.
Key Features:
Can be short-term (intraday) or long-term (investment).
Investors earn through capital appreciation and dividends.
Benefits: High liquidity, transparency, regulated market.
Risks: Market volatility can lead to significant losses.
Example: Buying shares of Reliance Industries and selling after a price rise.
2. Intraday Trading
Overview: Buying and selling stocks within the same trading day.
Key Features:
Traders do not hold positions overnight.
Relies heavily on technical analysis.
Benefits: Quick profits, no overnight risk.
Risks: High leverage increases risk; requires constant monitoring.
Example: Buying Infosys in the morning and selling by afternoon for short-term gains.
3. Futures and Options (Derivatives Trading)
Overview: Contracts whose value is derived from underlying assets like stocks, indices, or commodities.
Key Features:
Futures obligate buying/selling at a fixed date.
Options provide the right, not obligation, to buy/sell.
Benefits: Hedging, leverage, speculation.
Risks: High risk due to leverage; can lead to large losses.
Example: Buying Nifty Call Option to profit from a market rise.
4. Commodity Trading
Overview: Buying and selling commodities such as gold, silver, oil, and agricultural products on MCX or NCDEX.
Key Features:
Includes spot, futures, and options contracts.
Influenced by global demand, supply, and geopolitical factors.
Benefits: Portfolio diversification, inflation hedge.
Risks: Price volatility, geopolitical risks, storage costs (for physical commodities).
Example: Trading crude oil futures anticipating a price surge.
5. Currency Trading (Forex Trading)
Overview: Trading in foreign currency pairs like USD/INR, EUR/INR.
Key Features:
Can be spot or derivative contracts.
Driven by global economic events and RBI policies.
Benefits: High liquidity, global opportunities.
Risks: Exchange rate volatility, leverage risks.
Example: Buying USD against INR expecting INR to weaken.
6. Mutual Fund Trading
Overview: Investing in professionally managed funds that pool money from multiple investors.
Key Features:
Equity, debt, hybrid funds available.
Can be SIP (Systematic Investment Plan) or lump sum.
Benefits: Professional management, diversification, lower risk.
Risks: Returns are market-linked; management fees apply.
Example: Investing in HDFC Equity Fund via monthly SIP.
7. Bond and Debt Securities Trading
Overview: Trading government and corporate bonds, debentures, and fixed-income instruments.
Key Features:
Predictable income through interest payments.
Less volatile than equity markets.
Benefits: Capital preservation, steady returns.
Risks: Interest rate fluctuations, credit risk of issuers.
Example: Buying 10-year government bonds for stable returns.
8. Cryptocurrency Trading
Overview: Buying and selling digital currencies like Bitcoin, Ethereum, and Indian crypto tokens.
Key Features:
Highly volatile and largely unregulated in India.
Includes spot trading and futures trading.
Benefits: Potential for high returns, global market access.
Risks: Extreme volatility, regulatory uncertainty, cyber risks.
Example: Trading Bitcoin on WazirX anticipating a price spike.
9. IPO and Primary Market Trading
Overview: Investing in companies during their Initial Public Offering before they are listed.
Key Features:
Subscription-based allotment via brokers or banks.
Potential for listing gains.
Benefits: Opportunity to buy at a lower price before listing.
Risks: Listing may underperform; market sentiment affects gains.
Example: Applying for LIC IPO shares expecting listing gains.
10. Algorithmic and High-Frequency Trading (HFT)
Overview: Automated trading using computer algorithms to execute orders at high speed.
Key Features:
Relies on pre-set rules, AI, and quantitative models.
Popular among institutional traders and hedge funds.
Benefits: Speed, accuracy, can exploit small price differences.
Risks: Requires technical expertise, market flash crashes possible.
Example: Using algorithmic trading to scalp Nifty futures in milliseconds.
Conclusion
India offers a wide spectrum of trading opportunities for investors and traders—from traditional stock markets to cutting-edge algorithmic and crypto trading. Choosing the right type depends on risk tolerance, capital, time horizon, and knowledge of the market. While equities, derivatives, and commodities dominate in terms of popularity, newer avenues like cryptocurrencies and algorithmic trading are gaining traction rapidly.

Half a Billion Dollars in Bitcoin and Tens of Millions in Ethere🚨In a 60‑minute window, more than 5,700 BTC (~
509
𝑀
)
𝑎
𝑛
𝑑
∗
∗
27
,
000
𝐸
𝑇
𝐻
∗
∗
(
509M)and∗∗27,000ETH∗∗(
43M) moved between large wallets and exchanges.
Such extraordinary volume in a short period often signals rapid trend reversals or strong price pressure.
Exchange inflows usually mean selling pressure; outflows often signal accumulation and possible bullish momentum.🚨

BTCUSD- BUYPerfect support zone good condition to buy
My buying is on 15 min candel with good volume
Low risk trade

Part 2 Candle Stick PatternParticipants in Options Trading
Options markets consist of four main participants:
Buyers of Calls – Expect the underlying asset’s price to rise. Risk limited to premium.
Buyers of Puts – Expect the underlying asset’s price to fall. Risk limited to premium.
Sellers (Writers) of Calls – Expect prices to remain below the strike price. Risk is theoretically unlimited for naked calls.
Sellers (Writers) of Puts – Expect prices to remain above the strike price. Risk is substantial if the asset falls sharply.
Options Strategies
Option trading is highly versatile. Traders can employ strategies ranging from conservative hedging to speculative bets:
Covered Call: Holding the underlying asset while selling call options to generate income from premiums.
Protective Put: Buying puts while holding the asset to protect against downside risk.
Straddle: Buying a call and a put with the same strike price and expiration, expecting high volatility.
Strangle: Buying out-of-the-money call and put options for lower cost but with a wider price movement range.
Spreads: Combining multiple options to limit risk and potential profit (e.g., bull call spread, bear put spread).
Option Pricing Factors
Option prices are influenced by several variables:
Underlying Asset Price: Higher asset prices increase call values and decrease put values.
Strike Price: The proximity of the strike to the current asset price affects intrinsic value.
Time to Expiration: More time increases time value and option price.
Volatility: Greater market volatility increases the likelihood of significant price changes, raising premiums.
Interest Rates & Dividends: Rising interest rates increase call values and reduce put values; dividend payouts impact stock options.
The most widely used pricing model is the Black-Scholes Model, which calculates theoretical option prices based on these factors.
Advantages of Option Trading
Leverage: Control a larger position with a smaller capital outlay.
Hedging: Protect portfolios against adverse price movements.
Flexibility: Execute a wide range of strategies for bullish, bearish, or neutral markets.
Defined Risk: Maximum loss for buyers is limited to the premium paid.
Profit in Any Market: Options allow for profit in rising, falling, or sideways markets.
Risks of Option Trading
Options are complex and involve risks:
Premium Loss: Buyers can lose the entire premium if the option expires worthless.
Leverage Risk: While leverage amplifies gains, it also amplifies losses for sellers or advanced strategies.
Time Decay (Theta): Options lose value as expiration nears if the underlying price does not move favorably.
Volatility Risk (Vega): Changes in market volatility affect option prices.
Complexity: Advanced strategies can involve multiple positions and require careful monitoring.

Advanced Smart Liquidity Concepts1. Introduction to Smart Liquidity
1.1 Definition of Smart Liquidity
Smart liquidity refers to the portion of market liquidity that is not just available but is efficiently utilized by market participants to execute trades with minimal market impact. Unlike raw liquidity, which measures just the number of shares or contracts available, smart liquidity evaluates:
Accessibility: Can orders be executed efficiently without adverse price movement?
Quality: How stable and reliable is the liquidity at various price levels?
Speed: How quickly can liquidity be accessed and replenished?
1.2 Evolution from Traditional Liquidity Concepts
Traditional liquidity focuses on measurable quantities: order book depth, bid-ask spreads, and trading volume. Smart liquidity incorporates behavioral and strategic aspects of market participants:
Algorithmic awareness: Machines identify and exploit inefficiencies, adjusting liquidity dynamically.
Hidden liquidity: Orders concealed in dark pools or iceberg orders that influence market balance without being visible.
Latency arbitrage impact: The speed advantage of HFT affects liquidity availability and reliability.
2. Drivers of Advanced Smart Liquidity
Smart liquidity is influenced by a complex interplay of market structure, participant behavior, and technological factors:
2.1 Market Microstructure
Order book dynamics: Depth, shape, and resilience of the order book impact how liquidity is absorbed.
Spread dynamics: Tight spreads suggest high-quality liquidity, but may hide fragility if large orders create slippage.
Order flow imbalance: The ratio of aggressive to passive orders indicates how liquidity will move under pressure.
2.2 High-Frequency and Algorithmic Trading
Liquidity provision by HFTs: HFTs continuously place and cancel orders, creating dynamic liquidity pockets.
Quote stuffing and spoofing: Some algorithms distort perceived liquidity temporarily, affecting smart liquidity perception.
Latency arbitrage: Access to faster data feeds allows participants to extract liquidity before it is visible to slower traders.
2.3 Dark Pools and Hidden Liquidity
Iceberg orders: Large orders split into smaller visible slices to reduce market impact.
Alternative trading systems (ATS): These venues offer substantial liquidity without displaying it on public exchanges, contributing to overall market efficiency.
Liquidity fragmentation: The same asset may be available in multiple venues, requiring smart routing to access efficiently.
2.4 Market Sentiment and Behavior
Trader psychology: Fear or greed can amplify or withdraw liquidity, especially during volatility spikes.
News and macro events: Smart liquidity shifts rapidly around earnings, central bank announcements, or geopolitical shocks.
3. Measuring Smart Liquidity
Traditional liquidity measures are insufficient for modern market analysis. Advanced metrics capture both quality and accessibility:
3.1 Market Impact Models
Price impact per trade size: How much the price moves for a given order quantity.
Resilience measurement: How quickly the market recovers after a large trade absorbs liquidity.
3.2 Order Book Metrics
Depth at multiple levels: Not just best bid and ask but the full ladder of price levels.
Order flow toxicity: Probability that incoming orders are informed or likely to move the market against liquidity providers.
3.3 Smart Liquidity Indicators
Liquidity-adjusted volatility: Adjusting volatility estimates based on available liquidity.
Effective spread: Spread accounting for market impact and hidden liquidity.
Liquidity heatmaps: Visual tools highlighting concentration and availability of smart liquidity across price levels and venues.
3.4 Machine Learning for Liquidity Analysis
Predicting liquidity shifts using historical order book data.
Clustering trades by behavior to identify hidden liquidity patterns.
Algorithmic routing optimization to access the most favorable liquidity pools.
4. Strategies Leveraging Smart Liquidity
Advanced smart liquidity concepts are not just analytical—they inform trading strategy, risk management, and execution efficiency.
4.1 Optimal Order Execution
VWAP and TWAP algorithms: Spread large trades over time to minimize market impact.
Liquidity-seeking algorithms: Dynamically route orders to venues with the highest smart liquidity.
Iceberg order strategies: Hide large orders to reduce signaling risk.
4.2 Risk Management Applications
Dynamic hedging: Adjust hedge positions based on real-time smart liquidity availability.
Liquidity-adjusted VaR: Incorporates potential liquidity constraints into risk calculations.
Stress testing: Simulating low liquidity scenarios to measure portfolio vulnerability.
4.3 Arbitrage and Market-Making
Exploiting temporary liquidity imbalances across venues or assets.
Providing liquidity strategically during periods of high spreads to capture rebates and mitigate inventory risk.
Utilizing smart liquidity signals to identify emerging inefficiencies.
5. Smart Liquidity in Volatile Markets
5.1 Liquidity Crises and Flash Events
Flash crashes often occur when apparent liquidity evaporates under stress.
Smart liquidity analysis identifies resilient liquidity versus superficial depth that may disappear under pressure.
5.2 Adaptive Strategies for High Volatility
Dynamic adjustment of execution algorithms.
Use of limit orders versus market orders depending on liquidity conditions.
Monitoring order flow toxicity and liquidity concentration to avoid adverse selection.
6. Technological Innovations Impacting Smart Liquidity
6.1 AI and Machine Learning
Predictive models for liquidity shifts.
Reinforcement learning for adaptive execution strategies.
6.2 Blockchain and Decentralized Finance (DeFi)
Automated market makers (AMMs) provide liquidity continuously with programmable rules.
Smart liquidity pools that dynamically adjust pricing and depth.
6.3 High-Frequency Infrastructure
Co-location and low-latency networking enhance the ability to access liquidity before competitors.
Real-time analytics of fragmented markets for smart routing.
7. Regulatory Considerations
Advanced liquidity management intersects with regulation:
Market manipulation risks: Spoofing, layering, and quote stuffing can misrepresent liquidity.
Best execution obligations: Brokers must seek the highest-quality liquidity for clients.
Transparency vs. privacy: Balancing visible liquidity with hidden orders in regulated venues.
8. Future Directions of Smart Liquidity
Integration of multi-asset liquidity analysis: Evaluating cross-asset and cross-venue liquidity to optimize execution.
AI-driven market-making: Fully autonomous systems that dynamically adjust liquidity provision.
Global liquidity networks: Real-time global liquidity mapping for cross-border trading.
Impact of quantum computing: Potentially enabling instant liquidity analysis at unprecedented speeds.
9. Conclusion
Advanced smart liquidity goes far beyond simple bid-ask spreads or volume metrics. It encompasses quality, accessibility, adaptability, and strategic use of liquidity. In a market dominated by algorithms, high-frequency trading, and fragmented venues, understanding smart liquidity is essential for:
Efficient trade execution
Risk mitigation and stress management
Market-making and arbitrage strategies
Anticipating market behavior in volatile conditions
Future financial markets will increasingly rely on AI-driven liquidity analytics, real-time monitoring, and predictive modeling. Traders and institutions that master smart liquidity will gain a competitive edge in both execution efficiency and risk management.

BTC/USD: Bearish Trend After Flash Crash and Key NewsThe BTC/USD chart shows a strong bearish trend following the "flash crash" event and contract liquidations. Currently, BTC is moving within a downward channel with support levels at 110,300 USD and 108,000 USD.
News Impact:
Morgan Stanley to Offer Crypto Trading: Morgan Stanley’s partnership with Zerohash to provide crypto trading on E*Trade could boost cryptocurrency acceptance, but it's not enough to reverse the bearish trend in BTC.
Fed Chairman Jerome Powell on Interest Rates: Jerome Powell's statements regarding the possibility of maintaining high interest rates have increased uncertainty, negatively impacting the cryptocurrency market.
Conclusion: The bearish trend of BTC/USD may continue. Traders should pay attention to support levels and stay updated with economic news to make informed trading decisions.

BTCUSD Analysis on (24/09/2025)BTCUSD UPDATEDE
Current price- 113700
If price stay above 111000,then next target 115000,117000 and below that 109000
Plan; if price break 113500-112500 area and above that 113500 area,we will place buy oder in BTCUSD with target of 115000,117000 & stop loss should be placed at 111000

Part 7 Trading Master Class1. Introduction to Options Trading
Options are one of the most fascinating financial instruments in the market because they allow traders to speculate, hedge, and manage risks in creative ways. Unlike buying and selling shares directly, options give you the right but not the obligation to buy or sell an asset at a predetermined price within a specified period. This flexibility makes options extremely powerful.
However, with power comes responsibility. Options trading is not as straightforward as buying a stock and waiting for its price to go up. Options involve multiple variables—time decay, implied volatility, strike prices, and premiums—that all influence profit and loss. For this reason, traders develop strategies that balance risk and reward depending on their market outlook.
Option trading strategies range from simple ones—like buying a call when you expect a stock to rise—to very advanced ones—like iron condors or butterflies, where you combine multiple contracts to profit from stable or volatile markets.
In this guide, we’ll explore the most widely used option trading strategies, explaining how they work, when to use them, and their advantages and risks.
2. Understanding Options Basics
Before diving into strategies, let’s understand the core building blocks of options:
Call Option
A call option gives the buyer the right to buy an asset at a fixed strike price within a given time frame.
Example: You buy a call option on Reliance at ₹2,500 strike for a premium of ₹50. If Reliance rises to ₹2,600, you can exercise the option and profit.
Put Option
A put option gives the buyer the right to sell an asset at a fixed strike price within a given time frame.
Example: You buy a put option on Infosys at ₹1,500 strike for a premium of ₹40. If Infosys falls to ₹1,400, you can sell it at ₹1,500, earning profit.
Key Terms in Options
Strike Price: The fixed price at which you can buy/sell the asset.
Premium: The cost you pay to buy the option.
Expiry Date: The last date the option is valid.
In the Money (ITM): When exercising the option is profitable.
At the Money (ATM): When strike price ≈ current price.
Out of the Money (OTM): When exercising the option is not profitable.
3. Why Use Options?
Options are not just for speculation—they serve multiple purposes:
Hedging – Investors use options to protect against unfavorable price moves. Example: Buying puts to protect a stock portfolio against a market crash.
Income Generation – By writing (selling) options like covered calls or cash-secured puts, traders collect premiums and generate consistent income.
Leverage – Options allow control of large stock positions with small capital. For example, buying one call contract is cheaper than buying 100 shares of the stock outright.
Speculation – Traders can take directional bets with limited risk. Example: If you expect volatility, you might use straddle or strangle strategies.
Flexibility – Unlike stocks, options allow you to profit in bullish, bearish, or even sideways markets, depending on the strategy.

Gold & BitCoin (Neowave Forecast)Namaskaram Everyone
Welcome to intelligent investor, we provide market insights by synchronising and combining all the price action waves from different time frames and gives you single trend.
How To Read My Charts...Click Below

Bitcoin Bybit chart analysis September 23Hello
It's a Bitcoin Guide.
If you "follow"
You can receive real-time movement paths and comment notifications on major sections.
If my analysis was helpful,
Please click the booster button at the bottom.
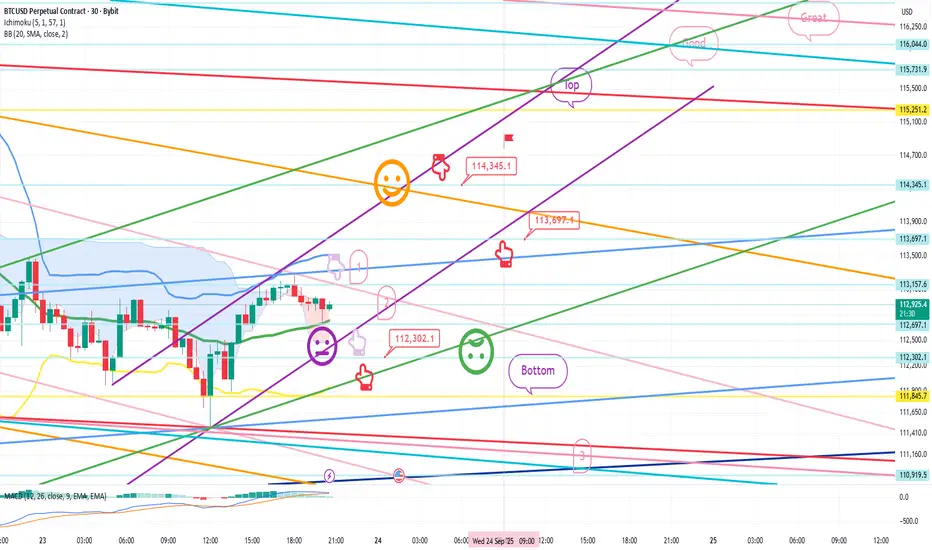
This is Bitcoin's 30-minute chart.
There's an indicator release near 11:00 AM on the Nasdaq,
and I expected a small fluctuation.
I proceeded as safely as possible, considering the current situation.
*When the red finger moves,
One-way long position strategy:
1. Long position entry point at $112,302.1 / Stop loss price if the green support line is broken.
2. Long position initial target at $114,345.1 -> Target prices in order of Top, Good, Great.
After reaching the target price of $114.3K,
you can re-enter the long position at the indicated price of $113.6K.
In the case of 1->2 above,
there's a strong possibility of an upward movement along the purple parallel line. (The 5+15 pattern is still in place.)
The current rebound has already formed a double bottom,
so a drop below the bottom
is not a good move for long positions.
In case of a delay, I've indicated up to section 3 at the bottom.
Thanks to the recent interest from newcomers,
I've made this post publicly available for the first time in a while.
Please use my analysis for reference only.
I hope you operate safely, with a focus on principled trading and stop-loss orders.
Thank you.
btcusdThe live Bitcoin price today is $112591.42 USD with a 24-hour trading volume of $48834864079.08 USD. We update our BTC to USD price in real-time.
$1,12,588.40

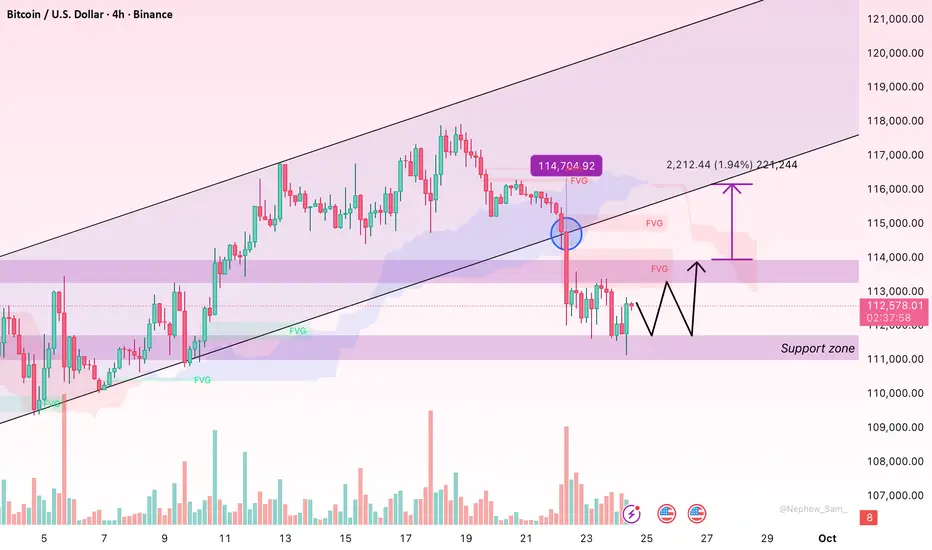
Bitcoin : Short-Term Pullback, Underlying Trend Still PositiveHello everyone,
After reaching the 113,000 USD zone, Bitcoin has seen a short-term correction, but overall the main trend remains intact. On the chart, price action is still trading above the Ichimoku cloud, which serves as a key support area in the event of deeper pullbacks. Fair Value Gaps around 111,000–112,000 USD also act as “stepping stones” for potential retests before price continues higher. Meanwhile, trading volume has eased during this retracement, indicating that this is not a case of capitulation selling, but rather a pause following the strong rally.
From a news perspective, the Federal Reserve continues to maintain high interest rates in an effort to control inflation, yet this has further strengthened Bitcoin’s appeal as an alternative hedge against the US dollar. At the same time, institutional involvement is becoming more evident: MicroStrategy, Tesla, and particularly BlackRock’s push for a Bitcoin ETF are all adding weight to long-term confidence. Against the backdrop of ongoing global uncertainty and persistent banking risks, Bitcoin’s role as “digital gold” stands out even more.
As long as the 111,000–112,000 USD support zone holds, the scenario of breaking above 113,000 and advancing towards 115,000 and even 120,000 USD remains highly likely.
Trade Management: From Entry to Exit1. Understanding Trade Management
Trade management is the systematic process of monitoring, adjusting, and executing trades once a position is initiated. It’s about controlling risk, optimizing profits, and maintaining emotional discipline throughout the lifecycle of a trade. While strategy often focuses on identifying opportunities, trade management emphasizes what happens after you act on a signal.
Key Objectives of Trade Management:
Protect capital from adverse market movements.
Capture maximum potential profits from favorable moves.
Reduce emotional bias and impulsive decision-making.
Maintain consistency across multiple trades.
Trade management is not about predicting the market perfectly but responding effectively to changing conditions. Even the best entry signal can fail without proper management.
2. Pre-Trade Considerations
Effective trade management starts before entering a trade. Planning your trade, even for a few seconds, sets the stage for disciplined execution.
a. Risk Assessment
Risk assessment is the foundation of trade management. A trader must calculate:
Position size: How much capital to allocate.
Maximum acceptable loss: Typically a small percentage of your trading account (1–3% per trade).
Volatility: Understanding how much the market might move against you.
For instance, if a stock trades at ₹500 and you’re willing to risk ₹10 per share with ₹50,000 capital, your position size would be calculated based on the acceptable loss.
b. Setting Trade Objectives
Clear objectives define what success looks like:
Profit target: A realistic price level for taking profits.
Stop-loss: The price at which to exit if the trade goes against you.
Time horizon: Day trade, swing trade, or position trade.
c. Choosing the Entry Point
Entry strategies include:
Breakouts above resistance or below support.
Pullbacks to support or resistance.
Indicator-based signals (moving averages, RSI, MACD).
A well-timed entry improves the risk-reward ratio, a critical factor in trade management.
3. The Entry Stage
a. Confirming the Setup
Before entering:
Ensure the trade aligns with your strategy.
Confirm market conditions (trend direction, volatility, liquidity).
Avoid emotional triggers; rely on logic and strategy.
b. Order Placement
The method of entry can impact trade management:
Market orders: Immediate execution but subject to slippage.
Limit orders: Execute at your desired price, avoiding overpaying or underselling.
Stop orders: Triggered only when certain levels are reached.
c. Position Sizing
Trade management begins at entry. Proper sizing ensures you can withstand market fluctuations without violating risk limits. Calculations should include:
Account size
Maximum risk per trade
Stop-loss distance
4. Initial Trade Management: First Phase
Once a trade is live, the first few minutes or hours are crucial.
a. Monitoring Price Action
Observe how the trade behaves relative to your entry:
Is the price moving in your favor?
Are there signs of reversal or consolidation?
Does the trade align with broader market trends?
b. Adjusting Stop-Loss
Depending on market behavior:
Trailing stop-loss: Moves with favorable price action to lock in profits.
Break-even stop: Adjusts the stop-loss to the entry point once the trade moves in your favor.
These adjustments reduce risk without limiting profit potential.
c. Avoid Over-Management
Too many interventions early in the trade can reduce profitability. Focus on planned adjustments rather than reactive ones.
5. Active Trade Management: Mid-Trade Phase
As the trade progresses, management focuses on protecting gains and assessing market conditions.
a. Monitoring Market Signals
Trend continuation: Indicators like moving averages or ADX can suggest the trend is intact.
Signs of reversal: Divergences or support/resistance tests may indicate slowing momentum.
b. Scaling In or Out
Advanced trade management involves adjusting position size:
Scaling out: Selling a portion of the position to lock in profits while leaving the rest to run.
Scaling in: Adding to a position if the trade continues to move in your favor (requires strict risk control).
c. Emotional Discipline
Avoid greed or fear-driven decisions. Many traders exit too early or hold too long due to emotions, undermining well-planned management strategies.
6. Exit Strategies
Exiting a trade is as important as entering it. Exits can be categorized into profit-taking and loss-limiting.
a. Stop-Loss Management
Fixed stop-loss: Set at trade entry; does not move.
Dynamic stop-loss: Adjusted based on price action or technical levels.
Volatility-based stop: Placed considering market volatility (e.g., ATR-based stop).
b. Profit Targets
Profit targets depend on the strategy:
Risk-reward ratio: Commonly 1:2 or higher.
Key levels: Previous highs/lows, trendlines, Fibonacci retracements.
Trailing profits: Using a moving stop to let profits run as long as the trend continues.
c. Partial Exits
Exiting partially can:
Reduce risk exposure.
Secure profits.
Allow a portion of the trade to benefit from extended moves.
d. Time-Based Exit
Some trades are exited purely based on time:
Day trades end before market close.
Swing trades may close after a few days or weeks based on pre-determined plans.
7. Trade Review and Analysis
After exiting, a trade review is crucial. Successful traders continuously learn from each trade.
a. Recording Trade Data
Entry and exit points
Position size
Stop-loss and target levels
Outcome (profit/loss)
Market conditions
b. Performance Metrics
Evaluate:
Win rate
Average risk-reward ratio
Maximum drawdown
Emotional adherence to strategy
c. Lessons Learned
Identify what worked and what didn’t:
Did you follow the plan?
Were stop-losses or targets set appropriately?
Could trade management have improved outcomes?
This reflection improves future trade management decisions.
8. Psychological Aspects of Trade Management
Effective trade management isn’t only technical; psychology plays a major role.
a. Emotional Control
Fear, greed, and impatience can cause premature exits or overexposure. Discipline ensures consistent management.
b. Patience and Observation
Trades require time to develop. Rushing exits reduces profitability, while overconfidence can lead to excessive risk.
c. Confidence in Strategy
Believing in your setup and management plan prevents impulsive decisions during volatile periods.
9. Tools and Techniques for Trade Management
Modern trading offers tools to aid trade management:
Stop-loss orders: Automatic exit when a price level is breached.
Trailing stops: Adjust automatically to follow market trends.
Alerts and notifications: Track critical price movements.
Charting software: Helps visualize trends, supports, and resistance levels.
Risk calculators: Ensure proper position sizing and exposure.
Using these tools reduces human error and improves consistency.
10. Common Mistakes in Trade Management
Even experienced traders can fall into traps:
Ignoring stop-losses: Leads to large, unnecessary losses.
Over-trading: Entering too many positions without proper management.
Excessive micromanagement: Constantly adjusting stops or positions.
Emotional trading: Letting fear or greed dictate decisions.
Failing to review trades: Missing opportunities to improve future performance.
Avoiding these mistakes is as important as any technical skill.
11. Advanced Trade Management Strategies
Once basic management is mastered, traders can explore advanced techniques:
a. Hedging
Use options or correlated instruments to protect open positions.
b. Scaling Positions Dynamically
Adjust size in response to volatility and trend strength.
c. Diversification
Manage multiple trades across assets to reduce risk concentration.
d. Algorithmic or Automated Management
Automated systems can manage stops, take profits, and exit trades based on predefined rules, reducing emotional interference.
12. Conclusion: The Art of Trade Management
Trade management is the bridge between strategy and profitability. While entries are important, how a trader manages the trade—adjusting stops, scaling positions, monitoring risk, and controlling emotions—ultimately determines long-term success. Consistent, disciplined trade management transforms market volatility from a threat into an opportunity.
By mastering this process from entry to exit, traders can:
Minimize losses during adverse conditions.
Maximize profits during favorable trends.
Build confidence and consistency in their trading approach.
Develop a systematic, rules-based trading methodology that outperforms purely speculative approaches.
The ultimate goal is not just winning trades but managing trades to create sustainable, long-term profitability.
BTCUSDBitcoin is the first decentralized cryptocurrency. Based on a free-market ideology, bitcoin was invented in 2008 when an unknown entity published a white paper under the pseudonym of


Bitcoin’s Correction Puzzle: Wedge Break, Macro Shifts!!Bitcoin has entered a fascinating phase after breaking down from its rising wedge formation, leaving the market in a medium-term correction cycle. Current price action around 113000 is trying to stabilize, but the structure suggests this zone is fragile. If bulls cannot reclaim and hold above the invalidation band near 116000, corrective flows are to dominate. The first major support sits around 103600, where a pause or bounce could develop. If that level folds, the market opens up for a deeper liquidity sweep toward 93000. Should this pocket fail to hold, Bitcoin’s path could extend into the 75000 region a zone that looks extreme but is consistent with how deep-pocket corrections unfold after a parabolic wedge break.
From a macro angle, the pressure is building. The Fed’s transition toward deeper cuts reflects softer growth, but while rate reductions support risk sentiment broadly, the narrative is colliding with dollar weakness, shifting liquidity conditions, and fading institutional momentum after the wedge breakdown. Equity markets still command flows, and with gold and silver absorbing part of the safe-haven bid, Bitcoin’s role as digital gold is being tested again. Yet, structurally, this correction is not an end-game it’s part of the broader cyclical rhythm. Bulls will need to defend lower zones convincingly to rebuild positioning before another attempt at fresh highs.
In essence, Bitcoin is in a correction phase where short-term optimism hangs on reclaiming 116000, while failure opens doors to a deeper hunt for liquidity at 103600, 93000, and potentially 75000. The macro backdrop makes this correction phase more interesting than usual it’s not just about price action, but about how Bitcoin will reassert its place in a market torn between easing policy, risk-on appetite, and competition from traditional safe-haven flows. Trade safe !!
Key Levels:
Invalidation band (bulls must reclaim): 116000
First support: 103600
Deep pocket zone: 93000
Extreme correction target: 75000

Retail Trading vs Institutional Trading1. Introduction to Market Participants
Financial markets are arenas where buyers and sellers interact to trade securities, commodities, currencies, and other financial instruments. Participants range from small individual traders to massive hedge funds and banks. Among them, retail traders and institutional traders represent two fundamentally different types of participants:
Retail Traders: Individual investors trading their own personal capital, typically through brokerage accounts. They operate on a smaller scale and often lack access to sophisticated market tools and data.
Institutional Traders: Large entities such as hedge funds, mutual funds, pension funds, and banks that trade on behalf of organizations or clients. They have access to advanced trading platforms, proprietary research, and considerable capital.
These differences have profound implications for trading strategies, risk management, and market influence.
2. Objectives and Motivations
Retail Trading Goals
Retail traders are typically motivated by personal financial goals, which may include:
Wealth accumulation: Generating additional income for retirement or long-term financial security.
Speculation: Capitalizing on short-term market movements for potential high returns.
Learning and experience: Gaining exposure to financial markets as a personal interest.
Retail traders often seek smaller but frequent gains, and their investment horizon can vary from intraday trading to multi-year holdings. Emotional factors, such as fear and greed, play a significant role in their decision-making.
Institutional Trading Goals
Institutional traders operate with a broader set of objectives, including:
Client returns: Maximizing investment returns for clients, shareholders, or beneficiaries.
Capital preservation: Managing risk to avoid significant losses, particularly when dealing with large portfolios.
Market efficiency: Institutions often seek to exploit market inefficiencies using advanced strategies.
Unlike retail traders, institutional traders are guided by formal investment mandates, compliance requirements, and fiduciary responsibilities. Their decisions are often more systematic, data-driven, and risk-managed.
3. Scale and Capital
One of the most obvious differences between retail and institutional trading is the scale of capital:
Retail Traders: Typically trade with personal savings ranging from a few hundred to a few hundred thousand dollars. Capital limitations restrict their market influence and often their access to premium financial tools.
Institutional Traders: Operate with millions to billions of dollars in assets. This scale allows institutions to participate in large transactions without immediately affecting market prices, though their trades can still move markets in less liquid instruments.
The size of capital also affects strategies. Large orders from institutions are carefully planned and often executed in stages to avoid market disruption, whereas retail traders can often enter and exit positions more freely.
4. Access to Market Information and Tools
Access to information and tools is another critical distinction:
Retail Traders
Relatively limited access to proprietary market data.
Rely on public sources, online trading platforms, and subscription services for research.
Use simple charting tools, technical indicators, and news feeds.
Institutional Traders
Access to real-time market data feeds, professional analytics, and algorithmic trading tools.
Can employ high-frequency trading, quantitative strategies, and derivatives hedging.
Often have teams of analysts, economists, and data scientists to support trading decisions.
This access disparity often results in retail traders being reactive while institutional traders are proactive, enabling the latter to exploit market inefficiencies more efficiently.
5. Trading Strategies
Retail Trading Strategies
Retail traders typically employ a variety of strategies, including:
Day trading: Buying and selling within the same day to capitalize on small price movements.
Swing trading: Holding positions for days or weeks to benefit from intermediate-term trends.
Buy-and-hold investing: Long-term investment in stocks or ETFs based on fundamentals.
Options trading: Speculating on market movements with leveraged contracts.
Retail strategies often rely heavily on technical analysis and shorter-term trends due to smaller capital and less access to proprietary insights.
Institutional Trading Strategies
Institutional traders have a broader arsenal:
Algorithmic and high-frequency trading (HFT): Exploiting price discrepancies at millisecond speeds.
Arbitrage strategies: Taking advantage of price differences across markets or instruments.
Portfolio diversification and hedging: Balancing large positions across asset classes to manage risk.
Macro trading: Investing based on global economic trends and geopolitical developments.
Institutions combine fundamental analysis, quantitative models, and risk management frameworks, enabling them to navigate both volatile and stable markets effectively.
6. Risk Management Practices
Retail Traders
Risk management is often inconsistent and based on personal judgment.
Common tools include stop-loss orders, position sizing, and diversification, but adherence varies.
Emotional trading can exacerbate losses, especially during volatile markets.
Institutional Traders
Risk management is rigorous and regulated.
Use advanced techniques like Value at Risk (VaR), stress testing, and derivatives hedging.
Decisions are structured to meet fiduciary responsibilities, ensuring client funds are protected.
The disciplined risk management of institutions often gives them a competitive advantage over retail traders, who may rely on gut instinct rather than structured analysis.
7. Market Impact
Retail traders, due to their smaller scale, generally have minimal impact on market prices. They can, however, collectively influence trends, especially in heavily traded retail stocks or during speculative frenzies (e.g., “meme stocks”).
Institutional traders, on the other hand, can significantly move markets. Large orders can influence prices, liquidity, and volatility, especially in less liquid assets. This ability requires institutions to carefully manage order execution and market timing to avoid slippage and adverse price movement.
8. Behavioral Differences
Behavioral factors play a significant role in distinguishing retail and institutional traders:
Retail traders: More susceptible to emotional biases, such as fear, greed, overconfidence, and herd behavior. Social media and news often influence their decisions.
Institutional traders: Tend to follow disciplined processes, supported by data-driven models and compliance requirements. While human emotion exists, it is mitigated by institutional structures.
Behavioral finance studies show that retail investors often underperform compared to institutional investors due to these emotional and cognitive biases.
Conclusion
While retail and institutional traders share the same markets, their approaches, resources, and impacts are vastly different. Retail trading is more personal, flexible, and emotionally driven, whereas institutional trading is structured, capital-intensive, and data-driven. Recognizing these differences allows retail traders to make better strategic decisions, manage risk more effectively, and potentially learn from institutional practices.
For aspiring traders, the key takeaway is that knowledge, discipline, and adaptability matter more than capital size alone. By understanding institutional strategies, leveraging proper risk management, and mitigating behavioral biases, retail traders can significantly improve their odds of success.
BTC Neowave UpdateBTC Intraday Update
Our entry 1 is activated yesterday, so maintain that with stoploss
2nd entry will be created when.....s1 will complete by breaking up of black cycles
Short Term Trend
Learn More about trend here

Top Forex Weekly Analysis DXY, BTC, GOLD, EURUSD 22-28 Sept 2025DXY (US Dollar Index):
DXY bounced from the key 2011 channel support around 96.60 last week, fueled by the recent Fed rate decision.
Resistance stands at 97.70; a weekly close above this level could push DXY towards 98.60.
As long as it stays above 96.60, the outlook remains cautiously bullish.
Failure to break above 97.70 would keep the index range-bound between 96.60 and 97.70, while a break below 96.60 would signal bearish territory.
BTC (Bitcoin):
Bitcoin is currently in an upward trend, forming a "Wedge" reversal pattern and showing buying pressure.
Key resistance near 128,505 with a potential rally target above 145,605 if it breaks above 135,605.
A break below support at 103,405 would indicate a bearish trend, potentially dropping BTC below 90,505.
Short-term bullish corrections are expected, but a cautious approach is advised due to possible downward rebounds.
GOLD (XAU/USD):
Gold shows strong gains near 3668 and continues an uptrend supported by technical patterns.
Potential correction to test support near 3535 before rebounding towards a target above 4045.
Bullish momentum is confirmed if gold closes above 3745, while a fall below 3205 would negate the rally and push prices lower.
Gold remains influenced by interest rates, USD strength, and global events.
EURUSD:
EUR/USD shows a slight upside tilt but faces supply zone resistance.
Possible correction towards 1.16 to 1.14 or a breakout beyond key resistance near 1.18.
A strong breakout above 1.1955 would open the way to 1.2265, while a close below 1.1485 supports a bearish scenario.
Momentum indicators and pattern reversals suggest mixed short-term outlook with trading opportunities during potential corrections.

BTC/USD (Short Cycles)Namaskaram Everyone
BTC is in uptrend but going down in Medium cycle.
currently risk reward is not much favourable, for that you need to wait for short term cycle retracement.
If you need shorter degree chart i will update it, reply in comments.
Intraday Gear 3
Intraday Gear 2
Learn More about trend here
