EMA vs SMA vs WMA: Which Moving Average Should You Use?🔎 Intro / Overview
Moving Averages remain one of the most trusted tools in technical analysis. They smooth price action, highlight the trend, and often act as dynamic support or resistance.
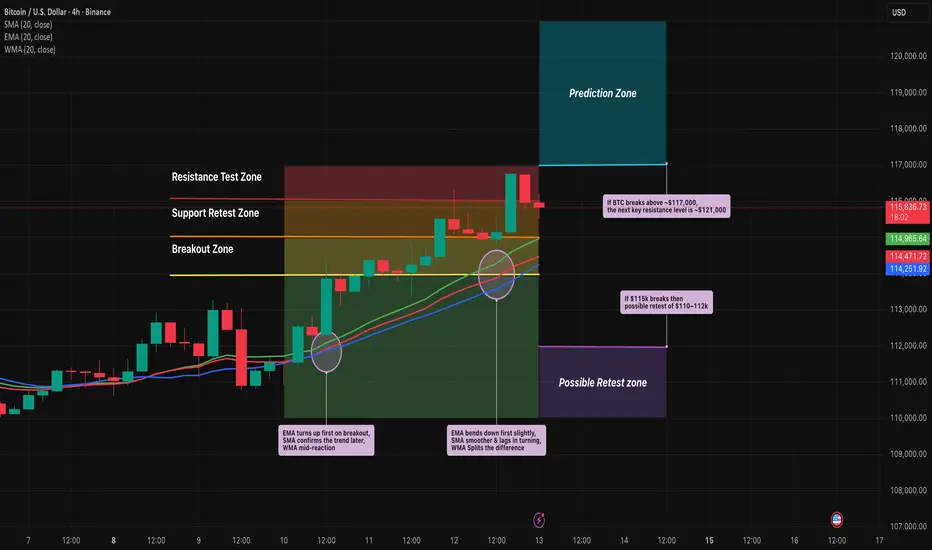
In this post, we compare the 20-period SMA, EMA, and WMA on BTCUSD 4H to show how each reacts differently to market moves.
___________________________________________________________
📔 Concept
SMA (Simple Moving Average): Every candle in the lookback is weighted equally → smooth but slower to react.
EMA (Exponential Moving Average): Recent candles carry more weight → reacts faster, hugs price closely.
WMA (Weighted Moving Average): Linear weighting → a balance between SMA’s stability and EMA’s sensitivity.
The difference lies in responsiveness. Faster averages react early but risk false signals, slower averages confirm trends but lag.
___________________________________________________________
📌 How to Use
1️⃣ Plot the 20-period SMA, EMA, and WMA together.
2️⃣ Watch how each responds during pullbacks, rallies, and consolidations.
3️⃣ Use EMA for quicker signals, SMA for smoother long-term view, and WMA if you prefer a middle ground.
4️⃣ Combine with price action or RSI to avoid relying on moving averages alone.
___________________________________________________________
🎯 Trading Plan
Intraday traders: EMA crossovers (e.g., 9 vs 21 EMA) for faster entries and exits.
Swing traders: SMA for identifying trend direction and major support/resistance.
Balanced traders: WMA for medium-term setups where stability and responsiveness matter equally.
Always align the moving average with your trading style and risk appetite.
___________________________________________________________
📊 Chart Explanation
On BTCUSD 4H:
EMA (red) bent upward first during the $114k breakout, SMA (blue) confirmed later, and WMA (green) sat between them.
At the $115k retest, EMA dipped first, while SMA lagged.
At $116.5–117k resistance, EMA whipsawed but SMA stayed smoother.
Notice how these differences become clear during sharp pullbacks, quick rallies, and sideways ranges.
___________________________________________________________
👀 Observation
EMA is quick but noisy ⚡, SMA is calm but late 🕰️, WMA strikes a middle ground ⚖️.
___________________________________________________________
❗ Why It Matters?
Choosing the right moving average impacts how quickly you spot entries, confirm trends, and manage stop-losses. Understanding the differences helps traders adapt strategies to both trending and sideways markets.
___________________________________________________________
🎯 Conclusion
No single moving average is “best.” Each serves a purpose depending on the timeframe and style of trading. The key is consistency — choose one that aligns with your plan, test it, and apply it with discipline.
👉 Which one do you prefer in your trading — EMA, SMA, or WMA?
___________________________________________________________
⚠️ Disclaimer
📘 For educational purposes only ·
🙅 Not SEBI registered ·
❌ Not a buy/sell recommendation ·
🧠 Purely a learning resource ·
📊 Not Financial Advice
BTCUSD.P trade ideas
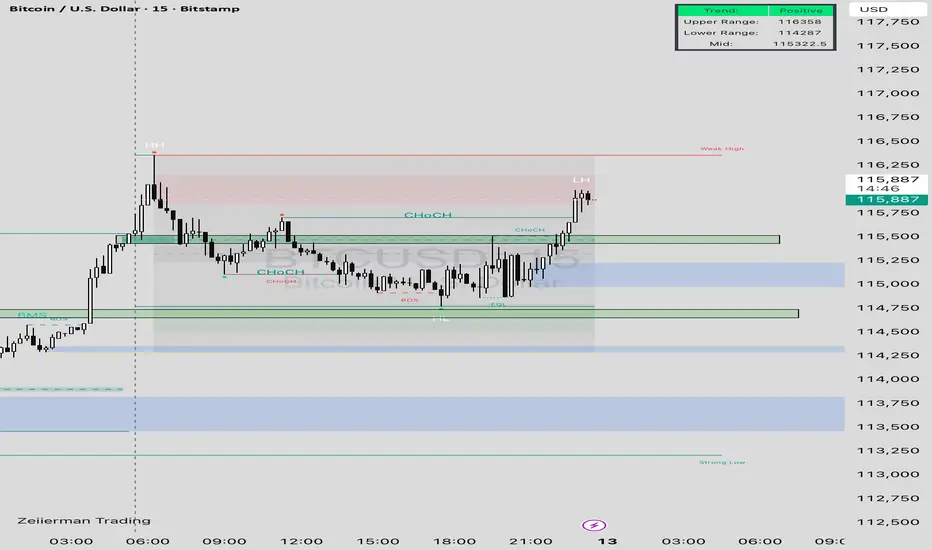
Bitcoin (BTC/USD) 15-Minute Market Structure Analysis – Sept 12,This 15-minute Bitcoin chart highlights a positive market trend with current price action at $115,896 (+0.31%). The structure shows a recent Change of Character (ChoCH) and Break of Structure (BOS), indicating bullish momentum after reclaiming support near 114,750. The price is testing the 116,000 resistance zone, marked by a weak high (HH) and lower high (LH) structure. Key levels are defined with:
• Upper Range : 116,358
• Lower Range: 114,287
• Midpoint: 115,322.5
The chart suggests possible liquidity grabs near the weak high and continuation toward the upper range if bullish momentum holds, while failure could retest demand zones around 115,000–114,750.
OANDA:BTCUSD
Part 1 Ride The Big MovesWhat is an Option?
An option is a financial contract that gives the buyer the right, but not the obligation, to buy or sell an underlying asset at a predetermined price (called the strike price) on or before a specific date (called the expiry date).
There are two main types of options:
Call Option – Gives the buyer the right to buy the underlying asset.
Put Option – Gives the buyer the right to sell the underlying asset.
Example:
If you buy a call option on stock XYZ with a strike price of ₹500, you can buy the stock at ₹500 even if the market price rises to ₹600.
If you buy a put option on stock XYZ at ₹500, you can sell it at ₹500 even if the market price falls to ₹400.
How Options Work
Call Option Buyer: Expects the price to rise. Pays a premium upfront. Profit = Unlimited (price can rise indefinitely) – Premium paid. Loss = Premium paid (if price falls below strike).
Put Option Buyer: Expects the price to fall. Pays a premium upfront. Profit = Strike – Price (max is strike – 0) – Premium paid. Loss = Premium paid.
Option Seller (Writer): Receives the premium. Takes obligation to buy/sell if the buyer exercises. Risk = Can be unlimited for call sellers.
Factors Affecting Option Prices (Option Greeks)
Option price is influenced by:
Delta (Δ) – How much the option price moves with a 1-point move in underlying.
Gamma (Γ) – How fast delta changes with underlying price.
Theta (Θ) – Time decay; how much value the option loses each day.
Vega (V) – Sensitivity to volatility in the underlying asset.
Rho (ρ) – Sensitivity to interest rates.
Tip: Time decay is crucial – options lose value as expiry approaches if the underlying doesn’t move favorably.

Bitcoin Bybit chart analysis September 11 (CPI)Hello
It's a Bitcoin Guide.
If you "follow"
You can receive real-time movement paths and comment notifications on major sections.
If my analysis was helpful,
Please click the booster button at the bottom.
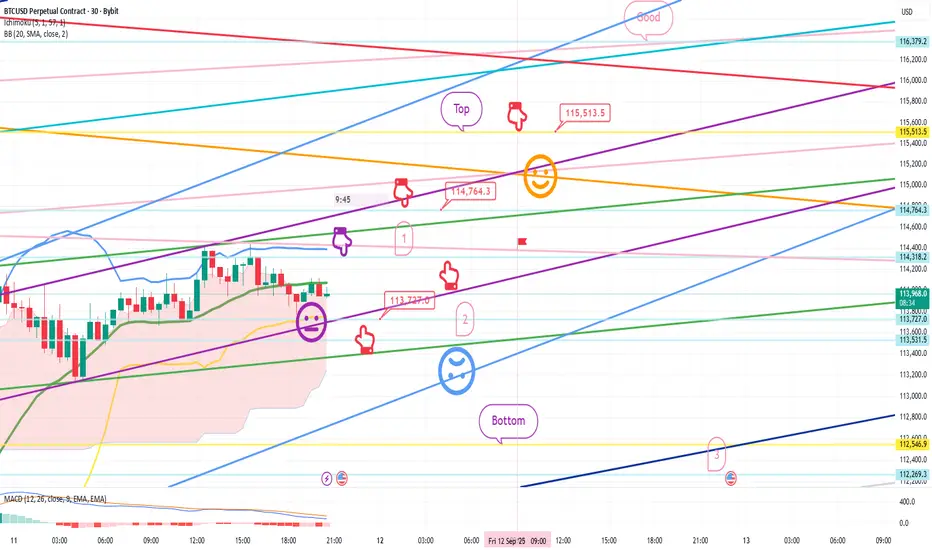
This is Bitcoin's 30-minute chart.
The CPI indicator will be released shortly at 9:30 AM.
I implemented the strategy based on Nasdaq movements.
*When the red finger moves,
Long position strategy
Confirm the upward wave by touching the first section above (autonomous shorting)
1. $113,727 long position entry point / Stop loss if the light blue support line is broken
2. $114,764.3 long position 1st target -> Top 2nd -> Good 3rd target
If the daily candlestick forms before 9:00 AM tomorrow,
you can switch to a short position if the top section is touched.
You can also use the first section shown as a long position switching point.
If the price falls immediately without touching the purple finger at the top, the final long position is at the second level. The strategy was to place a stop-loss order from the breakout of the light blue support line until the possibility of a sideways movement.
From the breakout of the light blue support line, the price opens up to the bottom -> level 3, so long positions should be cautious.
Please use my analysis to this point for reference only.
I hope you operate safely, adhering to principled trading and a stop-loss order.
Thank you.
Trading Errors That Separate Winners from Losers1. Lack of a Trading Plan
One of the most glaring differences between winning and losing traders is the presence—or absence—of a clear trading plan.
Winners: Enter the market with a plan that covers entry criteria, exit points, risk tolerance, and position sizing. They know exactly why they are entering a trade and under what conditions they will exit, win or lose.
Losers: Trade impulsively, often chasing tips, reacting to news, or “winging it” based on emotions. Without predefined rules, they rely on hope and gut feelings, which are inconsistent and unreliable.
Think of it like driving without a destination or map—you may move, but you’re likely to get lost. Trading without a plan is essentially gambling.
2. Ignoring Risk Management
Risk management is often called the “holy grail” of trading. It is not glamorous, but it determines survival.
Winners: Risk only a small portion of their capital on each trade (often 1–2%). They use stop-loss orders, hedge positions, and understand the risk-reward ratio before entering a trade. They think in probabilities and know that protecting capital is more important than chasing quick gains.
Losers: Risk far too much on a single trade, sometimes even their entire account. They move stop-loss levels farther to avoid taking a small loss, only to suffer a devastating one later. A few bad trades can wipe out months or years of effort.
A classic rule says: “Take care of the downside, and the upside will take care of itself.” Winners live by this; losers ignore it.
3. Overtrading
Overtrading is one of the most common traps for beginners.
Winners: Understand that patience pays. They wait for high-probability setups, sometimes taking just a handful of trades in a week or month. They trade less, but smarter.
Losers: Feel the need to be in the market constantly. They confuse activity with productivity, opening positions based on boredom, fear of missing out (FOMO), or the illusion that “more trades = more profit.”
Overtrading not only increases transaction costs but also magnifies exposure to emotional mistakes.
4. Emotional Decision-Making
Markets are emotional arenas, and controlling psychology is as important as technical skill.
Winners: Maintain discipline and detach emotionally from trades. They accept losses as part of the business and move on without revenge-trading.
Losers: Allow fear, greed, hope, or frustration to dictate their moves. A small loss triggers panic. A big win creates overconfidence, leading to reckless bets. They chase losses, double down, or refuse to cut losers, turning manageable mistakes into disasters.
The famous trader Paul Tudor Jones once said: “Losers average losers.” This reflects the emotional trap of holding on to bad trades instead of accepting defeat.
5. Lack of Education and Preparation
Trading looks deceptively simple. Charts, news, and platforms are accessible to anyone. But without a strong foundation, losses are inevitable.
Winners: Invest time in education, study market structure, read books, analyze charts, and even backtest strategies. They treat trading as a profession, not a hobby.
Losers: Jump into markets unprepared, lured by promises of quick riches. They copy strategies without understanding them, rely on social media tips, or trade based on rumors.
In any competitive field—sports, medicine, law—training is essential. Trading is no different. Lack of preparation ensures failure.
6. Failure to Adapt
Markets are dynamic. What works today may not work tomorrow.
Winners: Adapt strategies to evolving conditions. If volatility rises, they adjust position sizing. If market structure changes, they reevaluate systems. They are flexible, constantly learning and evolving.
Losers: Stick rigidly to outdated methods or strategies, even when evidence shows they no longer work. They resist change, hoping markets will return to conditions where their strategy worked.
Adaptability is survival. Dinosaurs didn’t adapt and went extinct. Traders who fail to adapt face the same fate.
7. Neglecting the Importance of Psychology
Many traders focus only on technical indicators or news but ignore the psychology of trading.
Winners: Develop strong mental frameworks—discipline, patience, resilience. They understand cognitive biases like loss aversion, confirmation bias, and recency bias, and work to minimize their impact.
Losers: Are controlled by psychological traps. They believe they’re always right, seek only confirming evidence, and fear taking losses. This mindset sabotages even good strategies.
Trading is 80% psychology and 20% technique. Those who underestimate this imbalance often lose.
8. Unrealistic Expectations
Another error that separates losers from winners is expectation management.
Winners: Aim for consistent returns, not overnight riches. They understand compounding and set achievable goals. For them, trading is a marathon, not a sprint.
Losers: Expect to double their money every week, quit jobs overnight, or become millionaires in months. Such expectations lead to overleveraging, impulsive trades, and eventual ruin.
The harsh truth: trading is not a get-rich-quick scheme. Those who see it that way rarely last.
9. Ignoring Journal Keeping and Review
One of the simplest but most powerful tools in trading is a trading journal.
Winners: Keep detailed records of trades, including entry/exit, reasoning, emotions, and outcomes. They review mistakes, identify patterns, and refine strategies.
Losers: Don’t track trades. They forget mistakes, repeat them, and fail to see patterns of error.
Reviewing a journal is like a coach analyzing a game replay—it highlights strengths and weaknesses that cannot be seen in the heat of the moment.
10. Misuse of Leverage
Leverage magnifies both gains and losses.
Winners: Use leverage cautiously, only when setups are highly favorable. They ensure their accounts can handle drawdowns without panic.
Losers: Abuse leverage, turning small moves against them into catastrophic losses. They view leverage as a shortcut to quick profits, forgetting it’s a double-edged sword.
Many traders don’t fail because they are wrong, but because they are overleveraged when wrong.
11. Blindly Following Others
In today’s world, tips, social media, and chat groups flood traders with “advice.”
Winners: May listen to others but always do their own research before acting. They know that ultimately, their money is their responsibility.
Losers: Follow every tip or influencer without analysis. They jump on hype-driven moves, often buying at tops and selling at bottoms.
The herd mentality is strong in markets, but as Warren Buffett says: “Be fearful when others are greedy, and greedy when others are fearful.”
12. Lack of Patience and Discipline
Trading rewards patience and punishes impatience.
Winners: Can wait days or weeks for a setup that matches their rules. They avoid shortcuts and stick to discipline.
Losers: Want instant results. They break rules, enter trades prematurely, and exit too early out of fear.
Impatience turns strategy into chaos. Discipline turns chaos into consistency.
Conclusion: Turning Errors into Edges
The line between winning and losing traders isn’t about intelligence, luck, or even access to capital. It’s about behavior, discipline, and error management. Winners aren’t error-free—they simply make fewer critical mistakes and learn from every one. Losers repeat the same destructive errors until their capital or confidence runs out.
To move from losing to winning:
Create and follow a trading plan.
Prioritize risk management over profit.
Develop patience, discipline, and emotional control.
Treat trading as a profession—study, practice, and adapt.
Journal and review trades consistently.
The markets will always test you. But by avoiding these errors, you’ll stand among the minority who consistently extract profits rather than donate them.
BTC - LONGBitcoin has broken above the 200 EMA, confirming bullish bias.Price is supported by the 10 & 20 EMA crossover (short-term bullish trend). As long as BTC holds above $115,000, upside targets are $117,600 and then $120,000. If it loses $115,000, caution — the bullish setup may fail.

Trading in BTC Ideas for profitsThe "90% rule" in trading is a general observation, often called the 90/90/90 rule, which states that 90% of new traders lose 90% of their initial capital within the first 90 days of trading. This rule serves as a cautionary concept, highlighting the high failure rate among novice traders due to a lack of proper education, poor risk management, and emotional decision-making, rather than being a precise statistic

Bitcoin (BTC/USD) Outlook – 4H ChartBitcoin is showing strong bullish structure while trading around $114,200, respecting its ascending channel and aiming higher.
🔎 Bullish Signals:
Ascending Channel:
Price is moving within a clear upward channel, signaling a steady uptrend.
Support Confirmation:
Strong demand zone holding around $113,700 – $114,000.
As long as this level is protected, bulls remain in control.
Upside Targets:
$114,800 – First breakout resistance.
$115,900 – $116,200 – Key supply zone (once cleared, momentum may accelerate).
$117,200 – Next bullish extension target inside the channel.
Momentum Bias:
Candles are forming higher highs & higher lows – a classic bullish continuation pattern.
📌 Bullish Trading Plan:
Above $114K: Upside move towards $114.8K → $115.9K → $117.2K.
Only if $113.7K breaks: Short-term retracement possible, but bias stays bullish inside channel.
#BTC #Crypto #BitcoinAnalysis #BTCUSD #CryptoTrading

BTCUSD 1D Time frame📈 Price Action
Previous Close: $113,897.00
Day’s Range: $112,204.00 – $114,451.00
Current Price: $113,897.00
🔧 Technical Indicators
Relative Strength Index (14): 55.39 — Indicates neutral momentum.
MACD: Positive — Suggests upward trend.
Moving Averages:
5-day MA: $112,545.50
20-day MA: $112,519.63
50-day MA: $114,828.28
100-day MA: $109,519.30
200-day MA: $101,144.13
Stochastic Oscillator (14): 67.91% — Indicates bullish momentum.
Average True Range (ATR): $3,177.03 — Suggests moderate volatility.
Directional Movement Index (ADX): 10.23 — Indicates a weak trend.
📊 Support & Resistance Levels
Immediate Support: $112,000
Immediate Resistance: $115,000
🧠 Trend Analysis
Trend: Neutral to bullish
Momentum: Positive
Volatility: Moderate
Summary: Bitcoin is currently trading near $113,897, showing a neutral to bullish trend with positive momentum. The 50-day moving average is above the current price, indicating potential upward movement. Traders should monitor the support level at $112,000 and resistance at $115,000 for potential breakout opportunities.

Bitcoin – Trend Update Ahead of PPIBitcoin – Trend Update Ahead of PPI
Hello Traders,
The current scenario for Bitcoin is unfolding in line with expectations, with the uptrend continuing to develop strongly. Price waves are moving with solid volume, and the overall structure is progressing exactly as anticipated.
Key Levels
Price has broken through the 113k zone, confirming that the bullish trend is intact. This move increases the likelihood of completing the final wave of the inverse head-and-shoulders pattern.
The next level to watch is around 116k, where a mild reaction or pullback may occur before the trend resumes higher towards the 121k region.
Special attention should be given to the 117k level, as this marks the potential completion of the inverse head-and-shoulders structure. At this point, price may consolidate before establishing a new primary trend.
Trading View
For now, it remains important to follow the prevailing uptrend. Any shift in price structure will require re-evaluation, and updated strategies should be applied only after clear confirmation.
This is my latest outlook on Bitcoin ahead of the PPI release. I hope this perspective proves useful in shaping your trading approach.

Bitcoin (BTCUSD)Buy Setup - Smart Entry PlanCurrent Plan:
I am looking for a buy opportunity in BTC around the current structure, with a split-entry approach for better positioning.
---
🔹 Entry Strategy
50% position: Buy now at 113200
50% position: Add on retest near 111500
This helps average into the trade with reduced risk in case of further retracement.
---
🔹 Risk Management
Stop Loss (SL): 108500 (below liquidity zone & structure)
---
🔹 Target Plan
TP1: 115900 (first partial take-profit)
TP2: Trail stop with the latest swing low to capture the extended upside.
---
🔹 Market Context
BTC is showing bullish structure after sweeping liquidity on lower timeframes. A retracement into demand zones (111500 area) can offer a discounted entry. By scaling in, we balance between catching momentum early and securing a safer re-entry if price dips.
---
📌 Trading Note
Patience is key – Buy in 2 Parts only (Not financial advice it's only for education)

Part 3 Institutional Trading Option Styles and Formats
Options come in various forms to suit different strategies:
Vanilla Options: Standard call and put options traded on exchanges.
Exotic Options: Options with complex structures, including barrier, digital, and Asian options.
LEAPS: Long-term options with expiration dates up to three years.
Participants in Option Trading
Option markets attract a range of participants:
Hedgers: Protect existing positions from adverse price movements.
Speculators: Seek to profit from directional price changes or volatility.
Arbitrageurs: Exploit price differences between markets or instruments.
Market Makers: Provide liquidity by quoting buy and sell prices for options.
Advantages of Option Trading
Option trading offers several benefits over traditional trading:
Leverage: Control large positions with smaller capital.
Flexibility: Wide range of strategies for bullish, bearish, and neutral markets.
Risk Management: Ability to hedge stock portfolios and limit losses.
Income Generation: Selling options (writing) generates premium income.
Speculation Opportunities: Capitalize on volatility without owning the underlying asset.

BITCOIN GOINGTO BOOMAfter completing the ascending diagonal, Bitcoin has confirmed a trend reversal and is now moving into an uptrend. The contracting triangle has also completed, and Bitcoin is entering the 3rd wave, with the first target at 119,437.

BTCUSD📍 BTCUSD – 1H Key Levels
🔹 Support Zones
$55,200 – $55,500 → Immediate intraday support
$54,500 – $54,800 → Strong support zone, buyers likely to defend here
$53,800 – $54,000 → Major support, breakdown here could trigger deeper correction
🔹 Resistance Zones
$56,800 – $57,000 → Immediate 1H resistance
$57,800 – $58,200 → Strong resistance, breakout can fuel further upside
$59,000 – $59,500 → Major resistance, likely to act as a supply zone
⚖️ Quick Summary
As long as BTCUSD trades above $55,500, short-term bias remains bullish.
Breakout above $57,000 may push price towards $58,200 – $59,500.
Breakdown below $54,800 may drag price back towards $54,000 – $53,800.
Current 1H bias: Range-bound to bullish, waiting for a breakout from $55,500 – $57,000 zone.

Bitcoin – Current Trend UpdateBitcoin – Current Trend Update
Hello Traders,
Bitcoin continues to follow the structure of an inverse head-and-shoulders pattern, which has not yet been invalidated. After testing the 113.5k zone, price once again reacted lower – this marks the third rejection at this level, confirming it as a key resistance area. For BTC to sustain its bullish momentum and complete the final wave of the formation, this zone will be crucial.
Scenarios to Watch
Bullish Case: The uptrend remains intact as long as price holds above 109k. In this case, buying opportunities are still valid.
Bearish Case: A sustained close below 109k would invalidate the bullish outlook and activate a bearish scenario. Traders should wait for confirmation before committing to shorts.
Short-Term View
On the lower timeframes, BTC is moving within a sideways range. For intraday traders, range strategies such as buying near support and selling near resistance can still be applied until a clear breakout occurs.
Market Sentiment
At the moment, most of the market’s attention is shifting towards gold, leaving Bitcoin with relatively lower momentum. This may keep BTC trading in a tighter range, so traders should lower expectations for strong volatility in the immediate term.
This is my trading outlook for today. Use it as a reference and feel free to share your own perspectives in the comments.


Cryptocurrency & Digital Assets1. Origins of Cryptocurrency
1.1 The Pre-Bitcoin Era
Before Bitcoin, several attempts were made to create digital money:
eCash (1990s): David Chaum proposed digital cash using cryptographic techniques.
Hashcash (1997): Adam Back’s proof-of-work system designed to fight email spam later became foundational for Bitcoin mining.
b-Money & Bit Gold (1998–2005): Early proposals by Wei Dai and Nick Szabo envisioned decentralized money but lacked implementation.
These projects failed to solve the “double-spending problem”—the risk that digital tokens could be copied and spent multiple times.
1.2 The Birth of Bitcoin (2009)
Satoshi Nakamoto introduced Bitcoin in 2009 through the famous whitepaper “Bitcoin: A Peer-to-Peer Electronic Cash System.”
Blockchain innovation: Solved double-spending via distributed ledger and consensus.
Decentralization: No central authority; nodes validate transactions.
Scarcity: Bitcoin supply capped at 21 million, making it “digital gold.”
Bitcoin created a trustless, peer-to-peer payment network, laying the foundation for the broader crypto revolution.
2. Understanding Blockchain Technology
Cryptocurrencies and digital assets rely on blockchain, a distributed, immutable ledger.
2.1 Key Features of Blockchain
Decentralization: No single point of control.
Transparency: Transactions are visible on public blockchains.
Immutability: Once data is recorded, it cannot be altered.
Consensus mechanisms: Ensure network agreement without central authority (e.g., Proof-of-Work, Proof-of-Stake).
2.2 Types of Blockchains
Public Blockchains (Bitcoin, Ethereum) – Open, permissionless networks.
Private Blockchains – Controlled by organizations for specific use cases.
Consortium Blockchains – Shared control among multiple institutions.
Hybrid Models – Combining public and private features.
2.3 Smart Contracts
Introduced by Ethereum (2015).
Self-executing agreements coded on blockchain.
Enabled decentralized apps (dApps) and DeFi.
3. Categories of Digital Assets
Digital assets are not limited to cryptocurrencies. They encompass a wide variety of innovations:
3.1 Cryptocurrencies
Bitcoin (BTC): Digital gold, store of value.
Ethereum (ETH): Smart contract platform powering DeFi and NFTs.
Altcoins: Thousands of other tokens with specialized use cases (e.g., Solana, Cardano, Avalanche).
3.2 Stablecoins
Pegged to fiat currencies like USD (e.g., USDT, USDC, DAI).
Provide price stability for trading and remittances.
Crucial for DeFi liquidity.
3.3 Central Bank Digital Currencies (CBDCs)
Digital versions of fiat currencies issued by central banks.
Examples: China’s Digital Yuan, pilot projects by the European Central Bank, India’s Digital Rupee.
Aim to modernize payments while maintaining government control.
3.4 Utility Tokens
Provide access to specific services (e.g., Binance Coin for exchange fees).
Not necessarily designed as money but as functional tools.
3.5 Security Tokens
Represent ownership in real-world assets (stocks, bonds, real estate).
Regulated under securities laws.
3.6 Non-Fungible Tokens (NFTs)
Unique digital assets representing art, music, gaming items.
Built on Ethereum ERC-721 standard.
Sparked boom in digital collectibles and virtual real estate.
3.7 Tokenized Real-World Assets
Real estate, commodities, bonds can be represented as tokens.
Increases liquidity and fractional ownership opportunities.
4. Use Cases of Cryptocurrency & Digital Assets
Payments & Remittances: Low-cost, borderless transfers (e.g., Bitcoin Lightning Network).
DeFi (Decentralized Finance): Lending, borrowing, trading without intermediaries.
Investment & Hedging: Store of value against inflation and currency devaluation.
Micropayments: Enabling new business models in gaming, content, and streaming.
Supply Chain Management: Blockchain-based tracking of goods (e.g., IBM Food Trust).
Identity Verification: Secure and decentralized digital identities.
Gaming & Metaverse: Play-to-earn models, virtual land trading.
Tokenization of Assets: Unlocking liquidity in illiquid markets like real estate.
5. Benefits of Cryptocurrency & Digital Assets
Decentralization & Financial Inclusion: Access to banking for the unbanked.
Transparency & Security: Immutable records reduce fraud.
Global Accessibility: Borderless transactions 24/7.
Programmability: Smart contracts automate processes.
Hedge Against Inflation: Limited supply assets like Bitcoin act as digital gold.
Efficiency: Faster settlement compared to traditional systems.
6. Risks & Challenges
Despite advantages, crypto faces significant risks:
6.1 Market Risks
Volatility: Prices can swing dramatically.
Speculation: Many tokens lack real utility.
6.2 Security Risks
Hacks & Exploits: DeFi protocols vulnerable to attacks.
Private Key Loss: No recovery if keys are lost.
6.3 Regulatory Uncertainty
Governments vary: Some embrace (Switzerland, Singapore), others ban (China).
Unclear legal frameworks for securities vs. utilities.
6.4 Environmental Concerns
Proof-of-Work mining consumes large energy (Bitcoin).
Shift to Proof-of-Stake reduces footprint.
6.5 Scams & Frauds
Ponzi schemes, rug pulls, fake ICOs damage reputation.
7. Regulation of Cryptocurrency & Digital Assets
7.1 Global Approaches
United States: SEC, CFTC, and Treasury provide oversight. Ongoing debates about classification.
European Union: Introduced MiCA (Markets in Crypto-Assets) regulation in 2023.
India: No outright ban, but heavy taxation (30% on profits, 1% TDS). Exploring Digital Rupee.
China: Outright ban on crypto trading, but strong push for Digital Yuan.
7.2 Key Regulatory Concerns
Investor protection.
Anti-Money Laundering (AML) & Know-Your-Customer (KYC) compliance.
Preventing terrorism financing.
Ensuring tax compliance.
8. The Future of Cryptocurrency & Digital Assets
Mainstream Adoption: Increasing role in retail payments, cross-border trade.
Integration with Traditional Finance: Tokenization of bonds, stocks, real estate.
DeFi 2.0: Safer, more regulated platforms attracting institutions.
CBDCs: Could coexist with cryptocurrencies, bridging state control and innovation.
NFT Evolution: Moving beyond art to utility-driven assets (tickets, certifications).
Metaverse Economy: Digital assets forming the backbone of virtual worlds.
Interoperability & Layer 2 Solutions: Better scaling, faster transactions.
Institutional Involvement: Hedge funds, pension funds increasingly exploring crypto.
9. Case Studies
9.1 Bitcoin in El Salvador
First country to adopt Bitcoin as legal tender (2021).
Boosted financial inclusion but faced criticism over volatility.
9.2 Stablecoins in DeFi
USDT, USDC power most decentralized exchanges.
Provide liquidity while avoiding volatility of regular cryptos.
9.3 NFTs in Art & Gaming
Beeple’s $69M NFT sale (2021) marked turning point.
Games like Axie Infinity showed potential of play-to-earn economies.
9.4 Tokenized Real Estate
Platforms like RealT allow fractional ownership of US properties via tokens.
10. Conclusion
Cryptocurrency and digital assets represent one of the most disruptive financial innovations of our era. They redefine money, ownership, and trust in the digital age. While risks exist—volatility, regulatory uncertainty, scams—the transformative potential cannot be ignored.
From empowering the unbanked to reshaping global finance, digital assets may be as revolutionary as the internet itself. The future likely holds a hybrid system, where cryptocurrencies, stablecoins, tokenized assets, and CBDCs coexist, offering individuals and institutions new ways to store, transfer, and invest value.
For investors, businesses, and policymakers, the key lies in balancing innovation with regulation, ensuring safety while unlocking the vast potential of this new digital economy.

Option Trading How Options are Priced
One of the trickiest aspects of options is pricing. Unlike stocks (where price is direct), option prices are influenced by multiple variables.
Components of Option Pricing
Intrinsic Value – The real value if exercised today.
Call = Spot Price – Strike Price
Put = Strike Price – Spot Price
Time Value – Extra premium traders pay for the possibility that the option may gain value before expiry.
The Greeks
Options traders rely on “Greeks” to understand how different factors impact prices:
Delta: Sensitivity to price changes of underlying.
Gamma: Rate of change of Delta.
Theta: Time decay of the option’s value.
Vega: Sensitivity to volatility changes.
Rho: Sensitivity to interest rates.
Volatility
Volatility plays a huge role. Higher volatility = higher premiums. There are two types:
Historical Volatility – Past market movement.
Implied Volatility (IV) – Market’s expectation of future volatility.
Black-Scholes Model
Developed in 1973, it uses mathematical formulas to calculate fair value of options considering spot price, strike price, time to expiry, volatility, and interest rates.

Bitcoin – Short-Term Trend ScenarioBitcoin – Short-Term Trend Scenario
Hello Traders,
Bitcoin is maintaining a bullish tone in the short term while still moving within a corrective structure on the medium-term horizon.
Chart Patterns
On the chart, a double-bottom formation has already completed and confirmed.
In a broader view, the market appears to be progressing towards a potential inverse head-and-shoulders pattern, with the current wave contributing to its completion. This structure would be confirmed if price retests the 117k zone.
Elliott Wave Outlook
From an Elliott Wave perspective, the current structure suggests that wave C has not yet been completed, leaving room for further upside.
MACD & Volume
MACD signals, along with trading volumes holding above average, continue to support the buying side, strengthening the bullish bias.
Trading Strategy
Long positions remain the preferred approach.
The 111k level stands out as a favourable intraday buying zone today, with higher probability of success if price pulls deeper into the rising trendline.
Conclusion
Technical signals collectively favour the bullish case for BTC in the short term. Monitoring reactions at the 111k zone and along the trendline will be essential for optimising entries. This is my perspective on the current market – feel free to share your own views in the comments.

Price Action & Market StructurePart 1: Understanding Price Action
What is Price Action?
Price action refers to the movement of price plotted over time, without relying heavily on indicators. It studies the open, high, low, and close of candles or bars, combined with patterns, to forecast future movements.
Traders use price action to:
Identify market sentiment (bullish or bearish).
Spot areas of support and resistance.
Recognize chart patterns like triangles, flags, or head & shoulders.
Time entries and exits without clutter.
Core Elements of Price Action
Candlesticks – Each candlestick tells a story of supply and demand in a given time frame.
Bullish candles show dominance of buyers.
Bearish candles reflect sellers in control.
Long wicks indicate rejection of certain price levels.
Price Swings – Highs and lows are critical. They reveal whether the market is making higher highs/lows (uptrend) or lower highs/lows (downtrend).
Support & Resistance – Price action revolves around zones where price repeatedly reacts.
Support: a floor where buyers step in.
Resistance: a ceiling where sellers dominate.
Trendlines & Channels – Connecting swing highs or lows provides insight into the prevailing direction and potential breakout points.
Chart Patterns – Price action often forms recognizable patterns:
Continuation patterns: flags, pennants, triangles.
Reversal patterns: double top/bottom, head & shoulders, rounding bottom.
Part 2: Understanding Market Structure
What is Market Structure?
Market structure refers to the framework of how price moves through trends and consolidations. It is the “map” of the market, showing whether buyers or sellers are in control and how momentum shifts.
The structure can be broken into three main types:
Uptrend (bullish structure) – Higher highs (HH) and higher lows (HL).
Downtrend (bearish structure) – Lower highs (LH) and lower lows (LL).
Sideways (range-bound) – Price oscillates between support and resistance without clear trend.
Why Market Structure Matters
It provides context before placing trades.
Prevents trading against the dominant flow.
Helps identify when trends are about to reverse.
Acts as the backbone of supply and demand zones.
Anatomy of Market Structure
Impulse and Correction – Markets move in waves.
Impulse: strong directional move (trending leg).
Correction: smaller pullback before continuation or reversal.
Break of Structure (BOS) – A key event where price breaks past previous highs/lows, signaling trend continuation or reversal.
Market Phases
Accumulation: Institutions build positions quietly (range).
Markup: Trend begins (sharp price rally).
Distribution: Positions are offloaded (range or topping pattern).
Markdown: Price declines as sellers dominate.
Part 3: Price Action & Market Structure Combined
When combined, price action and market structure become a powerful toolkit:
Identify Market Structure – Determine if market is trending up, down, or sideways.
Use Price Action Signals – Look for candlestick rejections, patterns, or false breakouts at key structure points.
Validate with Support/Resistance or Supply/Demand Zones – Enter trades where price reacts strongly.
Set Risk Management – Place stops beyond structure zones (swing highs/lows).
For example:
In an uptrend, wait for price to pull back to a support level, then look for bullish candlestick patterns (hammer, engulfing) to confirm entry.
In a downtrend, wait for a retracement to resistance, then look for bearish rejection candles.
Part 4: Key Price Action Patterns within Market Structure
Pin Bar (Hammer / Shooting Star)
Signals rejection of price levels.
Works best at structure zones (support/resistance).
Engulfing Candle
A strong reversal signal when a large candle completely engulfs the previous one.
Inside Bar
Market consolidation before a breakout.
Double Top / Double Bottom
Classic reversal structures.
Head & Shoulders
Bearish reversal pattern at market tops.
Breakout & Retest
Price breaks structure and retests before continuation.
Part 5: Advanced Concepts
Supply & Demand Zones
Institutions leave “footprints” in the form of supply (where heavy selling originates) and demand zones (where aggressive buying starts). Identifying these zones within structure gives high-probability trade setups.
Liquidity Hunts (Stop Hunts)
Markets often move to trigger retail stop-losses before continuing in the intended direction. Recognizing liquidity pools near swing highs/lows is critical.
Order Flow & Market Manipulation
Big players manipulate price briefly before pushing it in the desired direction. Price action analysis allows traders to see these traps.
Part 6: Practical Trading Approach
Step 1: Multi-Timeframe Analysis
Start with higher timeframe (daily/weekly) to identify major structure.
Drop down to lower timeframes (1H/15M) for entries.
Step 2: Mark Structure & Zones
Draw key swing highs/lows.
Identify supply/demand or support/resistance.
Step 3: Wait for Price Action Confirmation
Look for rejection wicks, engulfing patterns, or BOS signals.
Step 4: Execute with Risk Management
Risk only 1–2% per trade.
Place stop beyond invalidation level (swing high/low).
Step 5: Trade Management
Scale out partial profits at key levels.
Trail stop-loss in trending markets.
Part 7: Psychology Behind Price Action & Structure
Trading without indicators forces traders to “see the market naked.” This can be intimidating but also liberating. Success depends on:
Patience: waiting for structure alignment and confirmation.
Discipline: not chasing every move.
Confidence: trusting the simplicity of price action.
Part 8: Case Studies
Example 1: Uptrend Continuation
Market forms HH & HL.
Pullback to demand zone.
Bullish engulfing candle appears.
Long entry → ride trend until new resistance forms.
Example 2: Trend Reversal
Market breaks below previous HL (BOS).
Retest as new resistance.
Shooting star candle appears.
Short entry → ride markdown phase.
Part 9: Common Mistakes in Price Action & Market Structure
Trading without higher timeframe context.
Misidentifying ranges as trends.
Entering trades without confirmation.
Overcomplicating with too many trendlines.
Ignoring risk management.
Part 10: Conclusion
Price action and market structure together form the backbone of professional trading. Instead of relying on lagging indicators, traders learn to read the “story” of price and align with institutional moves.
Key takeaways:
Price action reveals real-time market psychology.
Market structure provides the framework for trends and reversals.
Combining them gives a high-probability edge.
Success depends on patience, discipline, and risk control.
In essence, trading with price action and market structure is about aligning yourself with the natural rhythm of the market. The more you practice, the clearer the story of price becomes, and the greater your confidence in executing profitable trades.

BTCUSDAfter an extended period of sideways consolidation, BTC/USD now appears poised for an upward move. The pair is currently retesting a key support zone, and if this level continues to hold, it could serve as a strong foundation for the next bullish leg.

Btc sell Btc sell here
Because the Market goes up i conferm
This is counter trade
This short selling move is a trap
But hum trend ke against bhi market pakadte hai

H&S in the making?Watch out for the possible H&S pattern in the making on the 6H chart of $BITSTAMP:BTCUSD. If the prices don't breach $109,900 on the downside, and move back up, $113,400 would be the neckline for the breakout.
