BTC/USDThe BTC/USD trade with an entry price of 109,492, stop-loss at 108,687, and exit price at 111,161 is a short-term buy trade setup designed to capture upward momentum in Bitcoin. The trade aims for a profit of about 1,669 points while risking around 805 points, giving a favorable risk-to-reward ratio of nearly 1:2, which is ideal for consistent trading results.
The entry price at 109,492 is chosen strategically, likely after confirmation of bullish signals such as a bounce from support, a trendline reversal, or indicators like RSI and MACD showing upward momentum. Entering at this level suggests confidence that BTC/USD would rise toward the target zone.
The stop-loss at 108,687 is placed below a nearby support level, ensuring downside protection if the market moves unexpectedly against the trade. This prevents large losses and maintains discipline in risk management.
The exit price at 111,161 is the take-profit target, likely aligned with a resistance zone. Securing profits at this level ensures gains are locked in before any potential pullback.
Overall, this setup highlights disciplined planning, strong technical analysis, and strict risk control, which are essential for trading successfully in the volatile BTC/USD market.
BTCUSD.P trade ideas

Bitcoin / USD – 15m Short Sell In this setup, I’m tracking BTC price action using the Fear Index (21) and Trend Shift Histogram (14) as confluence indicators for potential entries.
🔻 Key Observations:
The Fear Index showed a strong spike before the sharp sell-off, indicating growing selling pressure.
The Trend Shift Histogram gave multiple bearish signals (highlighted with arrows), aligning with the price rejection and downward continuation.
After the heavy drop, BTC attempted a recovery but faced resistance within the marked zone, forming a bearish retest.
📌 Trade Setup:
Short entry taken on confirmation of bearish trend shift.
Stop loss placed above the rejection zone.
Target aligned with the momentum continuation shown by the histogram and fear index.
⚡️ Conclusion:
This setup highlights how combining sentiment-based indicators (Fear Index) with momentum confirmation (Trend Shift Histogram) can help anticipate strong market moves. Always manage risk carefully, as volatility in lower timeframes can be sharp.

Bitcoin – Trading Plan Update Bitcoin – Trading Plan Update
Hello traders,
The BTC scenario has played out well, with price reacting strongly at 110.4k and bouncing higher. This level has cleared much of the short-side liquidity, while the H4 candle could not close below the 111.8k support. As a result, long entries around 110k can still be expected to target higher levels, at least towards 115.5k.
The primary focus remains on the long side as long as price does not confirm a sustained bearish move. Long positions will remain valid until price breaks decisively below 110k.
For traders who already closed longs or missed the earlier entry, wait for a retest of the FVG zone near 111.5k. If price reacts higher, fresh longs around 113k can be considered.
Short-term selling opportunities may also appear near 115.5k and 117.2k, where price could face resistance.
My BTC strategies are still aligning well with current price action. That said, this is my personal outlook based on my trading method. Please trade responsibly, stick to your own plan, and manage risk carefully.
What’s your view on BTC right now? Share your thoughts in the comments below.
Part 1 Support and ResistanceCall and Put Options in Action
Call Option Example
Reliance is trading at ₹2500.
You buy a 1-month call option with strike price ₹2550, premium ₹50, lot size 505.
If Reliance rises to ₹2700 → Profit = (2700 - 2550 - 50) × 505 = ₹50,500.
If Reliance falls below 2550 → You lose only the premium (₹25,250).
Put Option Example
Nifty is at 20,000.
You buy a 1-month put option, strike 19,800, premium 100, lot size 50.
If Nifty falls to 19,200 → Profit = (19,800 - 19,200 - 100) × 50 = ₹25,000.
If Nifty rises above 19,800 → You lose premium (₹5,000).
Participants in Options Trading
Option Buyer – Pays premium, has limited risk and unlimited profit potential.
Option Seller (Writer) – Receives premium, has limited profit and potentially unlimited risk.
Example:
Buyer of call: Unlimited upside, limited loss (premium).
Seller of call: Limited profit (premium), unlimited loss if stock rises.

Bitcoin Bybit chart analysis August 22Hello
It's a Bitcoin Guide.
If you "follow"
You can receive real-time movement paths and comment notifications on major sections.
If my analysis was helpful,
Please click the booster button at the bottom.
This is the Nasdaq 30-minute chart.
There are no separate indicators released.
Roughly speaking,
the strategy is to switch from short to long at the light blue finger, or to wait long at the bottom.
The bottom is today's major support line and the 6+12 pattern recovery point.
If the price moves along the light blue finger path,
there's a possibility that it will eventually fall to touch the 6+12 level again.
Please note this.
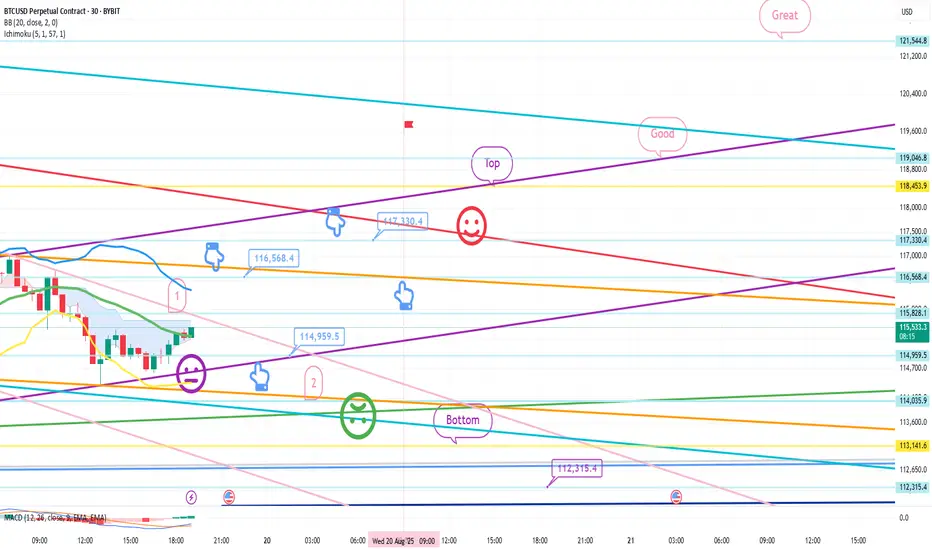
I applied this directly to Bitcoin.
This is a 30-minute Bitcoin chart.
The Nasdaq is moving sideways in a downward trend,
while Bitcoin has continued its vertical decline after hitting a new high.
*If the blue finger moves along the path,
switch from short to long. Or, if it immediately declines, wait long in the second section.
This is a two-way neutral strategy.
1. $116,568.4 short position entry point / Stop loss price if the orange resistance line is broken.
2. $114,959.5 long position switch / Stop loss price if the purple support line is broken.
3. $117,330.4 long position first target / 116.5K long position re-entry point.
After this, long position target prices are listed in order of Top, Good, and Great.
The first point above is the best short position entry point for today.
If the price declines around the first touch, hold long at the second point.
Stop loss price if the green support line is broken.
In the case of Bitcoin, the candlestick is breaking out of the 12+ daily pattern,
and the downside is open.
If the bottom point is maintained, the mid-term uptrend will be broken.
-> If the bottom point is broken out, the mid-term uptrend will be broken. A medium-term downtrend may be forming.
(MACD dead cross on weekly chart)
If the Nasdaq only moves sideways, that's good,
but if it declines, BTC could fall even more sharply.
Due to low participation, I decided to take a break this week,
but I've had some free time, so I'm sharing this with everyone for the first time in a while.
Please use my analysis for reference only.
I hope you operate safely, with a focus on principled trading and stop-loss orders.
Thank you.
BTC | Distribution Warning at the TopWeekly Frame - MACD Histogram
Daily Frame - Oscillator RSI
BTC cleared $112k ATH but follow-through is weak (only ~13.5% vs 48.5% in the 2024 impulse). Weekly MACD histogram is rolling toward/under zero, ETF flows show recent net outflows, and on-chain data says many wallets are in profit — a classic distribution setup. Expect higher short-term downside risk until proven otherwise.
What to watch (signals): a decisive weekly / daily close below the Jul 7 weekly low (~$107.4k) would be a major bearish trigger and likely open a move toward $99k → $88–90k. Conversely, a sustained weekly close above the current distribution zone + renewed ETF inflows would invalidate the bear case and allow a retest of $120k+.
Short setup (early entry): look for rejection in the $112k area with confirmation (D/H4 bearish candle + rising sell volume). Suggested stop > $117k (protect against false breakouts). Initial targets: $107k, then $99k if momentum continues. Use scaled entries and confirm with volume / on-chain metrics.
Risk management: reduce leverage, keep position sizes small, and never trade full size into macro windows (Fed/PCE/NFP). Require at least one flow or volume confirmation before adding. If you prefer safer trades, wait for a confirmed breakout (H4/D close) in either direction.
#BTC #BTCUSD #Bitcoin #crypto #TA #MACD #RSI #OnChain #ETFflows #TradingView
BTC/USD Bearish Retest Setup – Eye on 106.6K TargetTrend: BTC is in a downtrend channel (rejection line above, support line below).
EMA Signals: Price is trading below EMA 70 & EMA 200 → bearish bias remains strong.
Supply & Demand:
Support zone: around 112,000 – 112,500 (price just bounced).
RBR Supply zone: 114,300 – 116,000 where sellers are likely waiting.
📊 Strategies in play
Support–Resistance: Bounce at support, retest expected at supply zone.
EMA Strategy: Bearish since candles trade under 200 EMA.
Break & Retest: Price could retest supply before resuming drop.
Target Projection: If rejection at supply holds, target = 106,600 zone (chart target point).
⚖️ Risks
A clean break above 116,000 would invalidate bearish setup and open room for reversal.
Range trading possible between 112k–116k before breakout.
✅ Summary: BTC short-term bias remains bearish. Expect retest of 114.3k–116k supply before continuation lower toward 106.6k target. Only a strong breakout above 116k flips the trend bullish.

Options Trading Strategies1. Introduction to Options Trading
Options are one of the most versatile financial instruments available in the stock market. Unlike straightforward stock trading, where you buy or sell shares, options give you the right but not the obligation to buy or sell an underlying asset at a pre-determined price within a specific time.
Because of their flexibility, options allow traders to:
Hedge against risk,
Generate income,
Speculate on market direction, or
Even profit from volatility itself.
Options trading strategies are structured combinations of options (calls, puts, or both) that help traders tailor risk and reward according to their outlook. Understanding these strategies is essential because options are a double-edged sword: they can multiply profits but also magnify risks if used incorrectly.
2. Basics of Options
Before diving into strategies, let’s recap the key concepts:
Call Option → Right to buy the asset at a certain price. (Bullish in nature)
Put Option → Right to sell the asset at a certain price. (Bearish in nature)
Strike Price → Pre-decided price at which the option can be exercised.
Premium → Cost of buying the option.
Expiry → The date on which the option contract ends.
In the Money (ITM) → Option has intrinsic value.
Out of the Money (OTM) → Option has no intrinsic value, only time value.
Understanding these basics is critical because all option strategies are built using calls and puts in different combinations.
3. Why Use Option Strategies?
Traders and investors don’t just buy calls and puts randomly. Instead, they use structured strategies to achieve specific goals:
Hedging: Protecting a stock portfolio against downside risk.
Income Generation: Earning premium by selling options.
Speculation: Taking directional bets with limited risk.
Volatility Trading: Profiting from changes in implied volatility regardless of direction.
4. Categories of Option Strategies
Option strategies can be grouped into four main categories:
Bullish Strategies → Profit when the market rises (e.g., Bull Call Spread, Covered Call).
Bearish Strategies → Profit when the market falls (e.g., Bear Put Spread, Protective Put).
Neutral Strategies → Profit when the market stays in a range (e.g., Iron Condor, Butterfly).
Volatility Strategies → Profit from volatility expansion/contraction (e.g., Straddle, Strangle).
5. Popular Options Trading Strategies
Let’s dive into some of the most commonly used strategies with examples, payoff logic, pros, and cons.
5.1 Covered Call (Income Strategy)
How it works: Hold the stock + sell a call option.
Example: Own 100 shares of Reliance at ₹2,500. Sell a call with strike ₹2,600 for ₹30 premium.
Payoff:
If Reliance stays below ₹2,600 → keep shares + earn ₹30 premium.
If Reliance rises above ₹2,600 → shares are sold at ₹2,600 but you still keep the premium.
Pros: Steady income, reduces cost of holding.
Cons: Caps upside potential.
5.2 Protective Put (Insurance Strategy)
How it works: Hold stock + buy a put option.
Example: Buy Infosys at ₹1,400. Buy a put with strike ₹1,350 at ₹20 premium.
Payoff:
If stock rises → unlimited upside, only premium lost.
If stock falls → downside limited at strike price.
Pros: Protects against big losses.
Cons: Premium cost reduces profit.
5.3 Bull Call Spread (Moderately Bullish)
How it works: Buy a lower strike call + Sell a higher strike call.
Example: Buy Nifty 19,800 Call at ₹200, Sell 20,200 Call at ₹80. Net cost = ₹120.
Payoff:
Max profit = Difference in strikes – net premium = ₹400 – ₹120 = ₹280.
Max loss = ₹120 (premium paid).
Pros: Limited risk, limited reward.
Cons: Capped profit even if market rallies big.
5.4 Bear Put Spread (Moderately Bearish)
How it works: Buy a higher strike put + sell a lower strike put.
Example: Buy 19,800 Put at ₹220, Sell 19,400 Put at ₹100. Net cost = ₹120.
Payoff:
Max profit = Difference in strikes – net premium = ₹400 – ₹120 = ₹280.
Max loss = ₹120 (premium).
Pros: Controlled bearish play.
Cons: Capped profit.
5.5 Straddle (Volatility Play)
How it works: Buy 1 Call + 1 Put of the same strike.
Example: Nifty at 20,000 → Buy 20,000 Call (₹200) + Buy 20,000 Put (₹180). Total = ₹380.
Payoff:
If Nifty moves sharply either side (>₹380), profit.
If Nifty stays near 20,000, loss of premium.
Pros: Profits from big moves.
Cons: Expensive, time decay hurts if market is flat.
5.6 Strangle (Cheaper Volatility Play)
How it works: Buy OTM Call + OTM Put.
Example: Buy 20,200 Call (₹120) + Buy 19,800 Put (₹100). Cost = ₹220.
Payoff: Needs larger move than straddle, but cheaper.
Pros: Lower cost.
Cons: Requires significant market move.
5.7 Iron Condor (Range-Bound Strategy)
How it works: Combine a Bull Put Spread + Bear Call Spread.
Example:
Sell 19,800 Put, Buy 19,600 Put.
Sell 20,200 Call, Buy 20,400 Call.
Payoff: Profit if Nifty stays between 19,800–20,200.
Pros: Income from stable markets.
Cons: Risk if market breaks range.
5.8 Butterfly Spread (Range-Bound, Low Risk)
How it works: Buy 1 ITM Call, Sell 2 ATM Calls, Buy 1 OTM Call.
Example:
Buy 19,800 Call, Sell 2×20,000 Calls, Buy 20,200 Call.
Payoff: Max profit if expiry near middle strike (20,000).
Pros: Low risk, good for low-volatility outlook.
Cons: Limited reward, needs precise prediction.
5.9 Collar Strategy (Hedged Investment)
How it works: Own stock + Buy Put + Sell Call.
Purpose: Locks range of returns.
Example: Own stock at ₹1,000. Buy 950 Put, Sell 1,050 Call.
Pros: Protects downside at low cost.
Cons: Caps upside.
5.10 Calendar Spread (Time-based Play)
How it works: Sell near-term option + Buy long-term option of same strike.
Profit: From time decay of short option while holding longer-term exposure.
Best used: In low-volatility environments.
6. Risk-Reward Analysis
Limited Risk Strategies: Spreads, Condors, Butterflies.
Unlimited Profit Potential: Long Calls, Long Puts, Straddles.
Income-Oriented: Covered Calls, Iron Condor, Credit Spreads.
Hedging-Oriented: Protective Puts, Collars.
7. How to Choose the Right Strategy
Factors to consider:
Market View (Bullish, Bearish, Neutral).
Volatility Outlook (High, Low, Expected to rise/fall).
Risk Appetite (Aggressive vs Conservative).
Capital Availability (Some require margin).
8. Common Mistakes in Option Strategies
Over-leveraging (buying too many contracts).
Ignoring time decay (theta).
Trading only naked options without strategy.
Not adjusting positions when market moves.
Misjudging volatility.
9. Advanced Insights
Option Greeks: Delta, Gamma, Theta, Vega, Rho – help measure sensitivity to price, time, and volatility.
Implied Volatility (IV): Crucial in pricing; high IV inflates premiums, low IV reduces them.
Adjustments: Rolling options, converting spreads to condors, hedging with futures.
10. Conclusion
Options trading strategies are powerful tools. They allow traders to make money in bullish, bearish, sideways, or volatile markets – but only if used with discipline. A successful trader doesn’t just guess direction; they analyze market conditions, volatility, risk tolerance, and then select the appropriate strategy.
The beauty of options lies in flexibility: you can limit risk, enhance returns, or even profit from time and volatility itself. But the danger lies in misuse – options should be treated as structured financial instruments, not lottery tickets.

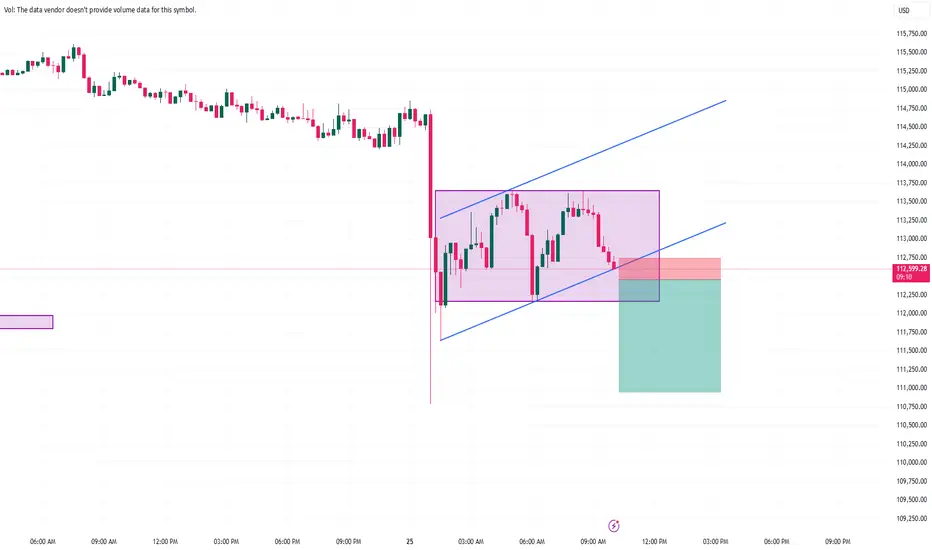
Trade Idea: BTCUSD – Rising Channel Breakdown Setup
🔍 Market Context
BTCUSD recently formed a rising channel (marked in purple) after a sharp sell-off. This is typically a corrective structure within a larger downtrend. Price action shows multiple rejections near the upper boundary of the channel, suggesting weakening bullish momentum.
Currently, the price is testing the lower channel support. A break below this level would confirm bearish continuation.
📊 Trade Setup
Type: Short (Sell)
Entry: Breakdown of channel support (~112,750 region)
Stop Loss: Above the recent minor swing high (~113,050)
Target: 111,360 (first target), extended towards 110,950 (second target)
Risk/Reward Ratio: ~5.28 (favorable)
✅ Why This Setup Looks Attractive (Pros)
Clear Structure: Price is respecting the channel, and breakdown setups often trigger sharp moves.
Strong Risk/Reward: Small stop-loss compared to potential downside.
Trend Continuation: Aligns with the broader bearish pressure seen earlier.
Volume Confirmation (if checked): Breakdowns with increasing volume add conviction.
⚠️ Risks To Consider (Cons)
False Breakouts: BTC is known for liquidity hunts; price may dip below the channel only to bounce back.
Support Zones Below: Strong demand around 111,000–110,750 may cause choppiness.
Macro Factors: News or sudden volatility can invalidate technical setups.
Risk Management Needed: Without discipline, tight stops can get hit quickly in crypto.
📌 Trade Management
Stop Loss Discipline: Never move stop away from risk.
Trailing Stop: Can be applied once price moves in favor by 1R to lock partial profits.
Scaling Out: Take partial profits at 111,360 and hold remainder to 110,950.
📈 Probability Outlook
Bearish Continuation Probability: ~65%
False Breakout / Pullback Probability: ~25%
Channel Hold & Reversal Probability: ~10%
BTC Buy Zones 4HR + Daily ConfluencesBitcoin continues to respect higher–timeframe bullish structure, and the 4H chart is currently showing two key buy-side zones where price could react strongly. Both areas align with Daily Order Blocks + Fair Value Gaps, adding Multi confluences to the setup.
---
📍 First Buy Area: $109,000 – $111,000
Located within a 4H bullish OB.
FVG imbalance suggests price may rebalance before moving higher.
Best used for scaling in with partial positions.
---
📍 Second Buy Area: $108,000 – $110,000
Stronger and more reliable zone, as it aligns more closely with the Daily OB + FVG cluster.
Provides the best risk–reward opportunity if tapped occurs.
Ideal situation for more aggressive accumulation if confirmation appears.
---
⚡ Execution Plan
Always wait for 15m confirmations (BOS, liquidity sweep, or rejection wick) before entering.
Manage risk carefully — BTC volatility around these levels can be high.
The second zone ($108K–$110K) remains the higher-probability entry for swing traders.
---
📊 This setup combines Daily confluence with swing precision — a structure-first approach that keeps risk defined while targeting continuation of the broader bullish trend.

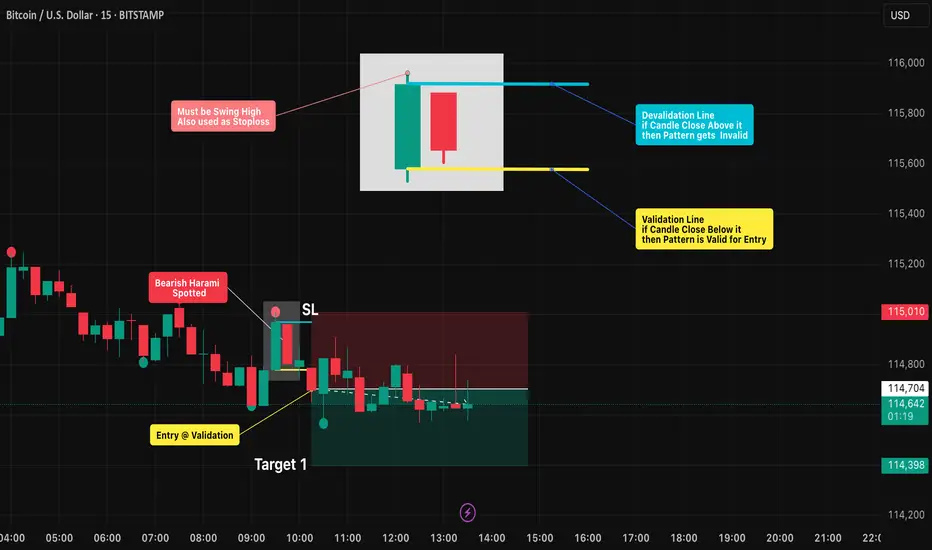
Bearish Harami Pattern: Spotting Reversals with Discipline🔻Bearish Harami Pattern: Spotting Reversals with Discipline
Intro / Overview
The Bearish Harami is a candlestick reversal pattern that often appears at the end of an uptrend.
It signals a possible shift where bullish momentum weakens and sellers begin to step in.
The first candle’s high must be a swing high , and this level can also be used as a stop-loss reference.
To trade it effectively, spotting the formation is not enough — strict validation and invalidation rules are key to avoid false signals.
✨ Concept
A Bearish Harami is a two-candle pattern:
- First candle (Green🟢): A strong bullish candle showing buyer dominance.(Swing high)
- Second candle (Red🔴): A smaller bearish candle whose body is fully inside the prior green candle’s body (wicks ideally inside).
This forms the “harami” structure, where the red candle looks like it is “inside the green candle,” suggesting a pause in bullish pressure and potential reversal.
📖 How to Use
1️⃣ Identify the pattern: Look for a large green candle followed by a smaller red candle contained within it.
2️⃣ Validation Point: The setup is validated if price closes below the open of the green candle within the next few candles.
3️⃣ Invalidation Point: The setup is invalidated if price closes above the close of the green candle before validation occurs.
4️⃣ Stop-Loss & Targets:
- Stop-loss (SL): Place at or just above the swing high (first green candle high).
- Target (TP): 1x, 2x, or more times the distance between entry and stoploss.
5️⃣ Enhance Reliability: Combine with resistance levels, trendlines, moving averages, or other candlestick signals to filter out weak setups.
📊 Chart Explanation – Step by Step
✔ The Bearish Harami pattern was spotted after a clear uptrend.
✔ The following candle closed below the green candle’s open → Validation confirmed ✅.
✔ A short entry was taken on the same candle.
✔ A Bearish Harami pattern has also been drawn and highlighted on the chart.
🔍 Observation
- If Target 1 is achieved → book 2 lots , and trail the remaining position with a stop-loss.
- Harami is only a potential reversal → confirmation is necessary.
- Breakdown below the green candle’s open = sellers in control 🔻.
- Breakout above the green candle’s close = setup failure ❌.
- Patience is key — wait for confirmation before entering.
📌 Why It Matters?
The Bearish Harami helps traders by:
- Reducing false reversal trades with strict rules.
- Providing clear entry/exit levels with discipline.
- Enforcing risk management via pre-defined SL & TP.
✅ Conclusion
The Bearish Harami becomes powerful when traded with discipline.
By marking the open and close of the green candle, traders can clearly separate a valid short trade from a failed setup.
With a stop-loss at the swing high and take-profits at 1x, 2x, or more, while trailing further lots, the Harami offers a structured, rule-based strategy.
⚠️ Always remember: the pattern shows possibility → price confirmation makes it probability .
⚠️ Disclaimer
For educational purposes only · Not SEBI registered · Not a buy/sell recommendation · No investment advice — purely a learning resource
BTCUSD Key Zones: Supply/Demand Analysis & Breakout ScenariosThis chart highlights critical supply and demand zones for BTCUSD, mapping out possible bullish and bearish scenarios. If the price breaks above the supply zone, a sharp move towards 120,000+ is possible. Conversely, if the demand zone fails, BTCUSD could retest 108,000 or lower. Monitor these areas for effective risk management and potential intraday trades. Let me know your views on breakout or reversal setups in the comments!

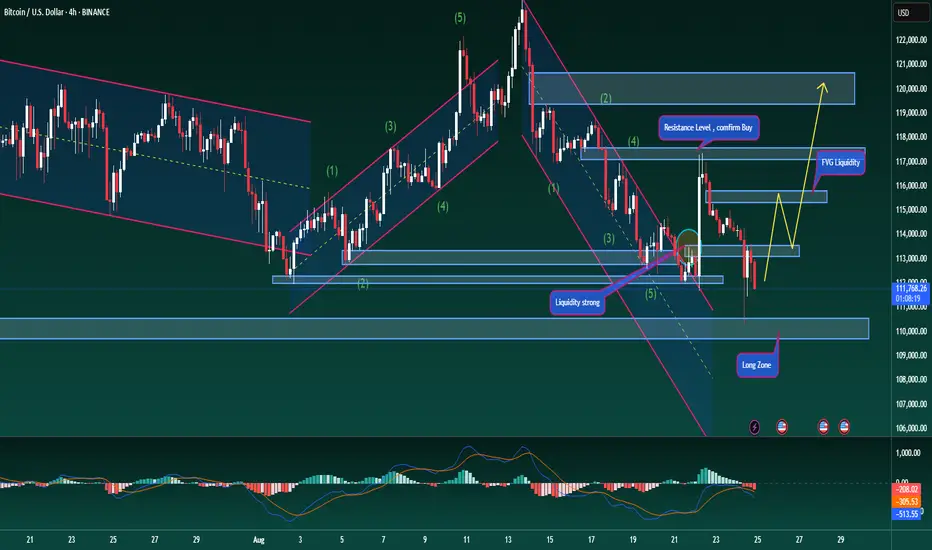
Bitcoin – Medium-Term OutlookBitcoin – Medium-Term Outlook
Hello traders,
BTC recently made a strong breakout move, reacting precisely at the 117k level as expected. Currently, price is in a corrective phase, clearing the liquidity from last Friday’s bullish candle. The sharp rejection at 117k suggests we need to reassess the medium-term outlook.
The primary scenario remains bullish. The 113.4k zone is a key area to look for long entries, as buyers dominated this level earlier and liquidity from short traders still sits here. From a psychological perspective, we could see shorts exiting the market, fuelling a rally towards 115.7k. A confirmed break above 117k would strengthen the long-term bullish trend, opening the door for further long opportunities.
On the flip side, a reaction lower from 115.7k could present a short entry for the medium term. If support at 111.7k breaks, BTC may extend down to 110k, where strong historical rejections suggest a solid zone for fresh long positions in both medium and long-term outlooks.
This outlook is based on key support/resistance levels and major liquidity zones. Always trade with discipline and manage risk carefully to protect your account.
What’s your view on BTC here? Share your thoughts in the comments so we can trade smarter together.

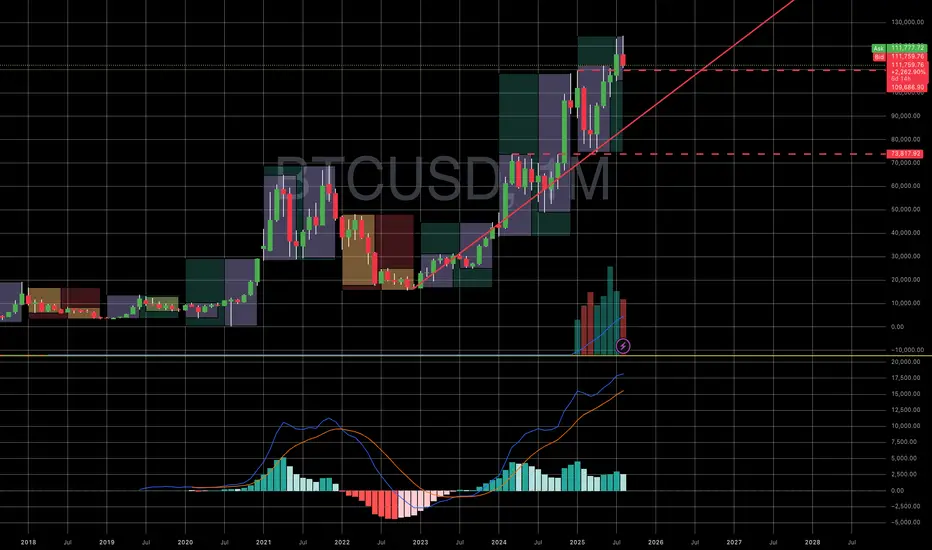
#BITCOIN what next!!!as you can till now chart have worked till now, but now bitcoin can go in time correction or price correction between range (120000-80000)
with having triple divergence on weakly. Interesting time ahead. Upside not favorable

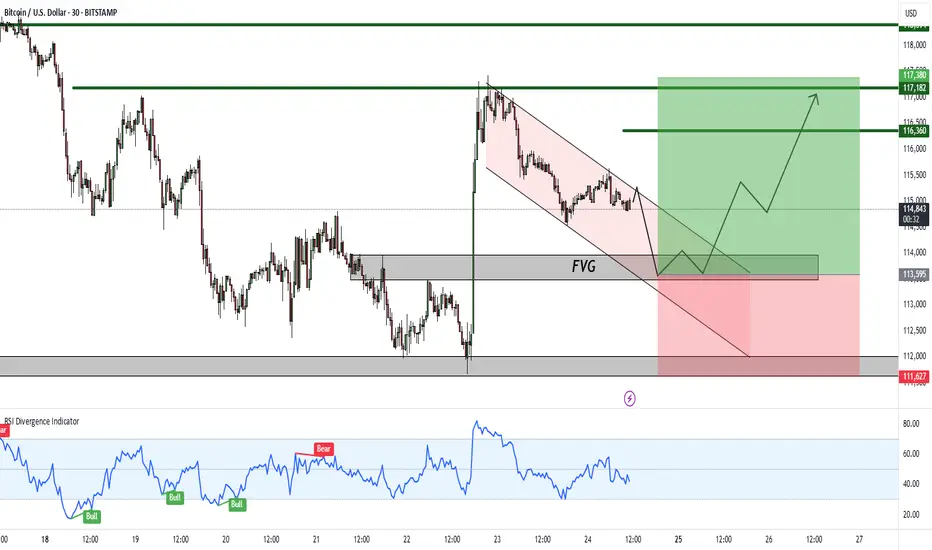
Bitcoin – Bullish Setup Forming After FVG Retest!Hello Traders!
Bitcoin is currently showing signs of forming a bullish setup after rejecting lower levels. The price has created a clean FVG (Fair Value Gap) zone and is moving within a falling channel, suggesting a possible accumulation before the next leg up.
Key Observations:
FVG Support: Price is likely to retest the FVG zone before a strong upward move.
Falling Channel: The structure indicates potential breakout to the upside.
RSI Divergence: Momentum indicators are showing signs of strength, supporting a bullish reversal case.
Targets: The upside targets are marked at 116,360 – 117,380 – 118,394 levels.
Invalidation: A breakdown below 111,627 would negate this bullish setup.
Rahul’s Tip:
Always wait for confirmation around the FVG zone. Entering too early may expose you to false breakouts. Risk management is crucial, especially in volatile assets like Bitcoin.
Disclaimer:
This analysis is for educational purposes only and not financial advice. Please do your own research before making any trading decisions.
BTCUSD 4 Hours View Support Zones & Turning Points
** ~$115,000 Pivot Zone**
A consolidation area around $115,000 (± $600) acts as a short-term support base and momentum gauge.
~$117,430 (4H MA50)
The 50-period moving average on the 4H chart sits near $117,430, serving as a dynamic support level.
Previous ATH zones ($110K–$112K)
These levels have historically flipped as support after bullish retreats.
Resistance & Overhead Supply
$120,000 Psychological Barrier
A major round-number resistance that needs to be overcome for sustained bullish momentum.
$121K–$123K (Current and Previous ATH Range)
These levels remain formidable obstacles, marking the highest recent peaks.
$124,500 Zone
The recent all-time high, now under challenging supply and selling pressure.
Elliott Wave & Retracement Support
~$118,657 (38.2% Fibonacci retracement)
This level aligns with the corrective wave (Wave IV) in the Elliott Wave count, suggesting a solid bounce zone for potential Wave V continuation.

BUY SETUP The market is showing signs of strength as demand builds up after recent consolidation.
Price action reflects buyers defending key zones, with rejection wicks and momentum candles confirming interest.
This structure suggests that bullish sentiment is increasing, with the potential for a continuation move to the upside.
A long bias is favored as long as the current market structure holds, supported by higher lows and sustained momentum.
Monitoring follow-through strength, volume confirmation, and the ability of buyers to push through near-term barriers.

BTC/USDThe BTC/USD trade with an entry price of 114,895, stop-loss at 115,259, and exit price at 114,176 is a short-term sell trade setup focused on capturing a downward move in Bitcoin. The potential profit from this trade is around 719 points, while the risk is limited to roughly 364 points, offering a favorable risk-to-reward ratio of about 1:2.
The entry price at 114,895 suggests the trade was initiated near a resistance zone where price showed weakness or bearish rejection. Traders often look for confirmation signals such as candlestick patterns, RSI overbought levels, or MACD crossovers before entering a sell position at such levels.
The stop-loss at 115,259 is placed just above resistance, ensuring that if the market moves upward unexpectedly, losses are capped.
The exit price at 114,176 serves as the take-profit target, positioned near a support level to secure gains before any reversal.
This setup reflects disciplined BTC/USD trading by combining technical signals, strict risk control, and a well-defined profit objective.

BTCUSD – Short Opportunity Building 30m Chart1. Price rejected from the supply zone near 115,700–115,800, showing resistance.
2. Current structure has shifted bearish with lower highs after rejection.
3. Key intraday support stands at 115,100–115,000; a sustained break below could accelerate downside.
4. Next demand levels to watch: 114,280 and 114,116, aligning with liquidity zones.
📉 Plan:
Short entries remain valid below 115,300.
First target: 114,280
Extended target: 114,116
Invalidation above 115,800.
Recommendation: Monitor for clean bearish continuation; keep risk tight due to BTC volatility.

sell The market is displaying weakness as supply pressure dominates after repeated rejections.
Price action reflects sellers defending resistance areas, with exhaustion signs and momentum shifts pointing lower.
This structure suggests that bearish sentiment is gaining traction, with the potential for a continuation move to the downside.
A short bias is favored as long as the current market structure remains intact, supported by lower highs and persistent selling momentum.
Monitoring follow-through strength, volume confirmation, and the ability of sellers to break through near-term supports.

sell Market is showing weakness after repeated resistance tests.
Sellers are stepping in with momentum, signaling potential continuation to the downside.
The setup favors a short position as long as the current structure remains intact.
Watching for sustained selling pressure and follow-through toward lower levels.

"Bitcoin Eyes $100K Re-Entry: Retest, Support Zone, Then Push ?Chart Analysis
1. Price Structure & Trendlines
The chart displays a former upward trendline that has been broken, leading to a corrective pullback.
Following that, price is perched within a “retest zone” (the red-shaded rectangle), which aligns with both historical horizontal resistance—now turning into support—and an area of previous consolidation. This is a classic setup: price often retests key breakout levels before resuming its move.
2. Support Levels
The main support is clearly drawn around the $100K zone, highlighted by a grey bar below the retest zone. This is a psychological and structural area to watch for potential strong buying.
Immediate support appears near $110K–$112K, as noted by the lower edge of the red retest area—this zone has shown to catch corrections before in technical analysis and news reports
AInvest
Mudrex
Barron's
.
3. Resistance & Upside Targets
If the retest holds, the chart charts a potential bounce toward the upper rising trendline and beyond, potentially aiming for the $126K–$130K region, as marked by Fibonacci retracement levels.
This aligns with several external forecasts suggesting resistance or target zones in that range
AInvest
Mudrex
Barron's
.
4. Potential Price Path & Scenarios (Denoted by Red Arrows)
Bearish Scenario: Price may dip down into the retest zone, test support, and—if the breakdown occurs—continue lower toward $100K—a key area of interest.
Bullish Scenario: The support holds, leading to a V-shaped recovery that propels price back above $115K, potentially triggering a rally toward $122K–$130K.
Summary Table
Key Zone / Level Significance & Note
$110K–$112K Critical near-term support; breakdown risks move toward $100K
AInvest
Mudrex
Retest Zone (~$114K–$115K) Area combining horizontal support and trendline; serves as pivot for next move
Mudrex
AInvest
$120K–$123K Major resistance where a breakout could fuel continuation toward $127K–$130K
Mudrex
Barron's
Broader Context & Market Sentiment
Bitcoin is currently consolidating after setting new highs near $124K
MarketWatch
The Economic Times
Barron's
Cointribune
.
Analysts observe that sustaining above the $110K–$112K band is essential to the bullish case; falling below it could invite deeper downside
Barron's
Cointribune
AInvest
.
Conversely, a decisive move above $120K–$123K could validate continuation toward $127K–$130K, and even higher—some forecasts extend to $135K and beyond
Mudrex
Indiatimes
Barron's
CoinCodex
.
Final Thoughts
Your chart beautifully illustrates the classic “retest after breakout” dynamic:
Hold above the retest zone? Look for a rebound toward $120K+, with the potential for a full bullish revival aiming for $130K.
Break below $110K–$112K? Watch for a possible move toward $100K—a critical support level.
Stay alert to macro catalysts too—like Federal Reserve interest rate signals, institutional inflows (ETFs), and regulatory developments—which could steer the next leg substantially

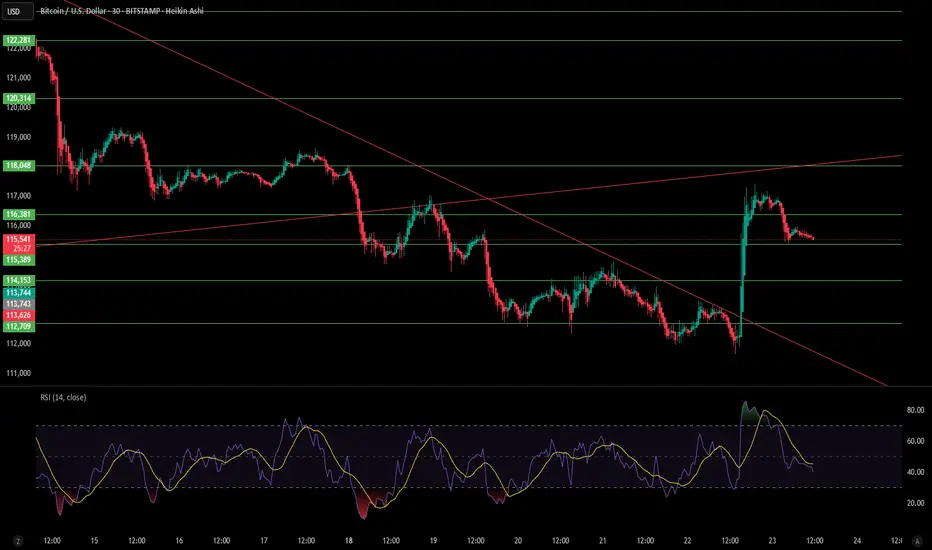
Bitcoin (BTC/USD) – 4H Chart AnalysisBTC is currently trading at $115,669 after a recovery bounce from the $112,700 support zone. Price recently broke above the descending trendline (red), signaling a potential shift in short-term momentum.
Key levels to watch:
🔴 Immediate Resistance: $116,000 – $116,380
🟢 Supports: $115,389 / $114,153 / $112,709
📈 Higher Resistance Zones: $118,048 / $120,314 / $123,273
The RSI (14) is currently at 55.96, slightly above neutral, suggesting BTC has room to move either direction without being overbought or oversold.
📌 Bullish Scenario: A break above $116,380 could open the way to retest $118,000 and possibly $120,000.
📌 Bearish Scenario: Rejection from current resistance may lead to a pullback toward $114,000 – $113,700, with deeper downside risk if $112,700 fails.
⚖️ Outlook: BTC is trying to regain bullish momentum after a recent downtrend. A decisive move above $116K will be crucial for further upside.