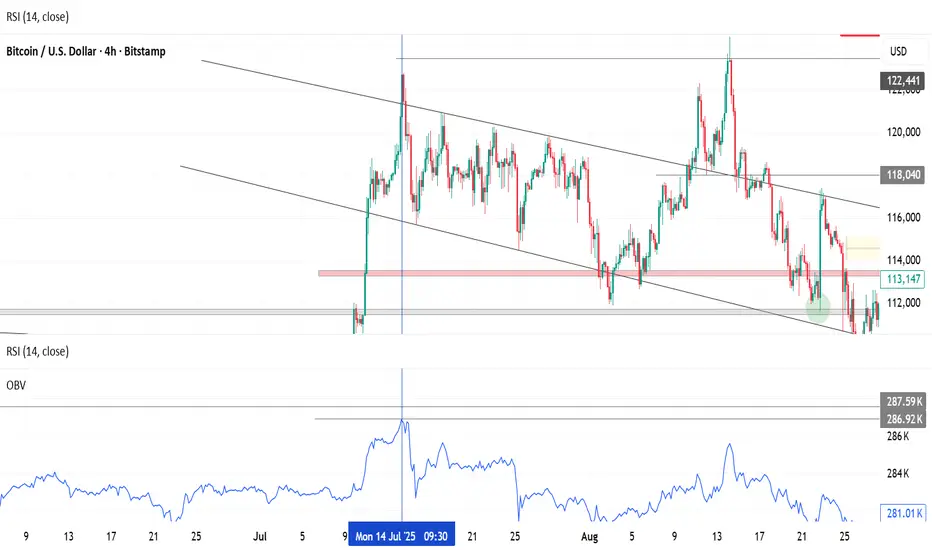
BTCUSD CONTINUATION UPDATE ( 4H )As expected from our previous setup, BTCUSD respected the supply zone near 116,000–117,000, perfectly reacting from the premium range of our last impulse leg. The rejection confirmed a clean Market Structure Shift (MSS) around 112,400–113,000, shifting control back to the sellers.
After the MSS, price retraced back to fill the imbalance and mitigate the 4H bearish order block, then continued its descent toward our partial take-profit zone around 110,800–111,000, which has already been reached and delivered solid profits.
Currently, BTC is consolidating just above the discount range (107,800–107,300), aligning with a small 4H demand zone and the 0.618 fib retracement of the prior impulse. This area is crucial — it’s where short-term buyers may attempt a bounce, but our overall structure still leans bearish until we reclaim 113,200 with a strong 4H close.
Below lies uncollected liquidity and extended targets at:
0.786 Fib: 105,850
1.0 Projection: 103,100
1.618 Expansion: 95,100
Our short entries from the 115k region are currently floating over +1,400 USD per lot, showing strong momentum in line with the macro bearish swing.
🎯 Plan Moving Forward:
Maintain partials secured around 110,800.
Trail the remainder below 110,500 structure to protect profits.
Continue targeting the deeper liquidity zones (103k–105k) unless market structure flips bullish.
❌ Invalidation:
A clean 4H close above 113,200 will signal potential shift back to bullish order flow — in that case, we’ll monitor for new FVGs or OBs to plan re-entry.
Trade ideas

BTC HOURLY SUPPORT/RESISTANCE FOR THE DAY ONLYThere is plot of two GANN FAN.
I marked here support and resistance in red and green color you can follow if interested this is my analysis on the basis of chart .
here a table is drawn in which cordinates of fans are mentioned so that you can plot it easily on your chart.
Note:- If support get broken you can follow red trend line for support and reversal.the chart is for INTRADAY. It may not work for next day keep it in mind.
this is not buy/sell call.

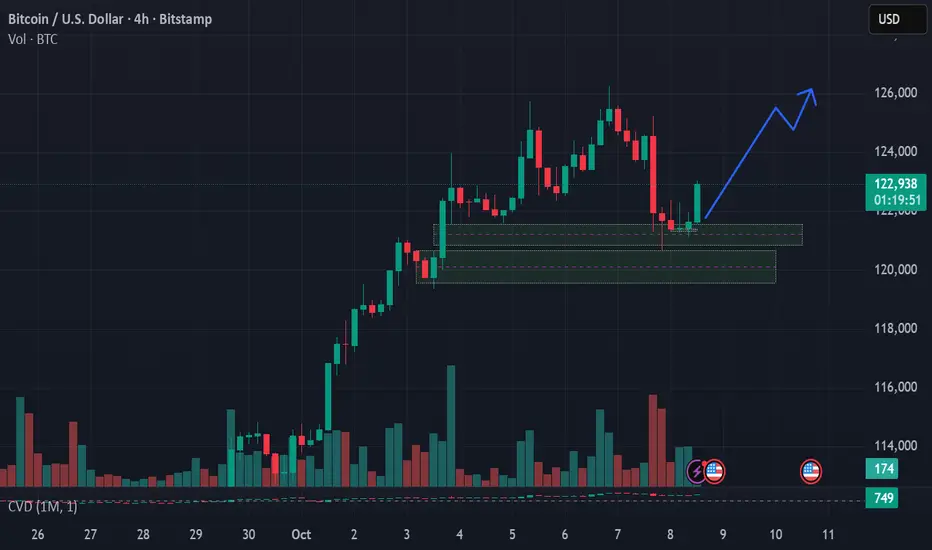
simple structureBitcoin showing bullish strength — price holding above support with increasing volume and RSI breakout. Targeting next resistance zone for continued upside momentum. 💎
BTC Squeezing Like Hell!BITSTAMP:BTCUSD Bitcoin monthly chart has been squeezing like hell. The Bollinger Band Width is currently at 90.66.
Historically, whenever the BBWidth has fallen below 100 (as in 2016, 2020, and 2023), it has tended to resolve on the upside. Since the prices are still on the upper band, we believe this time will be no different.
With 2 weeks more to go before the monthly candle establishes, any closure above $100,000 must not instill any downside fear.
At 90.66, the BBWidth is at the lowest in history, and, theoretically, a big move on either side is in the offing.

Part 1 Ride The Big Moves What is Option Trading?
Option trading is a type of derivatives trading where the value of the contract is based on an underlying asset, such as a stock, index, or commodity. An option gives the trader the right, but not the obligation, to buy or sell the underlying asset at a fixed price (called the strike price) before or on a specific date (called the expiry date). There are two main types of options — Call Options and Put Options.
A Call Option gives the right to buy the asset.
A Put Option gives the right to sell the asset.
Traders use options for hedging risks, speculating on price movements, or earning income through premiums.

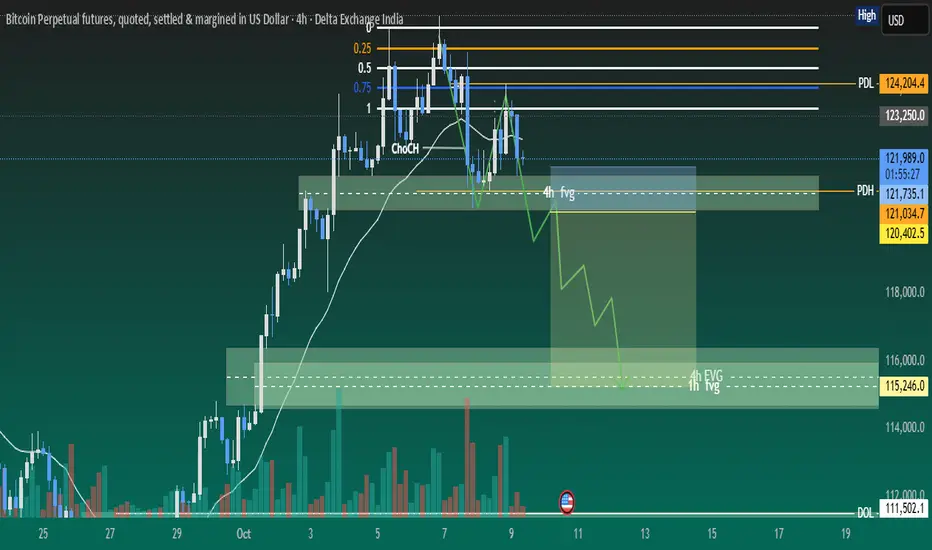
BTC is developing ~4R down side tradeBTC has done MSS on 4h time frame and showing rejection at 4H FVG after displacement. We can see a good downside trade once below FVG is mitigated and changed to iFVG. We need to wait for price getting into right zones.
1. Currently price is moving inside 4H FVG after displacement and showing rejection as well.
2. Price should break below FVG and retest.
3. There are several SIBIs which may be target for it and further buy side reversal trade.
4. RSI has already shown bearish divergence. Which support coming down move.
5. Most probably price will take liquidity of FVG and create MSS/CISD/TS/iFVG in LTF.
6. Price should show rejection/reversal in LTF (5m,1m) at FVG zone.
7. Take the trade only once clear any of the entry model i.e. turtle soup. iFVG break, CDS or MSS happens on LTF
All these combinations are signalling a high probability and ~4R trade scenario.
Note – if you liked this analysis, please boost the idea so that other can also get benefit of it. Also follow me for notification for incoming ideas.
Also Feel free to comment if you have any input to share.
Disclaimer – This analysis is just for education purpose not any trading suggestion. Please take the trade at your own risk and with the discussion with your financial advisor.
BTC SELLBTC SELL ,
I was already watching price action for a selling. Now that I've found a pattern, I'll trade from here like this

BTCUSD - BITCOIN's Measured MoveCMP: 121000
TF: Daily
I don't trade this instrument. I am publishing this from the technical pattern perspective.
The rounding bottom target has been achieved 100% target at 122000 and since then the price is getting rejected at that level (almost three times now)..
Are we going to reject from here or the next round of buying to push the price towards the next target zone of 140000 measured move range of 2025 (Orange)
We could see an Ending diagonal formation at the top. Lets see how this plays out..
Disclaimer: I am not a SEBI registered Analyst and this is not a trading advise. Views are personal and for educational purpose only. Please consult your Financial Advisor for any investment decisions. Please consider my views only to get a different perspective (FOR or AGAINST your views). Please don't trade FNO based on my views. If you like my analysis and learnt something from it, please give a BOOST. Feel free to express your thoughts and questions in the comments section.

BTC "Saturday Bull Fizzle Complete (due to low volume)"On weekends (especially Saturday), Bitcoin markets typically see lower trading volume because institutional and large traders are less active. There was a bullish attempt (a move upward in price) visible near the “Saturday” area.
However, since the volume was weak, the move failed to sustain, and prices pulled back shortly after.
Term “Fizzle” means:
The bullish momentum started strong but quickly lost strength, resulting in a failed breakout or continuation.
Technical takeaway:
A rally on low volume is often a false move — without sufficient participation, it cannot push through resistance or create follow-through.
📊 Market Implication
This suggests:
The Friday bullish candle tried to extend into Saturday.
But due to thin liquidity, the move couldn’t attract further buying.
Result: short-term reversal or consolidation, confirming that weekend rallies aren’t reliable without volume confirmation.

BTC TODAY'S HIGH MAY NOT BE BROKEN FOR THE DAY This chart is 15 minues,there is resistance marked in red horizontal line will not be tested for the day and as gann fann is ploted will be followed by BTC.i
Cross point may be reacted and GREEN ASCENDING channel will work as support and resistance and YELLOW LINE as well.
this is not my buy or sell call.

Consumption Trends in the Indian Trading Market1. Introduction
Consumption trends refer to the patterns and behaviors exhibited by consumers in terms of purchasing goods and services over time. In India, with a population exceeding 1.4 billion, consumption plays a pivotal role in driving economic growth. Retail, e-commerce, FMCG (Fast-Moving Consumer Goods), luxury goods, and digital services are some of the major sectors influenced by consumer spending patterns.
In recent years, consumption trends in India have shifted due to urbanization, rising disposable incomes, digital penetration, and changing lifestyles. Analyzing these trends provides valuable insights for traders and businesses to align their strategies with market demands.
2. Factors Driving Consumption Trends
Several macro and microeconomic factors influence consumption in India:
2.1 Rising Disposable Income
India’s growing middle class has more disposable income than ever before. With steady economic growth and higher employment rates, consumers are spending more on discretionary items like electronics, fashion, entertainment, and travel.
2.2 Urbanization
Rapid urbanization has created a surge in modern retail consumption. Tier-1 and Tier-2 cities have witnessed increased demand for branded products, premium services, and online retail platforms.
2.3 Digital Transformation
Digital technology has reshaped consumer behavior in India. E-commerce platforms such as Amazon, Flipkart, and Myntra have transformed the way people shop. Digital payments, mobile apps, and online promotions have contributed to convenience and impulse buying.
2.4 Lifestyle Changes
The younger generation, especially millennials and Gen Z, prioritize experiences over material goods. Their consumption patterns lean towards travel, wellness, fitness, and technology-driven products.
2.5 Government Policies
Government initiatives like Digital India, Make in India, and financial inclusion programs have increased accessibility to products and services across urban and rural regions, boosting overall consumption.
3. Consumption Patterns by Sector
3.1 FMCG (Fast-Moving Consumer Goods)
FMCG remains a cornerstone of Indian consumption. Staples like food, beverages, personal care products, and household goods dominate spending. Recent trends show a shift toward organic, health-oriented, and premium products.
Rising Health Awareness: Consumers prefer products with natural ingredients and low sugar/fat content.
E-commerce Impact: Online grocery shopping has surged, with platforms like BigBasket and Grofers leading the way.
3.2 E-commerce and Digital Consumption
E-commerce has revolutionized the Indian market, making products accessible beyond urban areas.
Growth of Mobile Commerce: Mobile apps drive more than 70% of e-commerce transactions.
Discount Culture: Festive sales and heavy discounts influence consumer behavior, leading to higher transaction volumes.
Niche Segments: Fashion, electronics, beauty products, and digital content subscriptions are seeing high online demand.
3.3 Luxury and Lifestyle Products
Luxury goods consumption has grown steadily among urban Indians, reflecting aspirations and status symbols.
Premium Brands: Demand for high-end automobiles, watches, and fashion brands is rising.
Experiential Consumption: People prefer experiences like fine dining, vacations, and wellness retreats over material possessions.
3.4 Technology and Electronics
Digital adoption drives significant consumption in electronics, including smartphones, laptops, and smart home devices.
Affordability: Competitive pricing of smartphones and appliances has widened consumer reach.
Integration with Lifestyle: Smart devices now complement entertainment, work, and fitness trends.
3.5 Rural Consumption
Rural India represents a massive consumption base, accounting for nearly half of total consumer spending.
Staple Goods: Food, FMCG, and agricultural products dominate.
Emerging Demand: Appliances, motorcycles, mobile phones, and digital services are becoming popular as connectivity improves.
4. Emerging Consumption Trends
4.1 Sustainability and Eco-consciousness
Consumers increasingly prefer sustainable and eco-friendly products. Brands focusing on packaging, renewable resources, and green initiatives gain trust.
4.2 Subscription-Based Models
Subscription services for streaming, meal kits, and curated products are gaining traction. Consumers appreciate convenience and customization.
4.3 Omni-channel Retail
Consumers expect a seamless experience across offline and online channels. Retailers offering click-and-collect, virtual try-ons, and personalized services are benefiting.
4.4 Experiential Spending
Experience-driven consumption, including travel, fitness, and leisure, is surpassing traditional material spending, especially among millennials.
4.5 Influence of Social Media
Social media platforms heavily influence purchasing decisions. Influencer marketing, short video apps, and online reviews have become key drivers of consumption.
5. Impact on Indian Trading Market
5.1 Growth of Retail and E-commerce
The retail sector is witnessing unprecedented growth due to changing consumption trends. Organized retail chains, supermarkets, and online platforms are expanding rapidly.
5.2 Increased Investor Interest
High consumption fuels business revenues, making sectors like FMCG, e-commerce, and technology attractive for investors. Stock performance of companies catering to changing consumer behavior is closely tied to these trends.
5.3 Supply Chain Evolution
Consumption trends are reshaping supply chain strategies. Efficient logistics, warehouse networks, and last-mile delivery are critical to meet demand.
5.4 Dynamic Pricing and Promotions
Companies adopt dynamic pricing and targeted promotions to influence buying patterns, particularly in e-commerce and FMCG sectors.
5.5 Product Innovation
Consumer expectations push companies to innovate continuously, focusing on personalization, convenience, and sustainability.
6. Challenges and Risks
Despite robust growth, consumption trends face challenges:
Economic Uncertainty: Inflation, interest rates, and global economic conditions can impact consumer spending.
Rural Penetration Barriers: Limited infrastructure and financial literacy may restrict rural consumption growth.
Regulatory Hurdles: Taxation and compliance requirements can affect pricing and margins.
Changing Preferences: Rapid shifts in consumer preferences may lead to inventory and investment risks for businesses.
7. Future Outlook
India’s consumption trends indicate a promising future for traders, investors, and companies. Key predictions include:
Rising Digital Consumption: Continued growth in e-commerce and online services.
Premiumization: Increased demand for premium, lifestyle, and health-oriented products.
Rural Market Expansion: Improved infrastructure and digital access will unlock rural consumption potential.
Sustainable Consumption: Brands focusing on eco-friendly products will capture long-term consumer loyalty.
Technology Integration: AI-driven personalization, AR/VR retail experiences, and smart devices will reshape buying patterns.
Overall, India’s consumption-driven market will remain a critical engine of economic growth, innovation, and global trading opportunities. Businesses and investors who anticipate these trends and adapt accordingly are likely to gain a significant competitive advantage.
8. Conclusion
The Indian trading market is evolving rapidly, with consumption trends at its core. From urban tech-savvy buyers to rural emerging consumers, the diversity of preferences demands that traders and companies remain agile. Understanding these trends enables businesses to innovate, investors to strategize, and policymakers to facilitate sustainable growth.
India’s consumption story is one of opportunity, fueled by demographic advantage, technological adoption, and a culture of aspiration. The next decade promises to redefine how goods and services are traded, consumed, and valued across the subcontinent.

Bitcoin Bybit chart analysis October 2Hello
It's a Bitcoin Guide.
If you "follow"
You can receive real-time movement paths and comment notifications on major sections.
If my analysis was helpful,
Please click the booster button at the bottom.
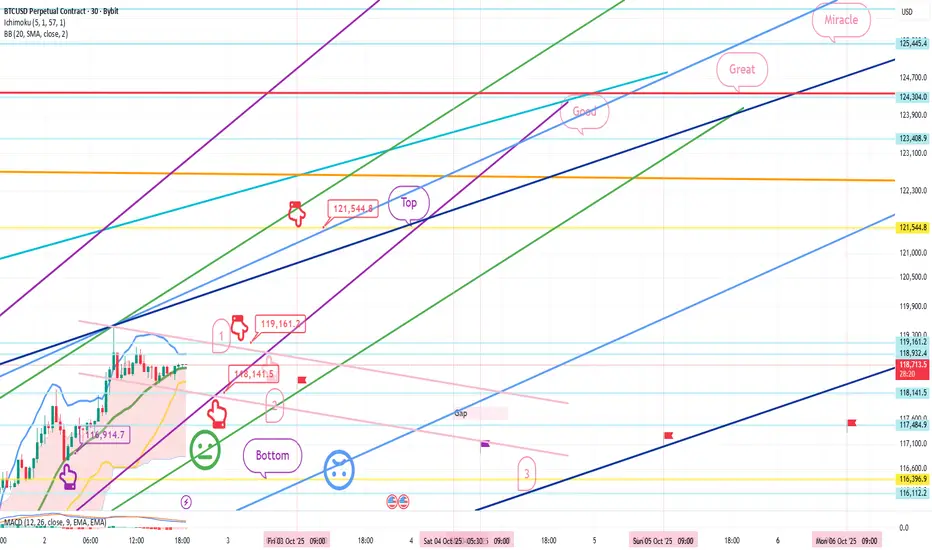
This is a 30-minute Bitcoin chart.
The bottom left shows yesterday's long position re-entry point, $116,914.7, indicated by a purple finger.
We will continue with the trend-following strategy.
*Red finger movement path:
Long position strategy
1. $118,668.2 long position entry point / Stop loss price if the green support line is broken
2. $119,161.2 long position primary target -> Target prices in order from the top to the miracle level
If the strategy is successful, the first section is the long position re-entry point,
and a new high is reached after the great breakout.
The second section is the final long position entry point.
If the green support line is maintained until the second section,
it will become an upward sideways market.
If the light blue support line holds through the weekend and next week,
it could continue to rise as it's a mid-term uptrend line.
Please keep this in mind.
Bottom -> I've left up to three sections.
You can check the prices of the major support and resistance lines above and below the section I've left or by dragging.
Please use my analysis as a reference only.
I hope you operate safely, with a principled trading strategy and stop-loss orders in place.
Have a nice holiday until next Friday.
I'll be back on Friday.
Thank you.
Beautiful 6R BTC trade scenariosBTC is forming both buy and sell side trades as the price is in critical zone. BTC will possibly give us both side good trades. We need to wait for price getting into right zones.
1. Currently price is moving around daily and 4H gradient levels.
2. 125275 level is creating a gradient cluster of both 1d and 4h time frame. Which may give us a good sell side trade if price show clear reversal signals.
3. There is an 1hour iFVG if price takes liquidity of it, most probably it will touch gradient cluster level and good sell scenario may be confirmed.
4. There are several SIBIs which may be target for it and further buy side reversal trade.
5. Buy side reversal trade may be good trade as overall BTC order flow is upside.
6. Most probably price will take liquidity of FVGs and create MSS/CISD/TS/iFVG in LTF.
7. Price should show rejection/reversal in LTF (5m,1m) at FVG zone.
All these combinations are signalling a high probability and 5.5R trade scenario.
Note – if you liked this analysis, please boost the idea so that other can also get benefit of it. Also follow me for notification for incoming ideas.
Also Feel free to comment if you have any input to share.
Disclaimer – This analysis is just for education purpose not any trading suggestion. Please take the trade at your own risk and with the discussion with your financial advisor.

BTCUSD.P1D HH SWEEP and 15m IDM in 1ST OB DOWN TREND this 1D MB is UP TREND but brek to EX OB 1D
is up trend.

Btc is taking support after a slight dipAfter the bitcoin dip, its now taking a support from the 4H demand zone.
Target can be the ATH.
BTC/USD Analysis: Bullish Continuation in FocusBitcoin continues to demonstrate strength following its recent recovery. After periods of consolidation and controlled retracement, the market shows clear signs of accumulation, with buyers maintaining momentum. Each upward leg has been supported by liquidity absorption, reflecting steady confidence in higher valuations.
The current structure suggests that even if retracements occur, they are likely to serve as a foundation for further expansion. Market behavior highlights resilience, with the broader trend still pointing toward bullish continuation. Bitcoin remains positioned for progressive growth, with sentiment and structure both aligning in favor of buyers.

BTC/USD: Structure Shift Confirmed - Bearish CHoCH Break"The previous analysis highlighted the Minor and Major CHoCH levels as key lines in the sand for the recent uptrend. The market has now decisively broken BELOW both levels.
This action confirms a Bearish Change of Character in the market structure (on the chart), signaling a failure of the current bullish order flow.
Minor CHoCH Break : Confirmed the initial weakness and short-term pullback.
Major CHoCH Break : Confirms the structural shift, indicating that the corrective move is likely to be deeper than a simple consolidation.
We should now anticipate a shift in price action: making Lower Highs and Lower Lows . The previous support levels may now act as resistance. Looking for the next key demand zones for a potential bounce, but the immediate bias is now BEARISH ."

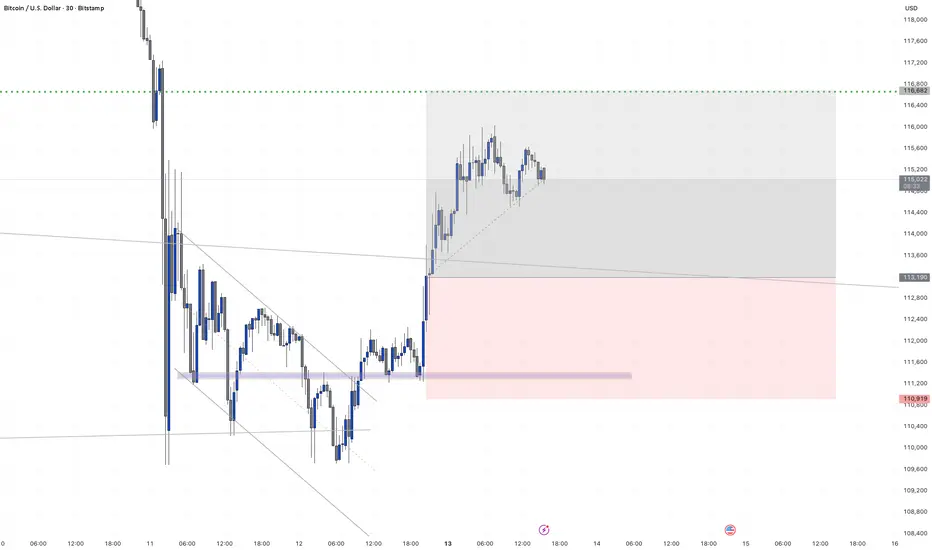
Bitcoin Breaks Out of Descending Channel: Supply Zone to Support
This 4-hour chart of Bitcoin (BTC/USD) highlights a breakout from a descending channel after a prolonged consolidation phase lasting over 16 days (99 bars).
🔻 A clearly defined supply zone (marked in red) acted as a major resistance area, rejecting price multiple times before the breakout. The breakout above this zone indicates a shift in market structure, with bullish momentum gaining strength.
🟡 The breakout was followed by sustained buying pressure, pushing BTC upwards toward the $118,000 region. Price has since pulled back slightly and is now hovering around $115,500 — retesting the previous resistance zone, now potentially acting as support
A strong bullish outlookThe price is currently in a corrective phase, labeled as Wave 4. This consolidation is taking place in the boxed area between roughly $121,000 and $125,000.
A future upward movement is projected as Wave 5. The projection (the cyan line) suggesting the price will break out of the current consolidation and head towards new highs.
A Fibonacci retracement tool is drawn on Wave 3, and the price found support between the 0.382 and 0.5 levels before bouncing. It is currently hovering just below the prior high.
Extension (for Wave 5 Targets): Fibonacci extension levels are used to project potential price targets for the completion of Wave 5. Key targets include:
1.618→$125,449.82
2.618→$127,471.00
3.618→$130,138.25
4.272→$132,429.19
Ichimoku Cloud: The price is trading significantly above the Tenkan-Sen ($116,776.88), Kijun-Sen ($116,776.95), and the Kumo (Cloud). This is a strong bullish signal, indicating a well-established uptrend.
Immediate support appears to be around the $121,000 level.
Deeper support levels are noted at $109,894.21, $99,516.47, and $94,131.21.
The Fibonacci extension levels are acting as the next potential resistance zones.
This chart is decidedly bullish. Anticipates that the current consolidation phase (Wave 4) will resolve to the upside, initiating the final leg (Wave 5) of this impulse move. The projected targets for this next wave lie between $125,500 and $132,500, with the drawn path pointing towards an even higher target around $136,000.

BTC SHORT POSITIONNow that price reached a key level for bears and volume have shown a hand, i expeact price to crash from here targeting the lower side.
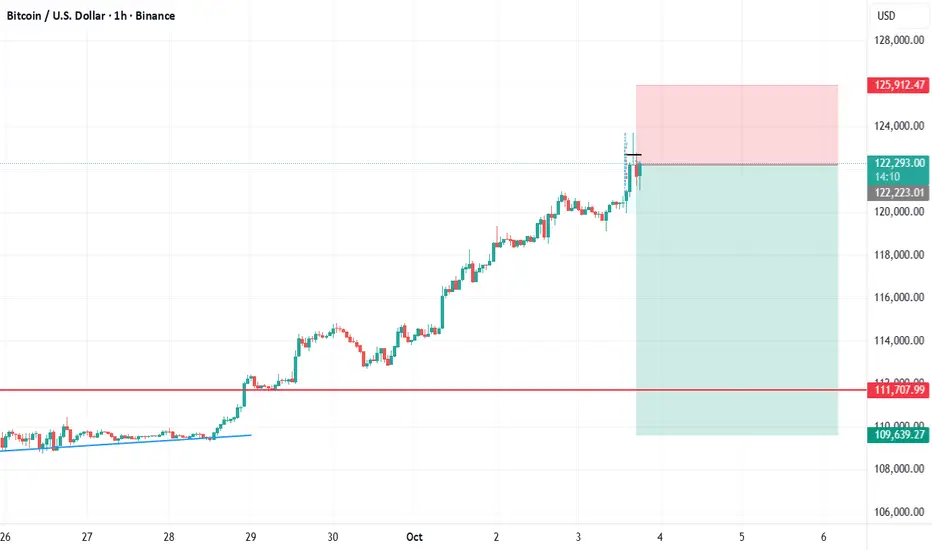
BTCUSD - Ready to retraceLook at the position marked.
Entry, TP and Exit are clearly marked.
Do your analysis before taking a trade!

Bitcoin Market Preparing for Upside MoveBitcoin is currently stabilizing after a sharp corrective phase.The market is showing early signs of demand re-entry near the liquidity base,indicating potential exhaustion of selling pressure.Recent structural reactions hint that buyers are preparing to reclaim control,which could initiate a short-term recovery leg toward the mid-range inefficiency zone.If momentum sustains,Bitcoin may expand higher,confirming a potential buy phase aligned with institutional accumulation signals.Overall,the outlook remains cautiously bullish as long as the market holds above its newly formed demand area.

Crypto Trading Feels Like a Game – But It’s a Psychological War!Hello Traders!
Let’s be honest, trading crypto feels thrilling. Charts move fast, screens flash green and red, and every click feels like a win or loss in a video game.
But the truth is, this isn’t a game. It’s a psychological war , against greed, fear, and your own impulses.
Only those who master their minds survive long enough to win the real rewards.
1. The Illusion of Control
In games, you control the outcome, skill equals victory.
In trading, you control only your actions not the result.
Many traders lose because they think they can “beat” the market like a boss level.
You can’t control outcomes, but you can control decisions. That’s where real skill begins.
2. Emotional Triggers Are the Real Opponents
Greed makes you overtrade.
Fear makes you exit early.
Ego makes you hold losses longer than you should.
Every emotional decision takes you one step further from rational trading. The market punishes impatience, not intelligence.
3. The Endless Loop of Dopamine
Winning a trade releases dopamine, the same chemical that games and gambling use to keep you hooked.
This is why traders often feel “addicted” even when losing.
The key is not avoiding dopamine, but managing it through discipline and routine.
4. How to Turn the Game Into a Profession
Set clear rules and stick to them like a professional athlete follows training.
Don’t chase trades, wait for setups that fit your plan.
Detach emotions from results. Treat losses as tuition fees, not failures.
When you start thinking like a risk manager instead of a gamer, everything changes.
Rahul’s Tip:
The market doesn’t reward excitement, it rewards patience and control.
Every trader is fighting the same battle, but only those who master psychology turn chaos into consistency.
Conclusion:
Crypto trading might look like a game with flashing charts and instant rewards, but in reality, it’s a war within yourself.
Winning here isn’t about beating others, it’s about mastering your reactions when emotions take over.
If this post gave you a reality check, like it, share your thoughts in comments, and follow for more deep trading psychology lessons!