BTCUSD selling view BTCUSD can be seen bearish :-
1.Resistance on the upper level
2.Buyers trap
3.Trading below moving averages
BTCUSD.PI trade ideas

BITCOIN HOURLY CHANNELBITCOIN forming ascending hourly channel and respecting both the resistance and support trend line once it was broken which is clear here in chart.

BITCOIN BTCUSD MAJOR SUPPORT LEVELS- $88-92K
2ND MAJOR SUPPPORT LEVEL- $77-88K
Long Term Target- $180k minimum.

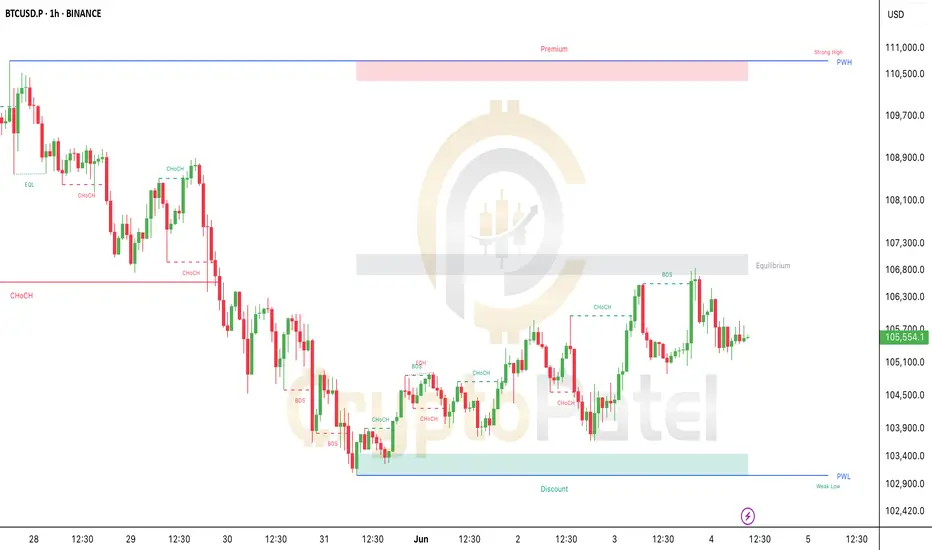
Breakout or Breakdown? BTC at Critical Level!Breakout or Breakdown? BTC at Critical Level!
#Bitcoin is showing early bullish signs after a clean reversal from the discount zone (~$103K).
We saw a CHoCH → BOS → Retest sequence play out perfectly!
Price is now consolidating just below a key supply zone (~$106.8K). This is the Equilibrium Zone – where smart money decides the next move.
🔹 As long as BTC holds above $104.2K, we stay bullish.
🔻 BUT – if we break below $103.4K, expect a deeper pullback, and we could even see Bitcoin drop under $100K for a proper liquidity sweep.
What’s Next?
If we reclaim $106.8K with strength, the next target is the Premium Zone around $110K–$111K, where major liquidity sits!
Watch for breakout or rejection – don’t FOMO. Patience = Profits.
BTC UPDATE-04-juneBTC UPDATE-
Yesterday We expected fall from top of the 106500 around a fall for downward price movement was expected.
Since price has not broken to the downside as we had as a second thought.
Now looks like pattern is forming diagonal. The wave we taken as C is not performing and also broke to the upside, it looks like WXY. so the changed marking looks like this and Y wave ABC move is expected to upside. We have a support zone around. 61.8% from 104908 to 104655 if price provide us upside move from above fall & breaks 38.2% of entire fall from B than we will look to go long from support for the swing of C wave.
Lets see how it plays out.

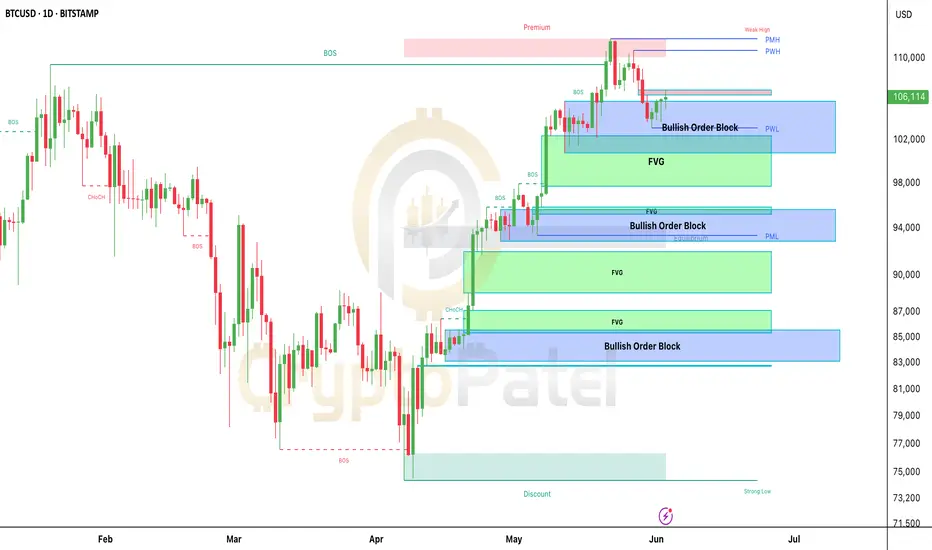
Bitcoin's Next Move: $110K Breakout or $94K Dip? SMC Decides#Bitcoin Daily Chart Analysis – Smart Money Update
As of today, BTC is trading around $105,800 and is showing signs of consolidation after reaching a key resistance zone near $110K.
Let’s break down what’s happening on the chart 👇
Current Market Structure
▶️ BTC has been in a clear uptrend, with multiple Breaks of Structure (BOS) confirming bullish momentum throughout April and May.
▶️ However, price recently entered a premium zone (above $110K), where it faced strong resistance.
▶️ This created a weak high, and we saw a Change of Character (CHoCH) that suggests buyers are slowing down.
Key Levels to Watch
$102K–$106K Zone (Current Area)
▶️ Price is sitting inside a Bullish Order Block + Fair Value Gap (FVG).
▶️ This is a strong support zone.
▶️ If this area holds, we could see a move back up toward $110K or even higher.
$93K–$96K Zone
▶️ Another clean Bullish OB + FVG combo.
▶️ If BTC breaks down from the current zone, this is the next major area where Smart Money might step in to buy.
$83K–$87K Zone
▶️ Deep discount zone, far below equilibrium.
▶️ If price reaches here, it’s a high-probability reversal area.
What Smart Money Might Do
▶️ If BTC holds above $102K–$105K, bulls could regain control and retest the highs near $110K.
▶️ If we break below this zone, expect a pullback toward $94K–$95K or even $87K, where more demand is waiting.
Fair Value Gaps (FVGs)
▶️ Several FVGs are visible, especially between $98K–$103K and $93K–$96K.
▶️ These gaps are areas of imbalance where price is likely to return and fill before the next move.
Summary
▶️ BTC is currently in a decision zone.
▶️ Holding above $102K = bullish continuation likely.
▶️ Breakdown = retracement into deeper bullish zones.
⚠️ As always, wait for confirmation on lower timeframes before entering any trade. Let the market show its hand.
Stay patient. Smart Money doesn’t chase—It waits.
NFA & DYOR
BTC -EW 3JUNE UPDATE||BTC- EW
PATTERN from recent low of 103151 now forming ABC pattern (expanding diagonal),
in which B is a irregular flat correction and is C is
looks like completing at now around 105600. downward price action is expected now, it can also become diagonal pattern in future if low of the pattern holds.
|Lets see what comes out.

BTC Market Sentiment Today (June 3, 2025) – In ShortSentiment: Neutral (Fear & Greed Index at 57)
• Price: ~$104,825 (down 0.38%)
• Volume: ~$43B (healthy activity)
Technical Indicators:
• MACD: Bearish crossover forming (possible short-term dip)
• RSI: 68 (near overbought – caution)
• Pattern: Bullish continuation, but facing resistance at $106K
Key Levels:
• Support: $103K–$104K
• Resistance: $106K
👉 Cautiously bullish, but a short-term pullback is possible.

Bitcoin 1D Technical Commentary & Bias Path - Bitcoin is currently trading at 104,521$
- The previous weekly close for BTC wasn't bullish and the following print or the current candle print does not indicate any bullishness based on the current price behaviour
- The drawings indicate that Bitcoin printed a new ATH, trapped many retail longs, and deviated right below the ATH by publishing a strong bearish print
- The following print after the ATH liquidated many late longs and also showed high sellers interest getting aggressive, now we have 2 possible playouts for BTC
- 1st path shows we can fall and fill the inefficient gap at 97,000$ flip a market structure shift to bullish and then pierce fresh highs
- The 2nd path shows we can simply purge the 1st inefficient gap and pierce through the second one which will eventually cascade a lot of liquidation and then we can finally move higher by bringing in extreme Fear

Bitcoin Crossroads: Will It Fall to $84K or Climb to $130K First🧠 Let’s break it down like a true crypto detective 🕵️♂️👇
📈 Classic Cup ☕ & Handle ☝ Breakout
After chilling below $74K for almost 3 years, #Bitcoin finally made its move and soared to $110K! 🔥
🔙 But then came the pullback… 😬
⚡ Bounced back from strong support at $74K – bulls didn’t give up yet 💪
📊 Current Setup?
👉 Moving inside an ascending channel 🔼
🔝 Resistance at $130K – coincides with breakout potential 🚀
🔻 Support at $84K – channel base ⚓
💡 Technical Signals You Shouldn't Ignore:
✅ Still above 50 & 100 EMA – trend intact 📈
⚠️ RSI at 61 & falling – momentum weakening ⚡
⚠️ Weekly RSI Divergence – clear bearish warning 🚨
🎯 Conclusion:
We’re in an indecisive zone ⚖️ – bullish structure but short-term bearish pullback signs are flashing 🟥
📍 Levels to Watch Closely:
$84K 🔻 | $110K ⚖️ | $130K 🔺
DYOR 🔍 & stay updated – markets move FAST!

Bitcoin to 101.500 support ?Bitcoin continues to trade within a well-defined descending channel, respecting both the upper and lower bounds consistently. Price is currently rejecting the midline of the channel, suggesting bearish continuation. A fresh short position has been marked, with a tight stop above local structure and a projected target at the lower boundary near $101,528, offering a favorable risk-reward ratio. Until price breaks convincingly above the channel, the trend remains bearish.

BTCUSDT looks super bullish in longer turmAs we are in final phase of bull run, after.
Almost hit 112000 BTC has shown some weakness because all because of it was overbought in is daily time frame, however, it is creating inverse head and shoulder in daily time frame, it can come to 92-93000, as we can see at 93000 we have millions of dollars of liquidations and if it comes to 93000 it complete the had been sold the patents and target of a 1,50,000.

BITCOIN RANGESHIFTIf i look thisn chart it is saying that BITCOIN trying toshift range it means there may be trend get changed orange line clearly show you higher high and higher low swing formation which is marked by green arrow. Here you can see a trend line support is in picture which is followed by BITCOIN. Remember it's not my buy/sell call just an information is here.
Follow houly time frame.

BTC/USD Technical OutlookTechnical Analysis Summary:
1. Support & Resistance Zones:
Support Zone: ~$102,600–$103,500
✅ Price recently tested and bounced from this zone, supported by the 200 EMA (blue line).
Resistance Zone: ~$110,500–$112,000
🔼 This is the next major target area for bulls.
Mid-level Supply: ~$106,500–$107,500
⚠️ Price may face short-term resistance here (near the 50 EMA in red).
🔄 Moving Averages:
200 EMA (blue) at $102,648: Acts as strong dynamic support. Price bounce reinforces bullish sentiment.
50 EMA (red) at $106,798: Currently acting as dynamic resistance. A breakout above it would strengthen bullish continuation.
🕯️ Candlestick Behavior:
Multiple rejection wicks from the support zone indicate buyer strength.
Recent candle shows a bullish reaction, potentially forming a reversal pattern.
📈 Price Projection (as per the chart path):
Short-term pullback may lead into the $106,500–$107,500 zone.
If bulls maintain momentum and break above, we can expect a push toward $111K–$112K resistance.
✅ Conclusion:
Bias: Bullish
Trigger: Confirmed bounce from support + price reclaiming 50 EMA
Invalidation: Break below $102,600 with high volume would invalidate the bullish scenario.

BTC/USD Playing Out Perfect - Long on 4 Hour then shortBTC has played out on the previously published chart taking support at fib levels. The rebound looks strong and should go up ~105700, which can be a good place to short. However in case volumes dip, can go back to retest previous support at ~103900, which if breaks is again a perfect opportunity is short. Should long above 104700 only.

BTC : A FAKE CHANNEL BO?
BTC moving in a parallel channel
The channel broken in the yesterday
Now BTC is trying to reenter the channel
Break out from the key level 105000 indicates and FAKE channel BO
Higher timeframe trend is strong bullish. Hence Probability of FAKE BO is high

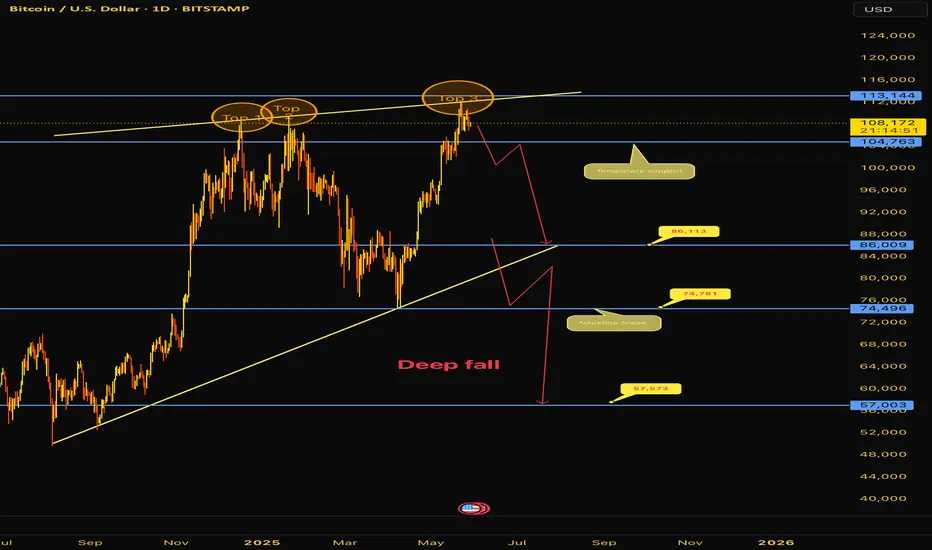
Bitcoin Ready to Collapse? Shift incoming !!Bitcoin is flashing warning signs that the euphoria may be nearing a halt. While bulls have defended every dip for months, this recent structure exposes potential systemic exhaustion and a clear top-heavy formation.
🔶 Triple Top Formation – Major Reversal Pattern
Price has formed three clear rejections near 111k to 113k failing to break this horizontal ceiling despite strong attempts:
• Top 1: Initial euphoric breakout in Q1 2025.
• Top 2: Mid-cycle rejection with lower momentum.
• Top 3: Final spike with a long upper wick, indicating selling pressure.
This isn’t just psychological resistance — this is institutional exit behavior. When a triple top aligns with bearish structure, the probabilities of reversal spike.
⸻
📐 Rising Wedge Breakdown Risk
Zooming into structure, BTC is also caught in a rising wedge, a pattern that typically precedes a sharp trend reversal when the lower trendline fails.
• This wedge began forming since the $57K low in January 2025, and has now reached terminal compression.
• Breakout attempt failed to sustain new highs, now back inside the wedge.
If price breaks down with volume, it confirms distribution at the top.
⸻
🧠 Multi-Layered Breakdown Zones
Here’s the full structure unraveling beneath:
🟡 Immediate Support (Temporary Relief):
• 104,763 is the first demand zone. However, this is weak and already being tested.
🟡 Critical Breakdown Trigger (Trendline + Horizontal Confluence):
• 86,113 aligns with wedge base and horizontal structure. Losing this is not a dip — it’s a structural breach.
🟡 Neckline of the Triple Top:
• 74,496 – this is the last defense. A breakdown here activates the full triple-top bearish target.
⸻
📉 Projected Pathway – Full Breakdown Sequence
If price fails to reclaim 113K, here’s the probable sequence:
1. Failure to hold 104K → Drop to 86K.
2. Weak bounce from 86K followed by breakdown → retest neckline at 74.5K.
3. Neckline breaks → Full triple top target opens towards 57,000–58,000 zone.
🔻 Target: 57,003 – Aligns with historical pivot from Nov 2024 and major liquidity grab.
⸻
💬 Macro Interpretation
While spot price remains above key zones, the underlying structure has flipped bearish:
• Every push higher is met with lower momentum.
• Trendline losing steam, and volume failing to confirm rallies.
• This looks like a top-heavy distribution, not accumulation.
⸻
⚠️ What to Watch Now
• Daily closes below 104K = early sign of pressure.
• Breakdown and daily close below 86K = breakdown from rising wedge.
• Neckline at 74,496 is the trap door. If this gives in, expect acceleration.
⸻
✅ Action Plan
• No fresh longs until BTC closes above 113K with conviction.
• Shorting below 104K with tight stops makes sense for intraday traders.
• Bigger positional shorts can be initiated on breakdown + retest of 86K.
• Full breakdown shorting zone activates below neckline retest.
⸻
📌 Summary:
Triple Top + Rising Wedge + Structural Failures = Recipe for Collapse.
BTC bulls need a miracle above 113K. Otherwise, price is setting up for a high-velocity drop toward 57K zone over the coming weeks.
BITCOIN BAT APEARING In 3 hour chart there is bat pattern formation in bitcoin, as you know it is reversal pattern but it is to be considered like that when it sustained above 106.7K,Otherrwise it may fail. Howere there is downside channel support which is in green and red lines showing as resistance remember it is 3 hour time frame.its not my buy/sell call.

Bitcoin Bybit chart analysis May 27Hello
It's a Bitcoinguide.
If you have a "follower"
You can receive comment notifications on real-time travel routes and major sections.
If my analysis is helpful,
Please would like one booster button at the bottom.
This is the NASDAQ 30-minute chart.
There will be an indicator announcement at 11 o'clock.
The daily chart MACD dead cross is in progress.
*When the red finger moves,
it is a long position strategy.
I simply proceeded with the purple finger short -> red finger long switching
or the red finger long waiting strategy.
Today, if possible, it is advantageous for long positions because the weekly chart low point will not be broken even if you just move sideways without touching the gap section.
When the gap section is deviated, I marked the bottom -> section 2 at the bottom
and applied it to Bitcoin as it is.
This is a Bitcoin 30-minute chart.
At the bottom left is the gap retracement section that was performed on the 26th
The purple finger is the entry point for the long position at $108,233.5
It is connected as is.
*When the red finger moves,
It is a long position strategy.
1. After confirming the touch of the first section of the purple finger at the top
109,519.6 long position entry section / cut-off price when the green support line is broken
2. 111,883.3 long position 1st target -> Good 2nd target
Until the additional daily chart is created at 9 am tomorrow
Because the top section of the resistance line of the Bollinger Band daily chart can be a strong adjustment section
You should be careful.
If you touch after 9 o'clock, there is a possibility of additional increase, and
If the strategy is successful, you can use the 1st section indicated at the top as a long re-entry section after the first liquidation of the Top section.
Today, we will focus on long positions,
but it is important whether the main point touches the upper part of Nasdaq first and then
comes down immediately.
If it comes down immediately without touching the 1st section,
the final long waiting strategy is at 108,652.9 dollars in the 2nd section.
If the green support line breaks away, the stop loss price is the same.
Since the mid-term pattern is broken,
if you somehow manage to hold it within the 2nd section today, it is good for the long position.
If it breaks away, check the Bottom -> 3rd section at the bottom,
Since Bitcoin's new high is updated depending on the movement of Nasdaq this week,
it seems that a decline or continuous rise after the double top may be connected.
Up to this point, I ask that you simply use my analysis for reference and use only.
I hope that you operate safely with the principle of trading and cut-off price.
Thank you.

BITCOIN TIME TO BREAK BITCOIN may break either side why i am expecting because, gradually it is contracting as time passes my view is that it will break upside and will penitrate supply zone,
there is the reason that down side a strong trendline support is placed from where rebounded . lts see what will happen. It is not my buy/sell call. before taking trade we should remember that thereis strong suppiy zone as well.

summary of the current Bitcoin sentiment:💰 Price: Around $109,000 (as of May 26, 2025)
📊 Sentiment Index: Greed (73) – Investors are confident and actively buying
📈 Market Trend: Bullish – BTC recently crossed $110,000, showing strong momentum
🏦 Institutional Inflows: ETFs like BlackRock’s IBIT seeing massive investments
⚖️ Regulation: Positive U.S. moves (pro-crypto laws, bipartisan support) boosting confidence
🌍 Macro Support: Weak U.S. dollar and global easing tensions supporting crypto demand
IF u guyes want to support me just follow me for updates
⚠️ Note: Sentiment is high, but the crypto market remains risky and volatile
Let me know if you want predictions or strategy tips too.
BITCOIN FACING RESISTANCEBITCOIN facing resistance at lower end of previous hourly consolidation zone here i mentioned when it is respecting trend line and consolidation zone as well.
acxept this here showing a tringle which upper side is working as resistance and lower side as support so, i am expecting now that if BITCOIN get unable to penitrate consolidation zone it will revert to lower side of triangle.
blue trendline is workin g as support i day time frame. this chart is hourly.
this is not my buy/sell call.

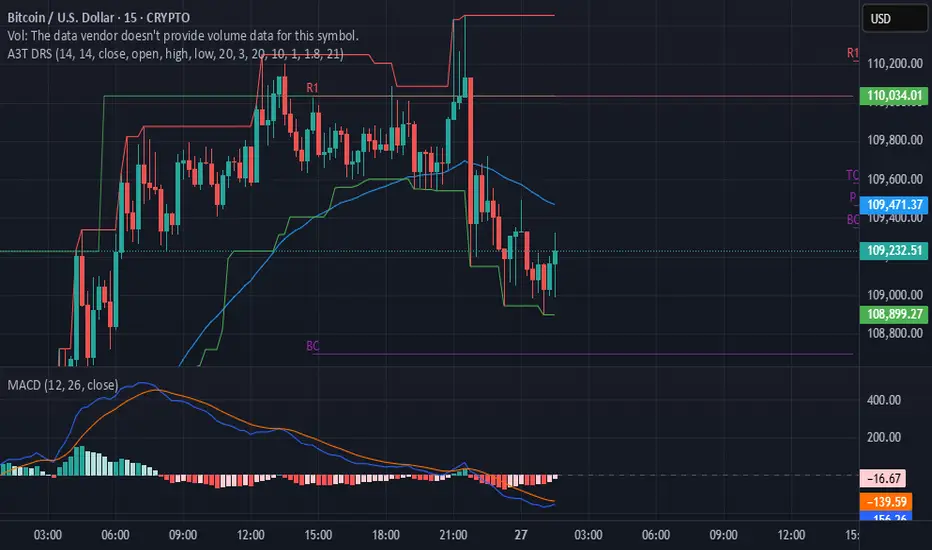
Bitcoin Bybit chart analysis May 23Hello
It's a Bitcoinguide.
If you have a "follower"
You can receive comment notifications on real-time travel routes and major sections.
If my analysis is helpful,
Please would like one booster button at the bottom.
Here is the Bitcoin 30-minute chart.
There will be a Nasdaq indicator announcement at 11 o'clock in a little while.
Yesterday was also a sideways market with no movement,
and the participation rate was low, so I will leave it as a brief analysis.
In the case of Nasdaq, today's daily chart MACD dead cross pressure
so I judged that a vertical rise would be difficult.
I made today's strategy based on the high possibility of a sideways move.
In the upper left corner, from the analysis article on the 22nd,
I moved the 1st section / 111,426.6 dollars as it is with a purple finger.
*Red finger movement path
One-way long position strategy
1. 109,917.6 dollars long position entry section / green support line breakout stop loss price
Since the 4-hour chart MACD dead cross pressure is in progress
Based on the 1+4 pattern,
At least 2 additional 4-hour candles are created
I think there will be a long position wait after 1:30 p.m.
2. Top section 113,701.9 dollars long position 1st target -> Good 2nd target
If it breaks through the orange resistance line at the top
It can be connected to a vertical rise,
So if you were short yesterday or are going to challenge today,
Use it as a stop loss price, but be careful.
If it goes up within the purple support line after 1->2 or after touching 2 times,
It can be a vertical rise or a strong rise.
At the bottom, Bottom -> 3 times -> 106982.3 dollars
I marked the support line.
In case of a strong rise over the weekend,
Good is the Great section hidden picture search.
Up to this point, I ask that you simply use my analysis for reference and use,
and I hope that you operate safely with principle trading and stop loss prices.
Thank you for your hard work this week.
Thank you.
