BTC analysis for next hours 🔍 Key Observations:
1. MACD Indicator (Bottom Panel):
✅ Bearish bias: The MACD line is still below the Signal line, indicating bearish momentum.
🔄 However, the histogram is shrinking on the red side, showing that bearish strength is decreasing, possibly indicating consolidation or potential reversal.
2. Price Action:
🔹 The price is moving sideways after a strong uptrend, forming a consolidation range.
🔹 No clear breakdown yet, but price is showing slight rejection from the resistance zone near 109,800–110,000 (R1).
3. Volume:
Volume appears to be decreasing, which often happens before a breakout or breakdown.
4. Support Levels:
Immediate support lies near 109,423 and 109,239 (Pivot and S1).
A breakdown below these could trigger further downside.
📉 Conclusion:
Currently, mildly bearish but not a strong bearish trend. It looks more like:
A sideways/consolidation phase after an uptrend.
Bears are present but not in full control yet.
📌 What to Watch:
Breakdown below 109,239 = bearish confirmation.
MACD bullish crossover + breakout above 110,000 = bullish reversal.
down targets - 108,500
BTCUSD.PI trade ideas

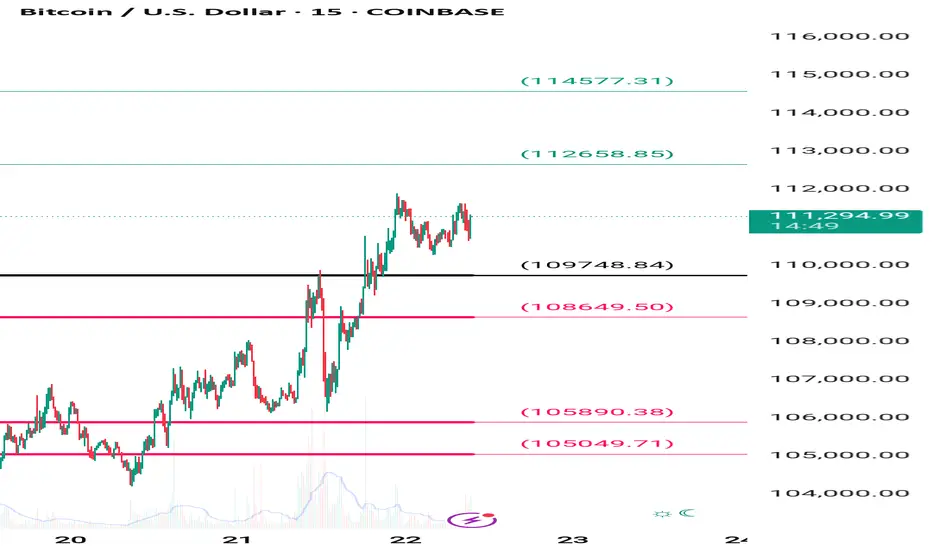
BTC/USD Rebound in Play! | Key Support Holding, Eyes on $112K 📊 BTC/USD Technical Analysis
🗓️ Chart Date: May 25, 2025
🔍 Key Levels:
🔵 Support Zone: $106,800 – $107,300
Notably, price bounced twice in this region, indicating strong buying interest.
This area aligns closely with the 200 EMA (currently at $107,213.51), adding further confluence as dynamic support.
🔴 Resistance Zone: $111,800 – $112,300
Previous highs and consolidation make this a significant area where sellers may re-enter the market.
📈 Indicators:
🔵 EMA 200 (Blue): $107,213.51
Acts as a strong dynamic support; price bounced off it recently.
🔴 EMA 50 (Red): $108,182.91
Price is currently below the 50 EMA, suggesting short-term bearish pressure remains until this level is reclaimed.
🧠 Market Structure & Price Action:
After a sharp drop from the resistance zone, price found solid footing at the support zone.
Recent candles show rejection wicks from the downside, hinting at potential bullish reversal.
A breakout above minor consolidation and 50 EMA could trigger a bullish continuation toward the resistance.
📌 Forecast:
✅ If the price holds above the support zone and breaks above $108,200, we can expect a bullish move toward $112,000.
⚠️ However, a failure to break above the 50 EMA could lead to a retest of the support zone.
🧭 Trade Idea (Not Financial Advice):
📥 Long Bias:
Entry: On confirmed breakout above $108,200
SL: Below $107,000
TP: $111,800 – $112,300
📌 Conclusion:
The chart setup suggests a potential bullish reversal 📈 from a key support zone, supported by EMA 200. Watch for a break above the 50 EMA for momentum confirmation.
🧠 Always confirm with volume and wait for confirmation before entering a position.

Bitcoin {BTC} Analyes Accoding To Price Actionmujhe lagta hai btc abhi range bound hai aur market me itna volume bhi nhi hai mene kuck levels draw ki hai usse apko samajh aa sakta hai agar breack kare toh kaha tak up ya down ja sakta agar apko ye mera analys samj aya toh follow kare

Relief Rally or Trap Before the Next Big Drop? BTC/USD PLAN – MAY 24 | Relief Rally or Trap Before the Next Big Drop?
Bitcoin is showing signs of a technical rebound after rejecting from the 111k region. However, macroeconomic factors and investor sentiment are sending mixed signals that require caution moving forward.
🌍 MACRO OVERVIEW:
The US Dollar remains strong, supported by persistent high Treasury yields — putting pressure on risk assets like crypto.
New tariff tensions between the U.S. and China are shaking markets and tightening global liquidity, which may weigh on speculative assets including Bitcoin.
BTC ETF inflows have declined for the second week in a row, suggesting institutions are becoming more cautious after the recent rally.
📈 TECHNICAL OUTLOOK (H1 Chart):
After bouncing from the key support around 106,800, BTC has initiated a mild retracement toward the 0.5 Fibo at 109,300.
Short-term bullish target lies at the 110,000–111,947 area — a heavy confluence zone of supply, trendline resistance, and previous bull trap zone.
A failure to break 111,900 may lead to a strong correction back to 106,800, and if that fails, a deeper drop toward 102,567 is likely — a high-liquidity demand zone.
📌 TRADE SETUPS:
🔵 SHORT-TERM BUY SCALP:
Entry: 108,300 – 108,500
Stop Loss: Below 107,900
Take Profit: 109,300 – 110,000 – 111,947
Look for bullish reaction if BTC forms a higher low and stays inside the channel.
🔻 MAJOR SELL SCENARIO:
Entry: 111,800 – 112,000
Stop Loss: Above 112,300
Take Profit: 110,000 – 108,500 – 106,800 – 102,500
Favor short setups if price fails at resistance and shows rejection with lower volume or bearish candles.
⚠️ Caution:
Bitcoin is at a critical resistance zone. A breakout may trap late longs before a deep correction. If price breaks and holds above 112k, the bullish trend may resume toward new highs.
🎯 Stick to your zones. Don’t chase price. Use proper risk control.

Bitcoin Dumped form $111800 to $107800 so What next?🚨 Hope you caught the top short at that Bearish OB!
CRYPTOCAP:BTC dropped from $111.5K → $107.8K
Next Key Level: $105K
Hold = Bull Mode On 🟢
Break = Say Hello to < $100K again 😬
Reminder: Don’t gamble your hard-earned money. Trade smart.

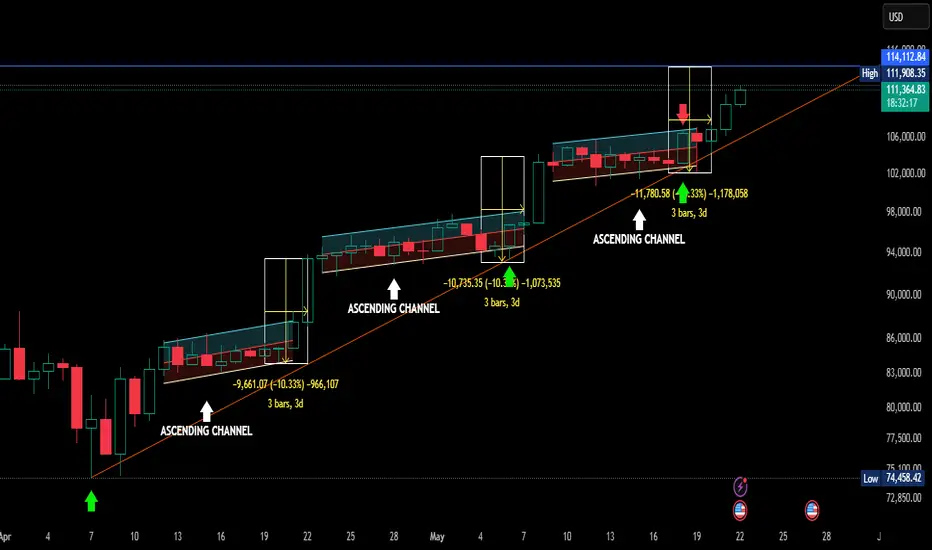
BITCOIN VIEWThere is two channel first is ascending and second horizontal. this is hourly chart here pay attention FIBONACCI level(price) which is shown in right side arrow marking is there as well,But what i want to say is that bitcoin consolidating above previous high must be remembered.this is not my buy/sell call.

BITCOIN VIEWThere is two channel first is ascending and second horizontal. this is hourly chart here pay attention FIBONACCI level(price) which is shown in right side arrow marking is there as well,But what i want to say is that bitcoin consolidating above previous high must be remembered.this is not my buy/sell call.

Bitcoin Bybit chart analysis May 22Hello
It's a Bitcoinguide.
If you have a "follower"
You can receive comment notifications on real-time travel routes and major sections.
If my analysis is helpful,
Please would like one booster button at the bottom.
This is the Nasdaq 30-minute chart.
Where the mid-term pattern is restored
Blue finger short->long switching
Long waiting strategy up to section 1.
I marked the target price section at the top / the support line price at the bottom
I will try to apply it to Bitcoin as is.
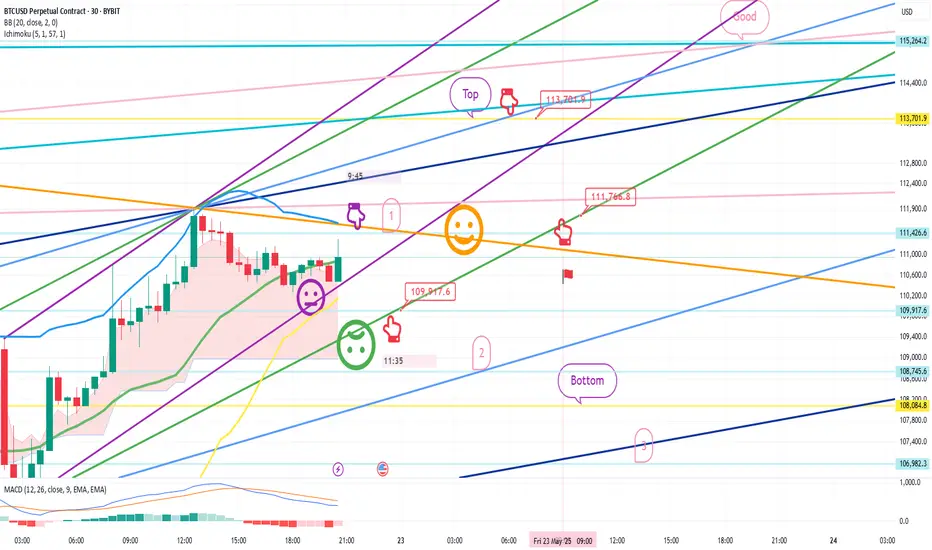
Here is the Bitcoin 30-minute chart.
Nasdaq indicators will be announced at 9:30 and 11:00 shortly.
Nasdaq movement + short-term pattern is broken,
and the Tether Dominance short position operation method is applied to Bitcoin, which moves in the opposite direction.
* One-way long position strategy when the red finger moves
1. $109,917.6 long position entry section / When the green support line is broken,
or when section 2 is touched, stop loss price
2. $113,701.9 long position 1st target -> Good 2nd target price
Section 1 at the top is the last short position operation section of the day,
and when it breaks through, it can be connected to an upward trend,
so it seems advantageous for beginners to use it as a long waiting strategy in an upward wave.
If you touch the red finger long position entry section first among 1 or 109.9K,
You can go around and rise strongly.
If you succeed in rebounding without breaking the purple support line,
Vertical rise
Movement within the 1st section at the top and 2nd section at the bottom is sideways.
Because it is open from Bottom -> 3,
Be careful of Nasdaq fluctuations,
If you succeed today, you will have 4 consecutive perfects.
Please use my analysis articles for reference and use only
I hope you operate safely with principle trading and stop loss prices.
Thank you.
BTC SELL Recommendation down 109400Timeframe: M15
Strategy in use: Trend-following and supply/demand zone-based trading
Technical tools:
Moving Averages (MA): Short-term (red) and long-term (blue) SMAs. Price is below both — confirming a bearish trend.
Volume: Declining volume during consolidation suggests weak buying interest.
Resistance zone: Around 110,890 - 110,930, clearly acting as a barrier as shown by repeated candle rejections.
Price Pattern: After a technical pullback, BTC hits resistance and forms a short setup.
📉 BTC SELL Recommendation
Sell Entry: 110,840 – 110,900
Stop Loss (SL): 111,023 (above resistance zone)
Take Profit (TP): 109,400
Risk:Reward Ratio: Estimated at 1:3 — suitable for a short-term swing strategy.
🧩 Reasons for Entering a Short Trade
Price below MAs, showing bearish momentum.
Strong resistance zone at 110,890 – 111,023 with multiple rejections.
Falling volume during the pullback, indicating weak demand.
Bearish candle structure: Sellers are currently in control.
Good R:R ratio, with profit potential down to 109,400.
⚠️ Warning
If the price closes above 111,023 with strong volume, this setup becomes invalid.
Watch for price action during the U.S. session — it’s key to the next major move

BTCUSD IN SKY !!!!!!!!!!!!When the BTC was at 65k this needs to take a rebound and that is till 18500
Now just bought it and hold your socks
Put Target 100000
Date : 23rd June 2024 !!
BUY ALL CRYPTO NOW !!!!!!!!!

Bitcoin buy on dip given near support 122000-125000 Target openHow to take trades using Harmonic pattern projection Trade setup is explained below :-
Entry : 1st SL point : 0% is recent top or bottom.
Trailing D: 15.1% is work as trailing SL of buy or sell trade if hit then we have to book profit
.If price goes below 2nd D 22.5% to 24.5% range then early traders can make fresh reversals trade after breaking 1st D 15.1% safe traders can reversal trade after breaking Point D 22.5.4% to 24.5% range
Targets :
Target T1 : 36.1% to 38.3%
Target T3 : 49.1% to 52.5%
T3: 60.9% to 64.8% is our 3rd Target since this is reversal zone so must book profit if break then take fresh trade again
Target T4 : 76.4% to 79.7%
Next Targets are 100% , 127.2% ,141.4% and final Target 161.8%.
How to take reversal trade :
If price going upside/ downside then then buy or sell levels appear on Chart ( Automatically show when price reach any reversal zone of harmonic projection ).
Trailing SL:
After reach 1st Target trail SL to just above or below cost ( for example we are holding sell trade from 100 1st Target 110 hit then move trailing sl to 104-105 and move SL as price move upside or Downside)
Re- Entry :
For Re-entry in any pull back Point D ( 15.1% ) is used for re-entry then SL recent high or low Point SL ( 0% ) .
Blue Line is 1st support/ Resistance
Green line is 2nd support/ resistance
Red line is 3rd Support/ resistance
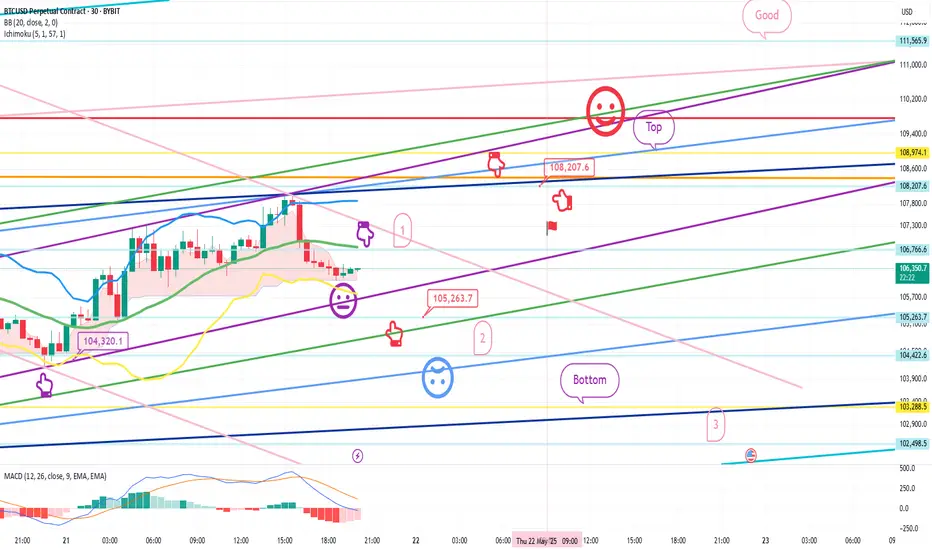
Bitcoin Bybit chart analysis May 21Hello
It's a Bitcoinguide.
If you have a "follower"
You can receive comment notifications on real-time travel routes and major sections.
If my analysis is helpful,
Please would like one booster button at the bottom.
This is the Nasdaq 30-minute chart.
There is no separate indicator announcement today.
After the red finger chase purchase,
I explained the main demand section drawing and price.
I applied it to Bitcoin as is.
This is a Bitcoin 30-minute chart.
At the bottom left, the purple finger
connects the strategy to the long position entry section that was entered on the 20th.
*When the red finger moves,
it is a one-way long position strategy.
1. $105,263.7 long position entry section / stop loss price when the sky blue support line is broken
2. $108,207.6 long position 1st target -> Top 2nd target -> Good 3rd target price
The 1st section at the top is the rising wave confirmation section,
and the strategy is more likely to succeed if the purple support line is broken after the touch.
(If it goes up right away, there is a possibility of a vertical rise)
Red finger long hold
If it goes down right away without touching, it is the final long hold strategy at 2.
From the 2nd section deviation, I marked Bottom -> 3
Since the mid-term pattern was broken yesterday,
you should succeed in rebounding within the green support line if possible.
Up to this point, I ask that you simply use my analysis for reference and use,
and I hope that you operate safely with principle trading and stop loss prices.
Thank you.
BITCOIN RESPECTING TRENDLINE IN DAY TIME FRAMEORANGE line is trend line which is line support taken repeatitively by BITCOIN and how much % going upside and consolidating from its llast low of ascending channel is shown by vertical rectangle if you think can be followed its not my buy/sell call.blue line is my prediction if it follow for the same.GREEN ARROW is base(low of vertical rectangle0.
BTC/USD Bullish Setup: Double Bottom Breakout Targeting $110,000 Trade Setup Analysis
1. Support & Resistance Zones
Support Zone (Buy Zone):
Highlighted in purple, between $103,764 and $104,633, with a noted stop loss area near $104,061.
Resistance/Target Zone (Take Profit Area):
Around $109,878 – $110,002 labeled as “EA TARGET POINT”.
2. Double Bottom Pattern (Bullish Signal)
There are two orange circles at the bottom, indicating a double bottom pattern—often a bullish reversal signal.
This is supported by a neckline break near the entry point at $104,534.
3. Moving Averages
Two moving averages are displayed:
Likely a short-term MA (red) and a medium/long-term MA (blue).
The price crossing above both suggests bullish momentum.
4. Trade Plan
Entry Point: Around $104,534
Stop Loss: Below $104,061
Take Profit (Target): $109,878 – $110,002
Risk/Reward Ratio: High, given the tight stop and wide target.
📈 Price Projection
The blue arrowed path suggests:
A minor dip or consolidation near $104,534, followed by a strong upward move toward the target zone.
The movement outlines a classic cup-and-handle or double-bottom breakout pattern.
🧠 Conclusion
This is a bullish trading setup for BTC/USD with a favorable risk-reward ratio. The chart suggests:
Buying near $104,534
Stop loss just below support
Targeting a move to ~$110,000

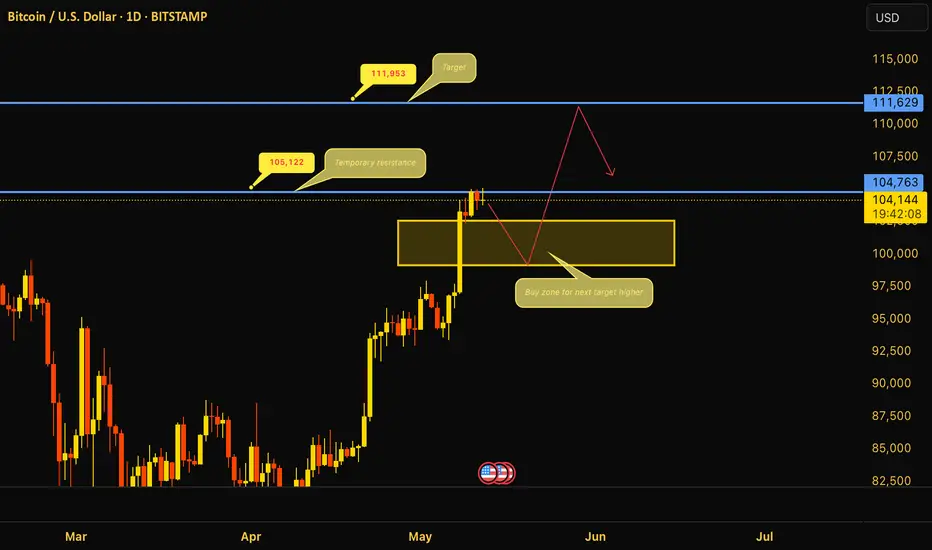
Bitcoin Reloading: Next Stop 111K – Dip is the FuelBitcoin remains in a clear uptrend, and the recent rally has confirmed bullish dominance. After pushing above prior levels, price is now reacting at the 105,000 resistance, which is acting as a temporary pause point. This isn’t a reversal — it’s a controlled breather before the next leg higher.
The price will retrace into the buy zone below — the 98,000 to 100,000 range — which is a key structural level from where the next impulsive rally will ignite. This zone isn’t just a random support; it’s a strong accumulation base where institutional orders are expected to get filled. Once that happens, Bitcoin will resume its push toward the 111,953 target, a level marked by previous price inefficiencies and liquidity build-up.
There is no ambiguity in the structure — this is a textbook bullish continuation setup. Buyers are in control, and the temporary dip is part of the plan, not a breakdown. Ignore the noise above 105K for now — the real move begins once price taps the demand zone and rockets toward 111K.
Verdict:
• 105K is a pause, not a peak.
• 98K–100K is the launchpad.
• 111K+ is the next station.
• Bulls own this chart — stay positioned accordingly.
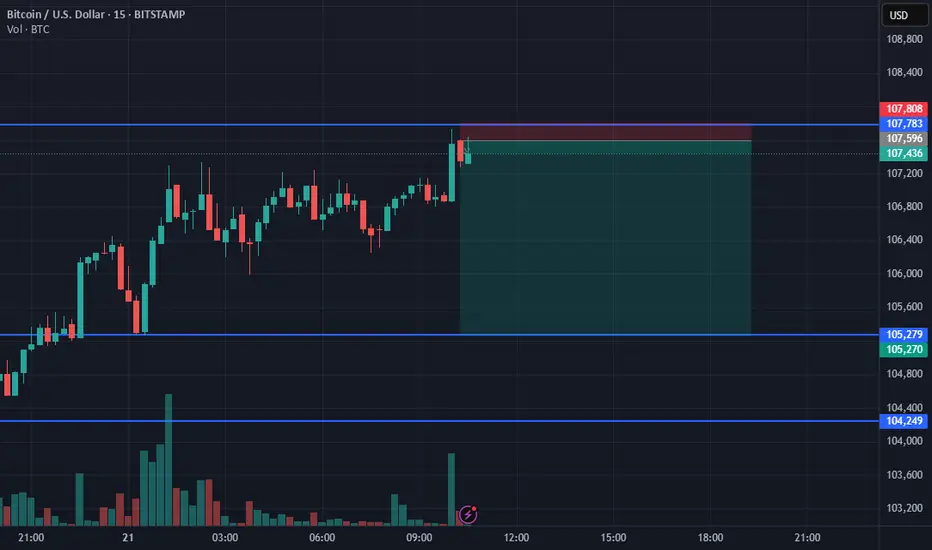
Technical Levels Respected – BTC Reaches $108K Target📍 BTC Target Hit with Precision!
✅ As predicted in the previous analysis, Bitcoin has successfully tapped the $108K resistance zone — clean and technical execution!
📊 My chart spoke in advance... and the market listened.
🎯 Why miss out on these accurate forecasts?
📉 My strategies are not just random lines — they’re built on solid market structure, EMAs, and key price action zones.
📢 Let’s stay connected!
🧠 I’m committed to sharing educational content and professional trading insights to help you grow as a trader.
💡 Whether you're a beginner or seasoned trader, there’s always something new to learn with me.
📚 Join the journey — learn, trade, and win!
📩 DM or follow to get consistent updates and chart breakdowns.
🚀 Let’s trade smart, not hard!

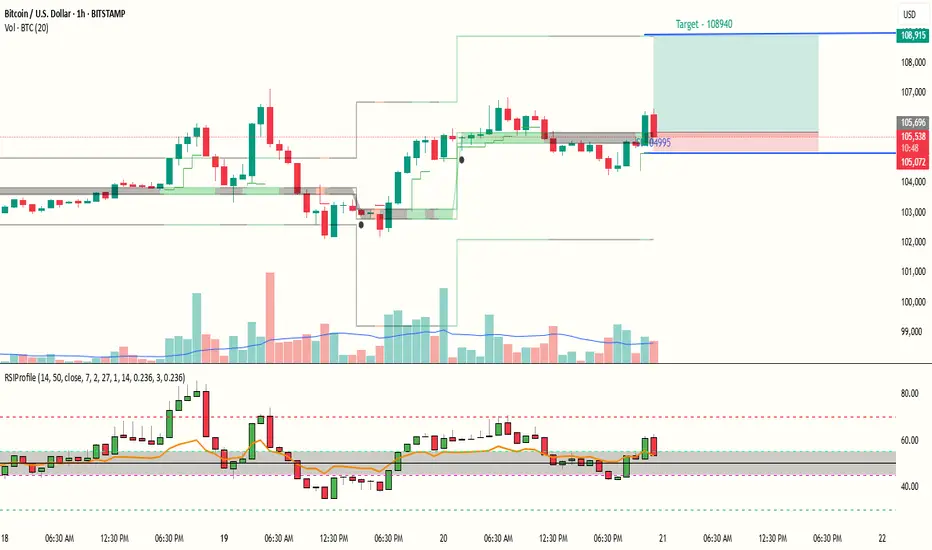
BTC ready for continuation of UP move with a reward ratio of 5RSI Profile shows a positive trend for BTCUSD and and risk reward ration is above 5. Also a Bullish triangle pattern seems to reach near complete on BTC Chart. Price is above RSI Point of Control, hence a small SL below POC and target is near the Value area High.
Entry near 105600
Target near 108940
Sl near 104995
RR : 5.16
PS : Above is only for Educational purpose and does not constitute any financial advice. Do your Own Research.
BTC ew- updateBTC is running in uptrend, is in 5th wave for the upside and looks like ED is cooking for the 5th wave.
Becoz its having internal structure as abc-abc-abc-, almost wave 3 has completed @100% and everything is going according to the pattern rules. If any thing other happens we will correct ourself.
No trade recommadation.

Bitcoin updated levels buy on dip near support How to take trades using Harmonic pattern projection Trade setup is explained below :-
Entry : 1st SL point : 0% is recent top or bottom.
Trailing D: 15.1% is work as trailing SL of buy or sell trade if hit then we have to book profit
.If price goes below 2nd D 22.5% to 24.5% range then early traders can make fresh reversals trade after breaking 1st D 15.1% safe traders can reversal trade after breaking Point D 22.5.4% to 24.5% range
Targets :
Target T1 : 36.1% to 38.3%
Target T3 : 49.1% to 52.5%
T3: 60.9% to 64.8% is our 3rd Target since this is reversal zone so must book profit if break then take fresh trade again
Target T4 : 76.4% to 79.7%
Next Targets are 100% , 127.2% ,141.4% and final Target 161.8%.
How to take reversal trade :
If price going upside/ downside then then buy or sell levels appear on Chart ( Automatically show when price reach any reversal zone of harmonic projection ).
Trailing SL:
After reach 1st Target trail SL to just above or below cost ( for example we are holding sell trade from 100 1st Target 110 hit then move trailing sl to 104-105 and move SL as price move upside or Downside)
Re- Entry :
For Re-entry in any pull back Point D ( 15.1% ) is used for re-entry then SL recent high or low Point SL ( 0% ) .
Blue Line is 1st support/ Resistance
Green line is 2nd support/ resistance
Red line is 3rd Support/ resistance

BITCOIN BROKEN HOURLY CHANNEL On this chart i have drawing a channel in hourly time frame which is broken and sustaining as well until entering i thius channel BITCIN is bullish.here i shown when is it tested uper an lower side of the channel so that no confusion should be there in mind.

Bitcoin Short Trade Setup: Enter Now with 1:10 R:RThis Bitcoin short trade setup presents a high-potential opportunity for traders who are closely monitoring the crypto markets. With market sentiment showing signs of exhaustion at resistance and key technical indicators flashing warning signals, now may be the ideal time to enter a short position — with a clearly defined 1:10 risk-to-reward (R:R) ratio.
Bitcoin 1D Technical Commentary Paths- Bitcoin is currently trading at 105,148$
- Bitcoin is trading at a crucial BUY SIDE Liquidity area where breakout traps are highly possible, ATH was 109,490$ one tap above that will make retailers open aggressive longs and make them super bullish too
- Bitcoin printed an impulsive move from 88,000 which led to large imbalanced candles getting printed and it eventually printed 2 Inefficient gaps which is likely to get filled
- We have 2 paths, we either print a new high and fill 96,000 before we move up again or else we move towards the inefficient gaps and then print a new all time high

Bitcoin Short Setup –Supply Zone Rejection Trade Plan (1H Chart)(BTC/USD – Technical Setup)
🔵 Trend Setup:
⬆️ Resistance Line – Price is struggling to break above this level.
⬇️ Support Line – Price bounced several times here before breaking down.
🟢 EMA 70 – Currently around 104,435.9, acting as dynamic support/resistance.
📍 Key Levels:
🔴 Stop Loss Zone:
107,488.4 to 107,402.4
(🚨 Strong resistance, limit losses!)
🟡 Entry Point:
106,026.8
(🟨 Inside the Supply Zone – Ideal for Sell)
🟦 Supply Zone:
106,026.8 to 107,402.4
(⚠️ High selling pressure expected here!)
🔵 Break of Structure (BOS):
Price broke below the rising support line
(📉 Bearish confirmation!)
🎯 Target Point:
99,000.0
(💰 Take Profit Target!)
🔻 Trade Idea:
SELL at 106,026.8
🛑 Stop Loss: 107,488.4
✅ Target: 99,000.0
Risk-Reward looks solid.
This is a short setup expecting a drop after a retest of the supply zone.
