BTCUSD BTCUSD
Possibility liquidity with good amount volume .
From the level .
Analysis will work with entry areas
BTCUSD.PI trade ideas

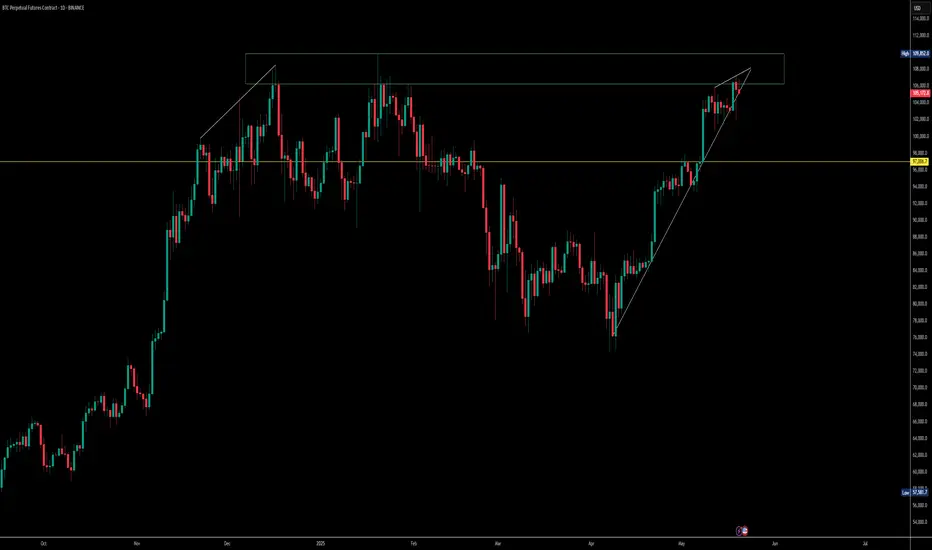
$BTC Facing Strong Rejection – Correction Ahead?CRYPTOCAP:BTC is showing clear rejection signs from the trendline near the key resistance zone around $107,000, replicating the December 2024 - January 2025 structure.
Hanging Man candle near resistance
Bearish RSI divergence
MACD bearish crossover
Weak buying pressure vs growing selling volume
Stochastic RSI fading out
one retest around 97000$
If $90K support breaks, watch out for a deeper drop toward $60K.
Market structure suggests a smart correction is brewing. Don’t ignore the signs.
Bitcoin updated levels buy on dip given at 102200 How to take trades using Harmonic pattern projection Trade setup is explained below :-
Entry : 1st SL point : 0% is recent top or bottom.
Trailing D: 15.1% is work as trailing SL of buy or sell trade if hit then we have to book profit
.If price goes below 2nd D 22.5% to 24.5% range then early traders can make fresh reversals trade after breaking 1st D 15.1% safe traders can reversal trade after breaking Point D 22.5.4% to 24.5% range
Targets :
Target T1 : 36.1% to 38.3%
Target T3 : 49.1% to 52.5%
T3: 60.9% to 64.8% is our 3rd Target since this is reversal zone so must book profit if break then take fresh trade again
Target T4 : 76.4% to 79.7%
Next Targets are 100% , 127.2% ,141.4% and final Target 161.8%.
How to take reversal trade :
If price going upside/ downside then then buy or sell levels appear on Chart ( Automatically show when price reach any reversal zone of harmonic projection ).
Trailing SL:
After reach 1st Target trail SL to just above or below cost ( for example we are holding sell trade from 100 1st Target 110 hit then move trailing sl to 104-105 and move SL as price move upside or Downside)
Re- Entry :
For Re-entry in any pull back Point D ( 15.1% ) is used for re-entry then SL recent high or low Point SL ( 0% ) .
Blue Line is 1st support/ Resistance
Green line is 2nd support/ resistance
Red line is 3rd Support/ resistance
BTC USD Weekly analysis (18-05-25 to 24-05-25)₿ Bitcoin (BTC/USD) – 4H Chart Breakdown
🗓️ Update: May 19, 2025
📍 Price: $103,143
📊 Published by: JOY-OF-RISK-TARGET-ONE-WAVE
🕰️ Timeframe: 4H
🔄 Market Structure Insight:
BTC faced a sharp rejection above $106,000, failing to hold bullish momentum.
The current structure suggests a potential reversal or deeper correction, confirmed by consecutive bearish candles post-spike.
📉 Bearish Outlook Pathways:
🟥 Scenario A – Mild Pullback:
Price dips toward $100,000–$101,000 support
Could form a base for rebound if buyers step in early
🟥 Scenario B – Deep Correction (High Probability):
Breakdown accelerates toward the major demand zone at $97,300–$98,600
A deeper retracement aligning with the Fib 0.5–0.618 retracement of the May rally
⚠️ Key Levels to Watch:
Immediate Resistance: $106,000
Support 1: $101,000
Support 2: $98,600
Critical Demand: $97,300
🎯 Trading Strategy:
Bearish bias short-term.
Ideal play: Wait for a retest + rejection at $104,500–$105,000 zone for short entries.
Bulls must reclaim $106,000 for trend continuation.
🧠 Note from JOY-OF-RISK:
“The wave is turning. Watch structure, not emotion. Trade the path with clarity.” 🌊

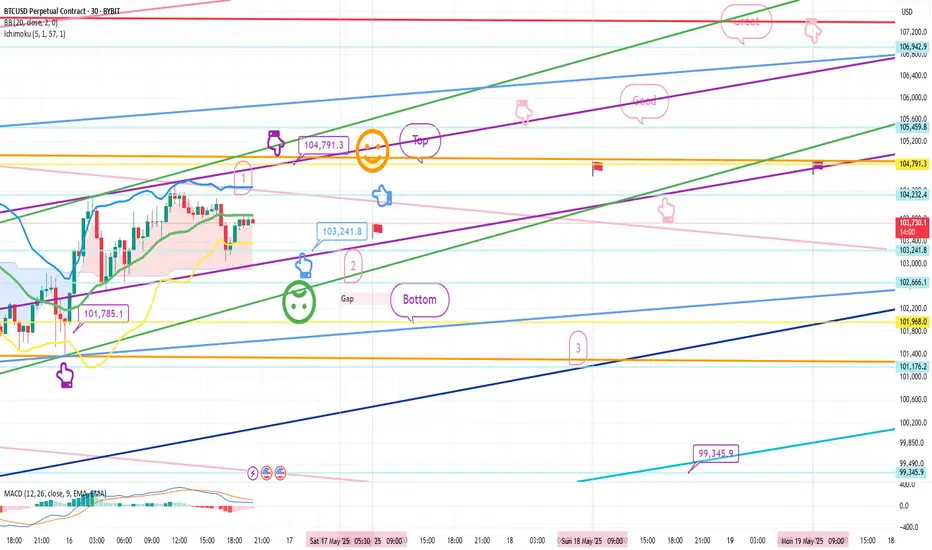
Bitcoin Bybit chart analysis May 16 BitcoinHello
It's a Bitcoinguide.
If you have a "follower"
You can receive comment notifications on real-time travel routes and major sections.
If my analysis is helpful,
Please would like one booster button at the bottom.
This is the Nasdaq 30-minute chart.
There is no separate indicator announcement.
We proceeded with trend following.
After entering the 1st long position at the top,
If it does not break away from the purple support line, it goes up vertically.
*We proceeded along the red finger movement path in the next wave.
We expected the movement to be a strong rise.
From the bottom breakaway, it is open up to the 2nd section,
and we will omit the detailed explanation.
This is the Bitcoin 30-minute chart.
At the bottom left, with a purple finger,
I connected the long position entry section of 101,785.1 dollars that I had on the 15th.
The current position is the 30 + 1 section,
but since the 4 and 6-hour central lines were also touched at the same time,
the mid-term pattern is broken,
and the daily chart MACD dead cross is in progress.
The strategy is one-way, one-way,
I am explaining it only on one page of the 30-minute chart,
so it is limited, but I organized it as simply as possible.
*When the blue finger moves
Two-way neutral
Short->Long or long waiting strategy
1. 104,791.3 dollars short position entry section / stop loss price when orange resistance line is broken
2. 103,241.8 dollars long position switching / stop loss price when green support line is broken
After that, long position target price in the order of Good -> Great
-> Refer to pink finger simulation.
If it touches the top once or comes down right away from the current position,
it is the final long waiting strategy at the bottom section 2.
From the bottom section breakout,
it is open from 3 -> 99345.9 dollars.
Please use my analysis article so far only for reference and use
I hope you operate safely with principle trading and stop loss price.
Thank you for your hard work this week.
BTCUSD LONG? QUICK REVERSAL SET UP WITH 1:2 RRHello traders, BTCUSD has fall more and came near the previous support zone we will try to capture small reversal trade here, buy BTCUSD if 15min candle close above 103150 our trade will be only valid if it's give closing above that lvl this is advance trade set up so wait for the trade to activate.
BUY BTCUSD ABOVE 103150(15MIN CANDLE CLOSE ABOVE THIS LVL)
SL:-102048
TP:-105500/107000 ZONE
HAVE A GREAT DAY

BTCUSDBTCUSD
Long positions adding at the lower level with the good point of R:R
ENTRY LEVEL ABOVE 103.142K


BITCOIN FORMING SAUCER PATTERNBITCOIN forming saucer in hourly time frame which is bulish pattern first of all it will test upper side of triangle if breakout sustained above upper side of triangle a big move will come.If not sustaining will come back again for lower side of triangle.

A bulish crossover is forming in macd and rsi RSI - its in normal range not over sold not over baught hense can goo for a bulish move
MACD - its makeing a bulish crossover in 1hr time frame
TARGATES = 105k
SL - up to your risk management skils
Bitcoin support 102k, 98500 buy dip Target 105400,107300,109500How to take trades using Harmonic pattern projection Trade setup is explained below :-
Entry : 1st SL point : 0% is recent top or bottom.
Trailing D: 15.1% is work as trailing SL of buy or sell trade if hit then we have to book profit
.If price goes below 2nd D 22.5% to 24.5% range then early traders can make fresh reversals trade after breaking 1st D 15.1% safe traders can reversal trade after breaking Point D 22.5.4% to 24.5% range
Targets :
Target T1 : 36.1% to 38.3%
Target T3 : 49.1% to 52.5%
T3: 60.9% to 64.8% is our 3rd Target since this is reversal zone so must book profit if break then take fresh trade again
Target T4 : 76.4% to 79.7%
Next Targets are 100% , 127.2% ,141.4% and final Target 161.8%.
How to take reversal trade :
If price going upside/ downside then then buy or sell levels appear on Chart ( Automatically show when price reach any reversal zone of harmonic projection ).
Trailing SL:
After reach 1st Target trail SL to just above or below cost ( for example we are holding sell trade from 100 1st Target 110 hit then move trailing sl to 104-105 and move SL as price move upside or Downside)
Re- Entry :
For Re-entry in any pull back Point D ( 15.1% ) is used for re-entry then SL recent high or low Point SL ( 0% ) .
Blue Line is 1st support/ Resistance
Green line is 2nd support/ resistance
Red line is 3rd Support/ resistance

btcusdBTCUSD is the ticker symbol for Bitcoin and the United States dollar exchange rate. BTCUSD is a cryptocurrency CFD because of the presence of Bitcoin as the base currency. Cryptocurrencies are known for their immense volatility, while the US dollar is by far the most traded fiat currency globally.

BTC/USD DAILY PLAN – Will Bitcoin Hit 110K Before Reversing?BTC/USD DAILY PLAN – Will Bitcoin Hit 110K Before Reversing?
After a strong bullish impulse, BTC is now consolidating in a tight range between 103K–106K on the H4 chart. The ascending parallel channel remains intact, but bullish momentum is fading — a sign of potential distribution at the top.
🧠 Macro Context
BTC pumped recently thanks to ETF news and institutional inflows.
However, volume is decreasing, suggesting smart money may be offloading.
DXY and U.S. bond yields are ticking up → this could add pressure on BTC in the short term.
📊 Technical Outlook (H4 Chart)
BTC remains inside an ascending channel. Key levels to watch:
🔺 Resistance:
106,000 – local range high (H4)
110,576 – extended target if price breaks out
🔻 Support:
101,775 – bottom of current range; a breakdown here confirms weakness
94,473 – strong demand zone + EMA200
84,371 – key structural support zone if deeper correction occurs
⚠️ BTC may fake a rally toward 110K and then reverse sharply if broader macro conditions worsen.
🎯 Trading Scenarios
🔹 SCALP BUY:
Entry: 101,800 – 102,000
Stop-Loss: 100,800
Take-Profits: 103,200 → 104,000 → 105,000 → 106,000
Only enter long if price holds above 101.7K and shows strong rejection candles.
🔸 SELL ZONE:
Entry: 110,000 – 110,500
Stop-Loss: 111,200
Take-Profits: 107,000 → 105,000 → 101,775 → 94,473
Watch for exhaustion or false breakout patterns at this psychological zone.
🟢 LONG-TERM BUY ZONE:
Entry: 94,500 – 94,000
Stop-Loss: 92,500
Take-Profits: 96,000 → 98,000 → 100,000 → 103,000
Ideal for swing entries if BTC retraces into the broader demand zone.
⚠️ Key Notes:
BTC is showing signs of “rise slowly – dump fast” behavior.
Keep close watch on 101,775 – a decisive level for intraday direction.
No Fed rate cuts in sight → big money may still stay cautious.
✅ Conclusion:
Stick to trading range setups: BUY at channel base – SELL at distribution zones
Avoid FOMO and only enter trades after clear price action confirmation.
Risk management is essential during this high-trap environment.

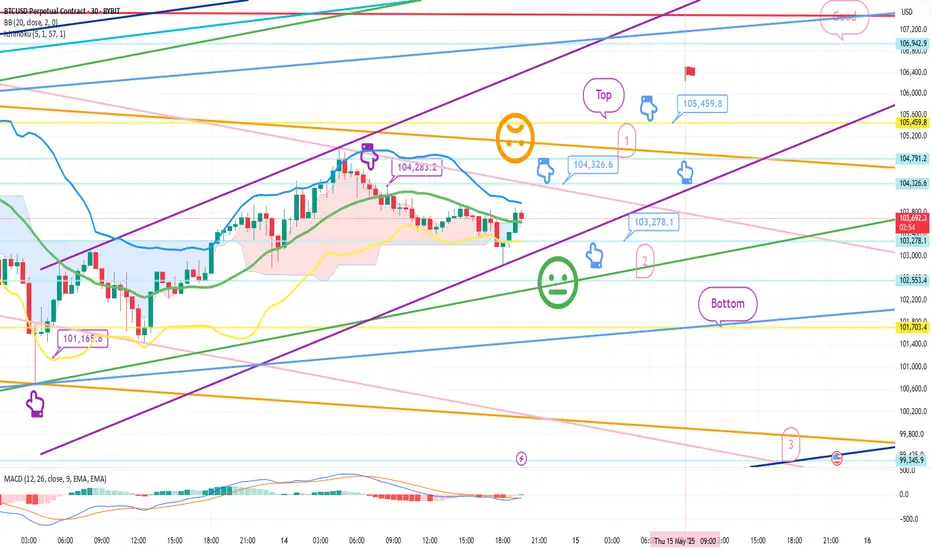
Bitcoin Bybit chart analysis May 14Hello
It's a Bitcoinguide.
If you have a "follower"
You can receive comment notifications on real-time travel routes and major sections.
If my analysis is helpful,
Please would like one booster button at the bottom.
This is the Nasdaq 30-minute chart.
There is no separate indicator announcement today.
I conducted a brief analysis with rough movements.
The 3-hour chart MACD dead cross pressure is in progress,
and from the purple finger at the top to number 1,
it is the best short position entry section of the day,
and from the orange resistance line breakthrough, it is an upward trend.
*The 21.1K red finger at the bottom is a long-term strategy,
and if there is a rebound within the purple support line without touching the entry point,
it will rise vertically.
The short-term pattern may be broken from the 2nd section,
and it is a downward sideways movement to the bottom -> the 3rd section is the 1+4 section.
I applied it to Bitcoin as is.
This is a 30-minute chart for Bitcoin.
Since there is no Nasdaq indicator announcement, we proceeded with trend following.
In the case of Bitcoin, the 12-hour chart MACD dead cross was engraved,
and the lower Bollinger band was touched first.
On the left, with the purple finger,
101.1K long -> 104.283.2 dollar short switching
I connected the strategy as it is.
*When the blue finger moves,
It is a two-way neutral
short->long switching strategy.
1. 104.326.6 dollar short position entry section / stop loss price when orange resistance line is broken
2. 103,278.1 dollar long position switching / stop loss price when green support line is broken
If the strategy is successful,
section 1 can be used as a long position re-entry section. (Purple parallel line maintenance condition)
I proceeded tightly up and down for fear of missing the entry point.
Instead, if I explain in detail,
The movement within 1 at the top and 2 at the bottom is a sideways section,
and it is a section where a trend can emerge when breaking out or breaking out.
For those who have been holding a short position since yesterday,
I think it would be good to operate with a stop loss price when breaking out of the orange resistance line, just like today's strategy.
If it comes down right away without touching the 104.3K short entry point,
the final long position is waiting in the 2nd section.
The stop loss price is the same.
If it breaks out of the bottom section today, it can be directly connected to the 3rd section at the bottom,
so those who are operating a long position should be careful.
Up to this point, I ask that you simply refer to and use my analysis,
and operate safely with principle trading and stop loss price. Please support the 4 consecutive perfect challenges
Thank you
BTCUSD SHORT! With 1:3 RR SET UPHello traders, I'm back with another advance trade set up, in BTCUSD 1H tf price is making LL & LH formation which suggests potential reversal from its highs. in bigger tf BTCUSD also comes near the previous resistance zone, so here we can go with short set up for good Risk to reward ration.
Short BTCUSD if 1H candle close below 102700
With SL:- 104500-105000 zone and Tp1)100000 & Tp2) 98000-96000 range it's a Swing trade so we have to wait for our tp, it's advance trade set up so entry will be valid only if it closes below 102700 lvl. Once you get 1:1 RR trail your sl and book part profits👍 I will post update in comments, have a great day

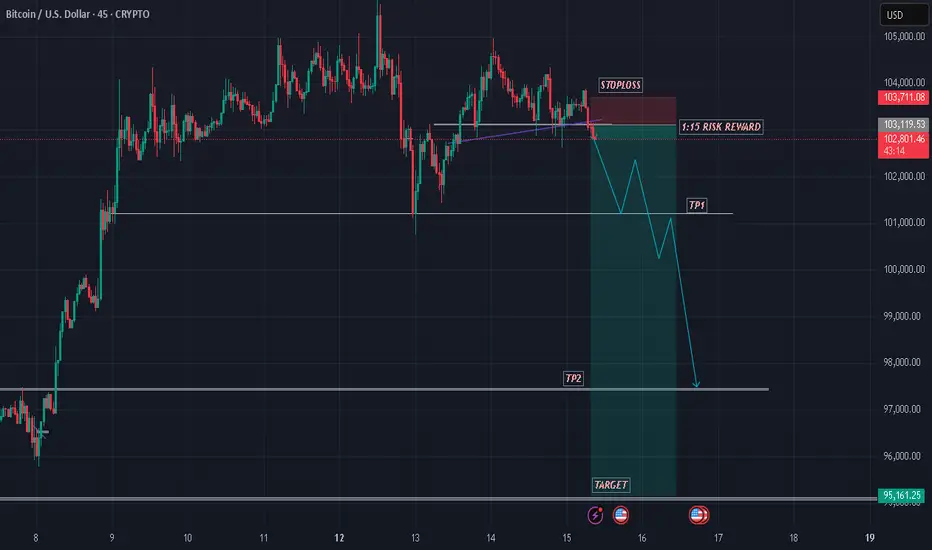
BTCUSD SHOWING A GOOD DOWN MOVE WITH 1:15 RISK REWARD BTCUSD SHOWING A GOOD DOWN MOVE WITH 1:15 RISK REWARD
DUE TO THESE REASON
A. its following a rectangle pattern that stocked the market
which preventing the market to move any one direction now it trying to break the strong resistant lable
B. after the break of this rectangle it will boost the market potential for break
C. also its resisting from a strong neckline the neckline also got weeker ald the price is ready to break in the outer region
all of these reason are indicating the same thing its ready for breakout BREAKOUT trading are follws good risk reward
please dont use more than one percentage of your capitalfollow risk reward and tradeing rules
that will help you to to become a bettertrader
thank you
Is BTCUSD still in WXY correction phase ?BTCUSD continues to be correcting till 48K-62K band, this is weekly chart so it will take time.
Current up-move seems to be X wave as indicated.,
Why 51-62K is the band where correction will end ?
a. Technical divergence gets resolved here
b. 1.618 Fib relation of assumed corrective Wave-W falls in this band
Can the current rising segment impulsive ?
No because current rising segment is pretty corrective supporting high probability of next wave-Y
Will the correction stop at Wave-Y ?
May not be as one more leg up (Wave-X) and one more Leg down (Wave-Z) can be formed

Bitcoin facing resistance near ATH buy above 105600 or buy 98800How to take trades using Harmonic pattern projection Trade setup is explained below :-
Entry : 1st SL point : 0% is recent top or bottom.
Trailing D: 15.1% is work as trailing SL of buy or sell trade if hit then we have to book profit
.If price goes below 2nd D 22.5% to 24.5% range then early traders can make fresh reversals trade after breaking 1st D 15.1% safe traders can reversal trade after breaking Point D 22.5.4% to 24.5% range
Targets :
Target T1 : 36.1% to 38.3%
Target T3 : 49.1% to 52.5%
T3: 60.9% to 64.8% is our 3rd Target since this is reversal zone so must book profit if break then take fresh trade again
Target T4 : 76.4% to 79.7%
Next Targets are 100% , 127.2% ,141.4% and final Target 161.8%.
How to take reversal trade :
If price going upside/ downside then then buy or sell levels appear on Chart ( Automatically show when price reach any reversal zone of harmonic projection ).
Trailing SL:
After reach 1st Target trail SL to just above or below cost ( for example we are holding sell trade from 100 1st Target 110 hit then move trailing sl to 104-105 and move SL as price move upside or Downside)
Re- Entry :
For Re-entry in any pull back Point D ( 15.1% ) is used for re-entry then SL recent high or low Point SL ( 0% ) .
Blue Line is 1st support/ Resistance
Green line is 2nd support/ resistance
Red line is 3rd Support/ resistance

bitcoin zonecould this pink line act as a mirror? Can we perhaps range sideways in this region for a while and then shoot up eventually? It appears it can happen. These prices are uncharted waters so nothing can be said for certain. But we can hope for the best. Perhaps while bitcoin ranges there will be an eth season

BTC zeroIf BTC doesn't break the top, it will return to the stone age
1) Too much news, everyone knows about the coin
and stores it as an asset!
2) Trading volume is down
3) All information is consistent with the 5th wave of the elliot theory

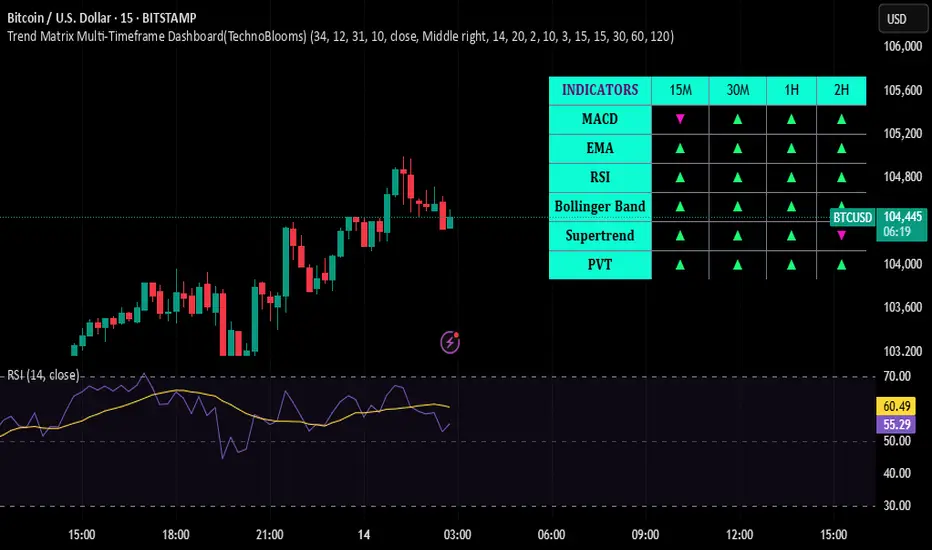
Trend Matrix+RSI: Simple Multi‑Timeframe Strategy for Confident 🔰 Trend Matrix + RSI: Simple Multi‑Timeframe Strategy for Confident Trades 🚀
Want a strategy that’s easy for beginners yet powerful enough for pros? This TradingView idea combines the Trend Matrix Multi-Timeframe Dashboard with the classic RSI indicator to create a visually compelling, high-probability trading method. By aligning multi-timeframe trend signals with momentum confirmation, you get clear guidance on when to enter and exit trades on any market – from Bitcoin and Gold to Nifty 50. 📈✨
Strategy Overview 🎯
• Trend Matrix MTF Dashboard: This is a multi-timeframe trend analyzer that compresses several trusted indicators into one simple dashboard . It displays a grid of up/down arrows showing the trend signal from multiple indicators (like MACD, EMA, RSI, Bollinger Bands, Supertrend, PVT) across different timeframes . If most arrows are green (up), the market’s trend is bullish; if mostly red (down), it’s bearish. Think of it as a “trend at a glance” panel – a quick green-light/red-light system that helps you trade with confidence by filtering out noise . It’s designed to be clean and beginner-friendly (no messy charts!) , so you can instantly gauge the dominant trend without flipping through multiple timeframes.
• RSI (Relative Strength Index): RSI measures momentum and identifies overbought/oversold conditions. It’s a favorite tool for confirming entries: when RSI is low (oversold) in an uptrend, it suggests a good buy the dip opportunity; when RSI is high (overbought) in a downtrend, it suggests a good sell the rally spot . RSI also has a midpoint at 50 – above 50 generally indicates bullish momentum, below 50 indicates bearish momentum. By combining RSI with the Trend Matrix, we add an extra layer of confirmation so we’re not just blindly following trend signals – we’re waiting for momentum to agree with the trend direction.
Why this combo? The Trend Matrix gives you the big picture trend alignment (across 1H, 15M, etc.) while RSI pinpoints timing for entries. This way, you trade with the larger trend but only enter when momentum swings in your favor. The result is a simple strategy that catches strong moves and avoids false signals. This works best in trending markets (when the Trend Matrix shows a clear majority direction) – that’s when our trend+momentum combo shines. In choppy/ranging markets (mixed signals on the dashboard), it’s wise to be patient or use tighter confirmation (e.g. require an extra indicator or higher RSI threshold) because signals can flip-flop in ranges. Always remember: no indicator is 100%, but combining them stacks the odds in our favor by aligning trend and momentum. 💪
Entry & Exit Rules 📌
Timeframes: Higher timeframe: 1H (for trend direction) – Lower timeframe: 15M (for entries). We use 1H Trend Matrix to define the context, and 15M with RSI for execution. (You can adapt to other pairs like 4H/1H for swing trades or 15M/5M for scalping, but 1H/15M is a universal starting point that works for crypto, commodities, and indices.)
1️⃣ Identify the Trend (1H Chart): Check the Trend Matrix dashboard on the 1H timeframe for the asset you’re trading (e.g., BTC/USD, XAUUSD, NIFTY). If the majority of signals on 1H are up (mostly green arrows), your bias is LONG. If the majority are down (mostly red arrows), your bias is SHORT. No clear majority? The market might be sideways – consider waiting. 👍
2️⃣ Align Lower Timeframe (15M Chart): Switch to the 15M chart. Ensure the 15M Trend Matrix is at least mostly aligned in the same direction as the 1H. You want to see that the short-term trend is not fighting the higher timeframe. This keeps you trading in the direction of the dominant trend, avoiding counter-trend traps  .
3️⃣ RSI Confirmation for Entry: Now use RSI on the 15M chart to time your entry:
• For a Long Trade: Wait for RSI to dip into an oversold zone (below ~30) during that uptrend. An oversold reading in a bullish-trending market means price pulled back against the trend – a potential entry point. Enter long when RSI starts rising back up (e.g., crosses above 30 or 40 from below) and the Trend Matrix still shows bullish alignment. Another method: if RSI was below 50 and then pushes back above 50, it signals momentum is regaining in the upward direction . This is your green light to buy.
• For a Short Trade: Wait for RSI to spike into an overbought zone (above ~70) during that downtrend. Overbought in a bearish trend = a bounce that could reverse down. Enter short when RSI turns down from high levels (e.g., drops below 70 or 60) and the Trend Matrix still shows bearish alignment. Alternatively, an RSI cross from above 50 downwards back below 50 can confirm momentum turning down with the trend .
✨ The idea is to buy dips in an uptrend and sell rips in a downtrend. RSI is your trigger to make sure you’re entering when momentum is resetting in your favor, rather than chasing an already overextended move.
4️⃣ Exiting the Trade: Set clear exit rules to lock in profit and limit risk:
• Take Profit/Exit on Momentum Extremes: In a long, consider taking profit when RSI reaches back into overbought (>70) on the 15M or shows a bearish divergence (signs of trend exhaustion). In a short, take profit when RSI goes oversold (<30) or shows bullish divergence. This way, you exit as the move reaches the opposite extreme of momentum.
• Dashboard Trend Reversal: If the Trend Matrix starts to flip signals against your trade (e.g., you were long and you see several key cells turn from green to red on the 15M or 1H dashboard), that warns the trend may be weakening. You could exit if 4-5 or more of the 15M signals turn opposite or if the 1H majority is no longer aligned . For example, if you’re long and the dashboard goes from mostly green to half red, it’s time to secure profits or tighten your stop.
• Stop Loss: Always use a stop! A common approach is placing a stop-loss below the recent swing low (for longs) or above the recent swing high (for shorts) on the 15M chart. If price hits this, it means the setup failed and you exit the trade to prevent larger losses. 🔒
By following these entry/exit rules, you’ll ride the trend when both the trend structure (Trend Matrix) and momentum (RSI) agree, and step aside when they don’t.
Tips for Beginners 💡
• Stick to Clear Trends: This strategy shines in clear uptrends or downtrends. If the Trend Matrix panel is mixed (some green, some red), the market may be choppy – be patient or skip trading until a direction emerges. 🔃
• Use 1H/15M as a Starting Point: For versatility, start with 1H trend and 15M entries, which works well for intraday and short swing trades on BTC, Gold, Nifty, etc. Once comfortable, you can experiment with other timeframe pairs (e.g., 4H/1H for longer swings, or 15M/5M for faster scalps).
• Don’t Ignore Risk Management: Even the best strategy can have losses. Always set a stop-loss and manage your trade size. For example, if the dashboard and RSI setup looks perfect, still only risk a small percentage of your capital on the trade. Risk management is key to long-term success. 📉🔒
• Practice and Review: Try this combo out on historical data or a demo account first. Observe how often the signals would have worked and how you might fine-tune entry timing. With practice, you’ll get a feel for how the Trend Matrix and RSI interact. 📝✅
• Stay Emotionally Disciplined: The dashboard gives a quick green/red view, and RSI adds confidence, but avoid taking trades out of FOMO if the criteria aren’t met. It’s okay to miss a move – there will always be another opportunity. Keep a cool head and stick to the rules. 👍
By following this beginner-friendly game plan, you’ll be leveraging a powerful multi-timeframe edge. The Trend Matrix + RSI combo helps ensure you trade with the trend and with momentum on your side – a recipe for more confident and higher-probability trades. Good luck and happy trading! 🍀🚀
#BTCUSD #XAUUSD #NIFTY50 #TrendMatrix #RSI #TradingStrategy #MultiTimeframe #DayTrading #SwingTrading #TechnoBlooms #Beginners
Bitcoin updated levels 98700-98000 support buy dip or after ATH How to take trades using Harmonic pattern projection Trade setup is explained below :-
Entry : 1st SL point : 0% is recent top or bottom.
Trailing D: 15.1% is work as trailing SL of buy or sell trade if hit then we have to book profit
.If price goes below 2nd D 22.5% to 24.5% range then early traders can make fresh reversals trade after breaking 1st D 15.1% safe traders can reversal trade after breaking Point D 22.5.4% to 24.5% range
Targets :
Target T1 : 36.1% to 38.3%
Target T3 : 49.1% to 52.5%
T3: 60.9% to 64.8% is our 3rd Target since this is reversal zone so must book profit if break then take fresh trade again
Target T4 : 76.4% to 79.7%
Next Targets are 100% , 127.2% ,141.4% and final Target 161.8%.
How to take reversal trade :
If price going upside/ downside then then buy or sell levels appear on Chart ( Automatically show when price reach any reversal zone of harmonic projection ).
Trailing SL:
After reach 1st Target trail SL to just above or below cost ( for example we are holding sell trade from 100 1st Target 110 hit then move trailing sl to 104-105 and move SL as price move upside or Downside)
Re- Entry :
For Re-entry in any pull back Point D ( 15.1% ) is used for re-entry then SL recent high or low Point SL ( 0% ) .
Blue Line is 1st support/ Resistance
Green line is 2nd support/ resistance
Red line is 3rd Support/ resistance

"BTC/USD Short from 104,855 – Target 93,159. Entry Point
104,855 USD is marked as the entry point (likely for a short position).
The current price is around 103,775 USD, slightly below the entry level.
2. Resistance Zone
Highlighted just below the entry point (~103,000–104,855 USD).
Price is currently testing this zone, possibly indicating a failed breakout or pullback setup.
3. Stop Loss
Placed around 104,807 USD, just above the resistance area, in a shaded purple zone.
Suggests the trade strategy is based on shorting near resistance with a tight stop.
4. Target
EA Target Point is marked at 93,159 USD.
Implies a projected downward move of about −11,264 USD (−10.76%) from entry.
5. Indicators & Tools Used
Moving Averages: 200-period (blue) and a shorter MA (red), showing bullish momentum.
Support/Resistance Zones: Multiple purple rectangles denote demand/supply areas.
Trend Lines: Used to capture recent bullish momentum; a break of the lower line may confirm a trend reversal.
6. Pattern Recognition
Series of lower highs forming after a strong uptrend could suggest bearish divergence or distribution phase.
The price appears to be stalling at the resistance area, aligning with a potential short setup.
🧾 Trade Setup Analysis:
Bias: Bearish (short position).
Entry: 104,855
Stop Loss: 104,807 (tight SL above resistance zone)
Take Profit: 93,159
Risk-Reward Ratio (RRR): Roughly 1:10, which is aggressive and would require high conviction or confirmation
