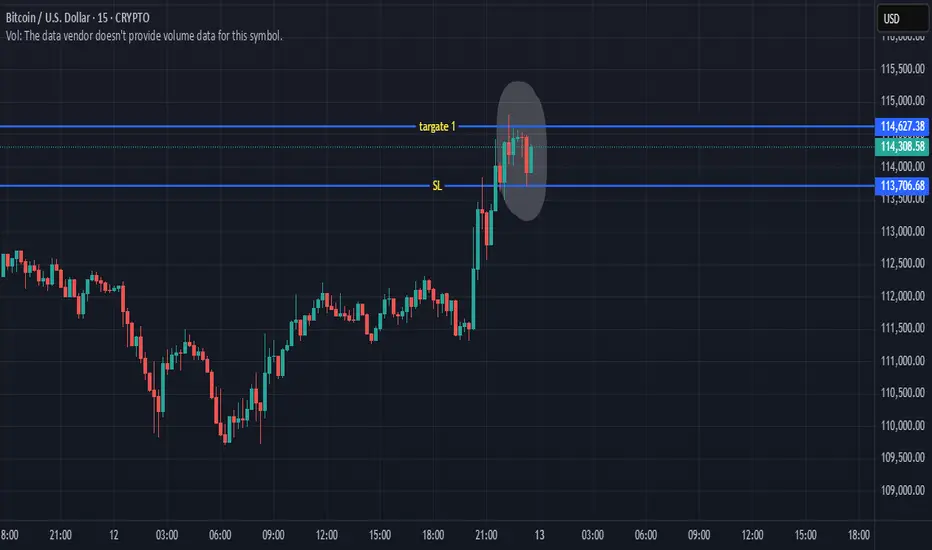
BTC is now creating a IOB and reach easyly TARGATE 1trade wisely this is not a tradeing advice
if it helps do like and contact
BTCUSD.PI trade ideas
Bitcoin Faces Sudden Shakeout After Weeks of CalmBitcoin Volatility Returns as Market Momentum Resets
Hello Traders,
The Bitcoin market experienced a sudden burst of volatility in the recent session, ending a period of relative calm. On the 4H timeframe (Binance), intense selling pressure drove prices from near $117,000 down to roughly $109,000 before stabilizing around the $112K region. The swift decline marked a clear shift in short-term momentum, showing that buyers are beginning to lose dominance as broader market sentiment cools.
This pullback unfolded against a backdrop of renewed global uncertainty. A series of trade-related policy headlines reignited risk aversion, while continued strength in the U.S. dollar added additional stress to crypto markets. Institutional flows briefly reversed, signaling reduced confidence in near-term upside potential. The result was a wave of forced liquidations, magnified by leverage, as traders rushed to adjust exposure during the drop.
Despite the intensity of the move, market conditions remain structurally healthy. On-chain data shows that long-term holders are largely unmoved, suggesting this phase is more of a short-term repricing than a major cycle reversal. Derivative markets, however, have cooled significantly — open interest has thinned, and funding rates have normalized, indicating a temporary reset in speculative participation.
In the coming days, Bitcoin’s behavior will likely depend on liquidity dynamics rather than new macro data. With upcoming U.S. economic reports delayed and the dollar holding firm, volatility may persist as traders respond to headlines and reposition ahead of the next policy developments.
For now, the market appears to be in a state of balance after rapid liquidation. Whether this forms a new accumulation base or precedes deeper correction will depend on how quickly momentum returns. The broader sentiment remains cautious but stable — a waiting phase, as the market tests its conviction once more.
BTC approaching a sell side OBBTC is approaching a sell side OB+FVG.
There is also liquidity along the way too.
If market sweeps liquidity and taps on FVG we could see a bearish move.
If market break above this OB then expect a sweet upside momentum.
Thanks...

Part 2 Master Candle Stick PatternHow Option Trading Works
Let’s take a simple example.
Suppose a stock named XYZ Ltd. is trading at ₹1000. You believe it will rise in the next month, so you buy a call option with a strike price of ₹1050, expiring in one month, and pay a premium of ₹20 per share.
If the price rises to ₹1100, your profit = (1100 - 1050 - 20) = ₹30 per share.
If the price stays below ₹1050, you lose the premium (₹20 per share).
This is the beauty of options — your loss is limited to the premium, but your potential profit is unlimited.
Similarly, if you believe the stock will fall, you can buy a put option. For example, if you buy a put option at ₹950 with a premium of ₹15:
If the stock falls to ₹900, your profit = (950 - 900 - 15) = ₹35 per share.
If the stock stays above ₹950, you lose the ₹15 premium.

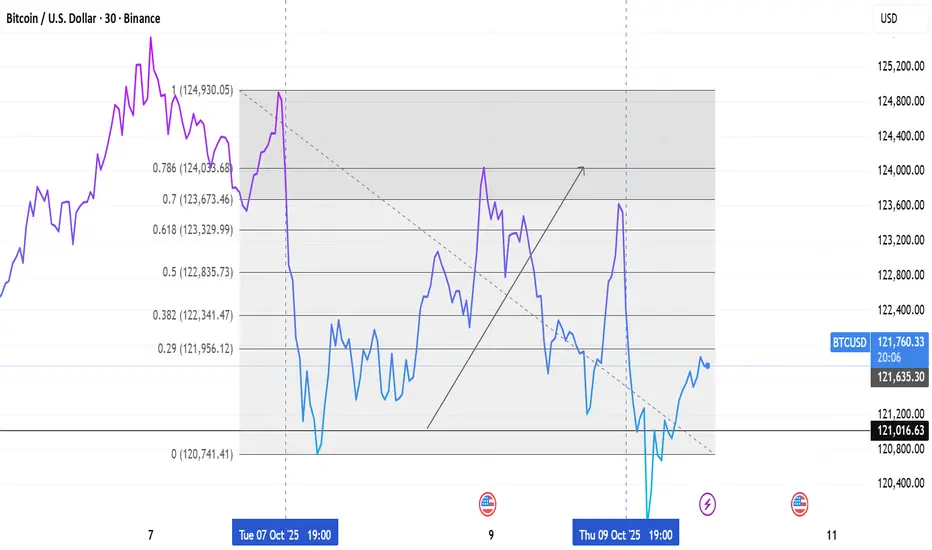
BTC/USD — Liquidity Manipulation at 19:00 IST (US Market Open)BTC/USD displayed a classic liquidity manipulation pattern around 19:00 IST, coinciding with the US market open. Price engineered a sweep above the local range high, triggering breakout liquidity before an aggressive reversal. This aligns with typical New York session behavior, where volatility expansion targets both sides of intraday liquidity zones.
The sharp rejection post-sweep indicates smart money distribution above a previous structural high, followed by a clean displacement move to the downside. The subsequent reaction near the demand zone around 121,000 reflects algorithmic re-balancing and potential accumulation after liquidity clearance.
Monitoring the 121,000–121,200 support zone is key for potential long setups if price structure shifts bullish; otherwise, failure to reclaim 122,000 may continue the short-term bearish flow.

BTC/USD — 0.786 Fibonacci Rejection Signals Distribution ZoneBitcoin (BTC/USD) retraced sharply after reaching its recent swing high near 124,930. The price action formed a clear correction toward the 0.786 Fibonacci retracement level, which acted as a strong resistance zone around 124,038. The market then reversed downward, confirming this level as a potential short-term supply area.
Currently, BTC is attempting a recovery after finding support near 120,741 (Fib 0 level). A sustained move above the 0.382–0.5 retracement range could indicate renewed bullish momentum, while rejection below 0.786 may keep the pair under pressure.
This setup highlights how the 0.786 Fibonacci retracement level serves as a key reaction point for trend continuation or reversal in the current structure.
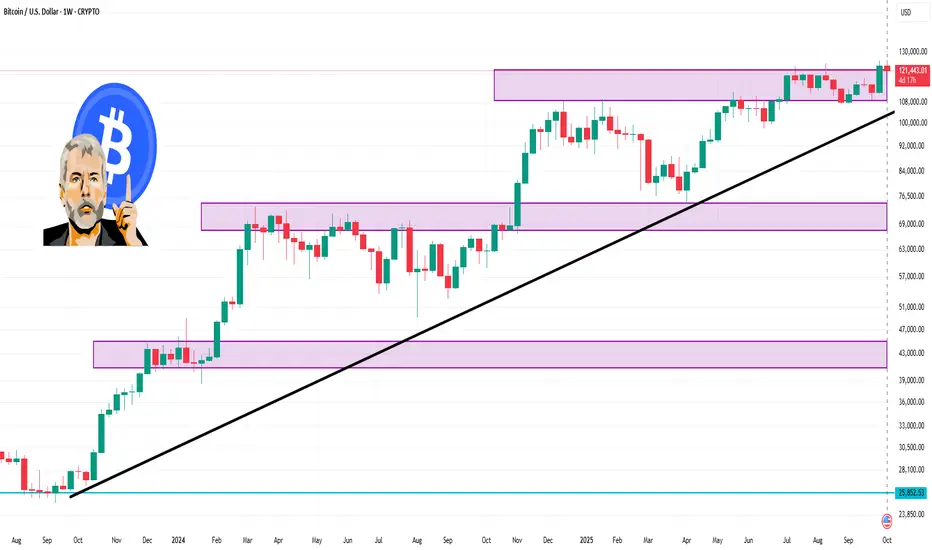
BTC against USD 1 Week Time Frame 📊 Weekly Technical Levels
Resistance Levels:
$124,652.59
$127,266.08
$129,248.44
Support Levels:
$120,056.73
$118,074.38
$115,460.88
These levels are based on Barchart's technical analysis and are derived from the most recent data available.
📈 Technical Indicators
Relative Strength Index (RSI): The RSI is currently at 61.95%, indicating that Bitcoin is neither overbought nor oversold.
Stochastic Oscillator: Both the %K and %D lines are in the 80% range, suggesting that Bitcoin is in an overbought condition, which could precede a pullback.
Average True Range (ATR): The 9-day ATR is 3,316.77, indicating a daily price movement of approximately 2.73%.
Directional Movement Index (DMI): The +DI is at 35.72, and the -DI is at 10.17, suggesting a strong bullish trend.
🔮 Market Outlook
Analysts project that Bitcoin may reach up to $126,865 within the next week, with a potential target of $129,753 over the next four weeks.
⚠️ Risk Considerations
While the long-term outlook appears bullish, it's essential to monitor key support levels. A drop below $120,000 could signal a short-term correction. Additionally, the stochastic oscillator indicates an overbought condition, which may lead to a pullback.
Investing in ESG: Shaping Profits with PurposeUnderstanding ESG Investing
ESG investing refers to the integration of three core dimensions into investment analysis and decision-making: Environmental, Social, and Governance factors. Each element provides a lens through which investors assess companies, industries, and projects, ensuring that investments contribute positively to society while also delivering sustainable financial returns.
Environmental Factors (E): This aspect evaluates how companies interact with the natural environment. Key considerations include carbon footprint, climate change mitigation, energy efficiency, resource usage, waste management, pollution control, and biodiversity conservation. Investors look for companies that proactively reduce their environmental impact, implement sustainable practices, and innovate in green technologies.
Social Factors (S): The social dimension examines how businesses manage relationships with employees, suppliers, customers, and the broader community. It encompasses labor standards, workplace diversity and inclusion, human rights, consumer protection, community engagement, and social responsibility initiatives. Companies that prioritize positive social outcomes are often seen as more resilient and trusted by stakeholders.
Governance Factors (G): Governance addresses the internal structure, policies, and practices that guide corporate behavior. This includes board composition, executive compensation, shareholder rights, transparency, ethics, anti-corruption measures, and regulatory compliance. Strong governance frameworks reduce risks associated with mismanagement, fraud, and reputational damage.
By integrating ESG factors into investment strategies, investors seek not only financial returns but also long-term sustainability, resilience, and alignment with ethical and social values.
The Growth of ESG Investing
Over the past decade, ESG investing has witnessed exponential growth. According to industry reports, global ESG assets under management (AUM) surpassed $35 trillion in 2025, reflecting a steady increase in investor demand. Several factors have driven this surge:
Global Awareness of Climate Change: Rising concerns about global warming, extreme weather events, and environmental degradation have heightened the need for sustainable investments.
Regulatory Support: Governments and regulatory bodies worldwide have introduced policies encouraging ESG disclosure and responsible investing. The European Union’s Sustainable Finance Disclosure Regulation (SFDR) and similar frameworks in the US and Asia have created transparency and accountability for ESG practices.
Investor Demand for Ethical Choices: Millennials and Gen Z, who are becoming a dominant force in wealth accumulation, prioritize sustainability and social responsibility. Their investment choices reflect a desire to create positive impact while generating returns.
Financial Performance and Risk Mitigation: Numerous studies suggest that ESG-focused companies often outperform their peers in the long term, demonstrating lower volatility, reduced risk exposure, and enhanced operational efficiency.
ESG Investment Strategies
Investors have multiple approaches to incorporating ESG principles into their portfolios. These strategies range from selective exclusion to proactive engagement:
Negative Screening: This involves excluding companies or industries that fail to meet ESG criteria. Commonly excluded sectors include tobacco, firearms, fossil fuels, and companies with poor labor practices.
Positive Screening: Investors identify companies that excel in ESG performance, emphasizing leaders in environmental stewardship, social impact, or governance practices.
Thematic Investing: This strategy focuses on specific ESG-related themes, such as renewable energy, clean technology, gender diversity, or affordable housing.
Impact Investing: Beyond financial returns, impact investing actively seeks measurable social or environmental impact. Examples include financing green infrastructure projects or supporting social enterprises.
ESG Integration: Here, ESG factors are incorporated into traditional financial analysis to assess risk and return profiles comprehensively. This approach recognizes that ESG risks can directly affect financial performance.
Active Ownership & Engagement: Investors engage with company management to encourage ESG improvements. Shareholder activism and proxy voting can influence corporate policies toward sustainability.
Benefits of ESG Investing
Long-Term Financial Performance: Companies with strong ESG practices often demonstrate operational efficiency, innovation, and risk management, leading to sustainable financial growth.
Risk Mitigation: ESG integration reduces exposure to regulatory, environmental, and reputational risks. For example, companies with robust governance frameworks are less likely to face scandals or legal penalties.
Positive Societal Impact: ESG investing aligns capital with societal goals, supporting climate action, social equality, and ethical business practices.
Attracting Capital: Companies with strong ESG ratings may attract long-term institutional investors, resulting in increased demand for shares and potentially higher valuations.
Regulatory Compliance: ESG-focused companies are better positioned to navigate evolving regulations related to environmental protection, labor laws, and corporate governance.
Challenges in ESG Investing
Despite its growth and benefits, ESG investing also faces challenges:
Data Quality and Standardization: ESG data is often inconsistent, unverified, or based on self-reported metrics. This makes comparison across companies and industries difficult.
Greenwashing Risks: Some companies exaggerate ESG achievements for marketing purposes without making substantial changes, misleading investors.
Performance Trade-offs: Critics argue that prioritizing ESG criteria may limit returns, particularly in sectors where sustainable practices are costly or less developed.
Dynamic Standards: ESG definitions and metrics are evolving, making it challenging for investors to establish clear and consistent benchmarks.
Complexity in Measuring Impact: Quantifying social and environmental outcomes can be subjective, requiring robust evaluation methods.
Global ESG Trends
The global ESG landscape continues to evolve, shaped by technological innovation, regulatory frameworks, and investor priorities:
Green Bonds and Sustainable Finance: Issuance of green bonds and sustainability-linked loans has surged, providing capital for environmentally beneficial projects.
Corporate ESG Reporting: Increasingly, companies disclose ESG metrics in annual reports and sustainability reports, often following frameworks like GRI, SASB, and TCFD.
Integration of AI and Big Data: Technology is enabling investors to analyze ESG data at scale, improving decision-making and transparency.
Cross-Border ESG Investments: Investors are increasingly seeking international opportunities in emerging markets where ESG adoption is accelerating.
Climate Risk Assessment: Physical and transition risks related to climate change are now considered integral to investment decisions, influencing asset allocation and portfolio strategies.
Practical Steps for Investors
For those looking to embrace ESG investing, several practical steps can help:
Define ESG Priorities: Determine which ESG factors align with personal or institutional values, whether environmental protection, social equity, or corporate governance.
Select Appropriate Investment Vehicles: ESG investments are available across stocks, mutual funds, ETFs, green bonds, and private equity. Choose instruments aligned with your strategy and risk tolerance.
Evaluate ESG Ratings: Use independent ESG rating agencies such as MSCI ESG Ratings, Sustainalytics, and Refinitiv to assess company performance.
Diversify ESG Portfolio: Spread investments across sectors and regions to balance risk and capitalize on growth opportunities.
Engage and Monitor: Active investors can influence corporate behavior through engagement, proxy voting, and continuous monitoring of ESG performance.
Stay Updated: ESG trends, regulations, and best practices evolve rapidly. Staying informed ensures alignment with current standards and emerging opportunities.
The Future of ESG Investing
The future of ESG investing is poised for continued growth and integration into mainstream finance. Several trends indicate this trajectory:
Mainstream Institutional Adoption: Pension funds, insurance companies, and sovereign wealth funds are increasingly integrating ESG criteria into their investment mandates.
Enhanced Regulatory Frameworks: Governments worldwide are strengthening ESG disclosure requirements and sustainable finance regulations.
Technological Innovation: AI, blockchain, and big data analytics will improve ESG data accuracy, impact measurement, and reporting transparency.
Increased Focus on Social Equity: Investors are broadening ESG considerations to include human capital development, diversity, equity, and inclusion.
Global Collaboration: International initiatives such as the UN Principles for Responsible Investment (PRI) and the Task Force on Climate-Related Financial Disclosures (TCFD) are standardizing ESG practices and encouraging cross-border investments.
Conclusion
Investing in ESG is not merely a trend; it represents a paradigm shift in how capital interacts with society and the environment. By integrating environmental, social, and governance considerations into investment strategies, investors can achieve a dual objective: generating sustainable financial returns while contributing to a healthier, fairer, and more resilient world. The growth, innovation, and regulatory momentum behind ESG investing signal that it will continue to play a central role in shaping the future of finance, ensuring that profits and purpose go hand in hand.

$BTC - Was Clean If we sweep the $125k level, we'll aim for $128k. If not, we'll first fall and sweep the $120k liquidity, then proceed toward a new ATH.

Event-Driven Earnings TradingEvent-driven earnings trading is a strategy in the financial markets that focuses on capitalizing on price movements caused by corporate events, primarily earnings announcements. Unlike traditional trend-following or technical trading, this strategy is based on analyzing how specific news, reports, or announcements affect a company’s stock price. Earnings trading is considered highly profitable but requires precise timing, strong analytical skills, and disciplined risk management.
Here’s a detailed breakdown of key elements of event-driven earnings trading:
1. Understanding Earnings Announcements
Earnings announcements are periodic reports released by publicly traded companies detailing their financial performance over a specific period, usually quarterly. Traders monitor these announcements to gauge a company's profitability, revenue growth, and future prospects.
EPS (Earnings Per Share): A critical metric showing the profit allocated to each share of stock.
Revenue vs. Expectations: Markets react not just to absolute earnings but to how they compare to analysts’ consensus estimates.
Forward Guidance: Companies often provide future forecasts, which can influence short-term and medium-term stock movements.
Key takeaway: A solid understanding of earnings reports allows traders to anticipate market reactions before they occur.
2. Pre-Earnings Analysis and Positioning
Traders often prepare well before an earnings release. Pre-earnings analysis involves:
Studying past earnings reactions to similar announcements.
Identifying patterns in volatility expansion prior to earnings.
Analyzing analyst expectations and market sentiment.
Observing options market activity for unusual trading volumes or skewed implied volatility.
Positioning strategies can include setting up directional trades if confident in the earnings outcome or hedged trades to limit risk.
3. Earnings Surprises and Market Reaction
Earnings surprises occur when the reported earnings deviate significantly from analysts’ expectations:
Positive Surprise: EPS or revenue exceeds expectations → Stock often gaps up.
Negative Surprise: EPS or revenue falls short → Stock may gap down.
The magnitude of the reaction depends on:
Market sentiment
Magnitude of the surprise
Company fundamentals and sector context
Key insight: Markets are highly sensitive to unexpected earnings outcomes, creating short-term trading opportunities.
4. Event-Driven Trading Strategies
Several approaches are employed by traders around earnings events:
Directional Bets: Taking a long or short position based on expected earnings outcome.
Straddle/Strangle Option Strategies: Buying calls and puts simultaneously to profit from volatility spikes.
Post-Earnings Momentum: Trading the continuation or reversal of price trends immediately after earnings.
Pairs Trading: Hedging exposure by trading correlated stocks when one releases earnings.
Each strategy involves balancing risk and reward while factoring in implied volatility and market sentiment.
5. Volatility Considerations
Earnings announcements often lead to high volatility:
Pre-Earnings: Volatility often rises in anticipation of the report, reflected in options prices.
Post-Earnings: A sharp drop or spike can occur depending on the surprise and market reaction.
Traders must account for implied volatility crush, a sudden decrease in options premium after earnings release. Understanding this concept is crucial for options-based strategies.
6. Risk Management in Earnings Trading
Event-driven trading carries high risk due to unpredictable market reactions. Effective risk management includes:
Setting strict stop-loss levels
Avoiding overleveraging positions
Diversifying trades across multiple earnings events
Hedging with options to limit potential losses
Maintaining discipline is essential because unexpected announcements or market sentiment shifts can lead to significant losses.
7. Tools and Data Sources
Successful earnings trading relies on real-time data and analytical tools:
Earnings Calendars: Track upcoming announcements.
Financial News Platforms: Bloomberg, Reuters, CNBC for updates.
Options Chains: Monitor implied volatility and unusual option activity.
Technical Analysis: Identify support/resistance levels for post-earnings movement.
Combining fundamental and technical insights allows traders to make informed decisions.
8. Psychology and Market Behavior
Understanding market psychology is as important as analyzing financials:
Traders react emotionally to surprises, leading to exaggerated moves.
Herd behavior can amplify short-term volatility.
Experienced traders exploit these reactions by anticipating overreactions and mean reversions.
Key takeaway: Emotional discipline and a systematic approach increase the probability of success in earnings trading.
Conclusion
Event-driven earnings trading offers traders unique opportunities to profit from corporate announcements. By combining pre-earnings analysis, strategic positioning, risk management, and psychological insight, traders can navigate the volatility and capitalize on market inefficiencies. While the potential rewards are significant, disciplined execution and robust analysis are vital to sustaining long-term profitability.
Futures and Options (F&O) in Indian Stock Market1. Introduction to F&O
Futures and Options are derivatives, which are financial contracts whose value is derived from an underlying asset such as stocks, indices, commodities, or currencies. Unlike spot market trading, where assets are exchanged immediately, derivatives provide the right or obligation to buy or sell an underlying asset at a predetermined price on a future date.
Futures Contract: A standardized agreement to buy or sell an asset at a future date at a price agreed upon today.
Options Contract: A contract that gives the holder the right, but not the obligation, to buy (Call Option) or sell (Put Option) the underlying asset at a predetermined price before or on the contract's expiry.
F&O trading is highly leveraged, allowing traders to control larger positions with smaller capital, but it also carries higher risk.
2. Components of F&O Contracts
Every F&O contract has specific components that traders must understand:
Underlying Asset: The stock, index, commodity, or currency on which the derivative is based.
Strike Price: The price at which the option can be exercised.
Expiry Date: The date on which the contract matures.
Lot Size: The minimum quantity of the underlying asset that can be traded in a contract.
Premium (for Options): The price paid to buy an option.
Settlement Mechanism: Physical delivery or cash settlement, depending on the contract type.
These components define the risk and payoff structure of F&O trades.
3. Types of F&O Instruments
In the Indian context, F&O instruments are broadly classified into:
Stock Futures and Options: Derivatives based on individual company stocks. For example, Infosys or Reliance stock futures.
Index Futures and Options: Derivatives based on market indices like Nifty 50, Bank Nifty, or Sensex.
Currency Derivatives: Based on currency pairs like USD/INR, EUR/INR.
Commodity Derivatives: Based on metals, energy products, and agricultural commodities.
Each type has its own market participants, risk profiles, and trading strategies.
4. Trading Mechanism in F&O
F&O trading happens on recognized exchanges like NSE (National Stock Exchange) and BSE (Bombay Stock Exchange) in India.
Margin-Based Trading: Traders are required to maintain a margin instead of paying the full contract value. This allows leverage but amplifies risk.
Mark-to-Market (MTM) Settlement: Daily profits and losses are adjusted in the trader’s account to reflect the market movement.
Hedging vs. Speculation: Traders can hedge existing positions in the cash market to reduce risk or speculate purely on price movements.
The trading mechanism ensures liquidity and efficient price discovery, making F&O an essential part of modern financial markets.
5. Advantages of F&O Trading
F&O trading offers several benefits:
Leverage: Control large positions with smaller capital investment.
Hedging: Protect against adverse price movements in the cash market.
Diversification: Trade in multiple asset classes like stocks, indices, commodities, and currencies.
Profit Opportunities in Both Directions: Traders can earn from rising or falling markets using futures and options strategies.
Price Discovery: F&O markets help determine the fair price of underlying assets.
Despite the advantages, F&O trading is risky and requires a clear understanding of strategies and market behavior.
6. Risks in F&O Trading
The high rewards of F&O come with significant risks:
Leverage Risk: Small market movements can result in large gains or losses.
Time Decay (for Options): Options lose value as expiry approaches if the market does not move favorably.
Volatility Risk: Sudden market swings can lead to margin calls or loss of capital.
Liquidity Risk: Some contracts may have fewer participants, making it hard to exit positions.
Effective risk management, such as stop-loss orders, position sizing, and hedging, is crucial for sustainable trading.
7. Popular F&O Strategies
Traders use various strategies depending on market conditions and risk appetite:
Hedging Strategies: Protect investments in the cash market using futures or options.
Speculative Strategies: Take leveraged positions to profit from short-term price movements.
Options Strategies:
Covered Call: Holding the underlying asset and selling call options to earn premium.
Protective Put: Buying a put option to protect against a potential drop in the asset price.
Straddles and Strangles: Profit from high volatility by buying both call and put options.
Understanding and applying strategies carefully is key to F&O success.
8. Regulatory Framework and Market Participants
F&O trading in India is regulated by the Securities and Exchange Board of India (SEBI). Key regulations include:
Position Limits: Restrictions on the maximum number of contracts one can hold.
Margin Requirements: Minimum collateral for trading F&O to mitigate systemic risk.
Settlement Procedures: Standardized processes for MTM, delivery, and expiry settlement.
Market participants include:
Retail Traders: Individual investors participating in hedging or speculation.
Institutional Investors: Mutual funds, insurance companies, and banks using F&O for portfolio management.
Proprietary Traders: Firms or individuals trading with their own capital for profit.
Arbitrageurs: Traders exploiting price discrepancies between spot and derivative markets.
Conclusion
F&O trading is a powerful tool for investors and traders seeking to leverage capital, hedge risks, and benefit from price movements in multiple asset classes. While the potential for high returns exists, it comes with significant risks that require discipline, market knowledge, and risk management skills. With the Indian F&O market growing rapidly, a strong understanding of concepts, strategies, and regulations is essential for anyone aiming to succeed in derivatives trading.
F&O is not just about speculation; it’s an integral part of modern financial markets that supports liquidity, price discovery, and risk management. For serious market participants, mastering F&O can be a game-changer in wealth creation and portfolio optimization.

Indian SME IPOs: High Rewards Amidst High RisksPart 1: Introduction to SME IPOs in India
Small and Medium Enterprises (SMEs) are the backbone of India’s economy, contributing significantly to employment, GDP, and innovation. Recognizing their importance, the Indian government and capital markets have encouraged SMEs to access public funding through Initial Public Offerings (IPOs). Unlike traditional IPOs on the main board, SME IPOs are specifically designed to allow smaller companies to raise capital efficiently while offering retail and institutional investors opportunities to participate in potentially high-growth ventures.
Definition and Characteristics of SME IPOs
SME IPOs are offerings of equity by small and medium enterprises listed on the SME segment of recognized stock exchanges, primarily the BSE SME and NSE Emerge platforms. The eligibility criteria for SMEs include:
Minimum net worth and profitability standards.
A track record of at least two years of operations.
Compliance with corporate governance standards.
SME IPOs typically have a lower investment size compared to mainboard IPOs, making them accessible to retail investors. The minimum application amount is often around ₹1–2 lakh, while the maximum may vary depending on the issue size.
Why SMEs Go Public
SMEs pursue IPOs for several reasons:
Capital for Expansion: SME IPOs provide companies with funds to expand operations, invest in new technology, or enter new markets.
Brand Visibility: Listing enhances a company’s visibility and credibility among clients, suppliers, and investors.
Liquidity and Exit Opportunities: Founders, early investors, and venture capitalists gain a structured exit route.
Attract Talent: A public listing makes it easier to offer stock options and attract skilled professionals.
Potential for High Rewards
SME IPOs are high-risk, high-reward opportunities. Unlike established companies, SMEs operate in niche markets or emerging sectors, meaning a successful IPO can yield significant returns. Historically, some SME IPOs have delivered returns of 50–200% within a year of listing, attracting speculative and growth-focused investors. However, it’s important to note that the risks are also higher, including market volatility, limited liquidity, and operational challenges.
Conclusion of Part 1
The SME IPO segment offers a unique avenue for investors seeking exposure to high-growth, smaller companies in India. With regulatory support, increasing investor awareness, and improved market infrastructure, SME IPOs are becoming a mainstream avenue for wealth creation.
Part 2: Regulatory Framework and Listing Process
The growth of SME IPOs in India has been facilitated by clear regulatory frameworks established by SEBI (Securities and Exchange Board of India) and the stock exchanges. These frameworks ensure investor protection while promoting SME participation in public markets.
SEBI Guidelines for SME IPOs
SEBI has set distinct rules for SMEs to streamline the IPO process:
Companies must have a post-issue capital of at least ₹10 crore.
Mandatory appointment of a merchant banker to manage the issue.
Submission of a prospectus detailing financials, business model, risks, and future plans.
Listing on SME platforms like BSE SME or NSE Emerge, not the mainboard initially.
The IPO Process for SMEs
The process for an SME IPO typically includes:
Appointment of Merchant Banker: To ensure compliance with SEBI regulations and guide the company through the listing process.
Preparation of Draft Prospectus: Includes financial statements, growth plans, risk factors, and use of IPO proceeds.
SEBI Approval: Draft prospectus is submitted to SEBI for review and approval.
Pricing and Marketing: The IPO can be priced via fixed price or book-building route. SMEs often use book-building to determine fair value.
IPO Launch and Subscription: Investors, including retail and institutional, subscribe to the shares during the IPO period.
Listing: Once shares are allotted, they get listed on SME platforms, enabling trading and liquidity.
Investor Protection Measures
Despite being high-growth, high-risk investments, SME IPOs incorporate measures for investor protection:
Disclosure of risk factors and financials.
Requirement of a market maker to maintain liquidity.
SEBI guidelines for lock-in periods for promoters, reducing the risk of sudden sell-offs.
Conclusion of Part 2
A strong regulatory framework ensures transparency, investor confidence, and orderly growth of the SME IPO market. Understanding this framework helps investors evaluate the potential risks and rewards before committing capital.
Part 3: Factors Driving High Returns in SME IPOs
High returns in SME IPOs are driven by a combination of market dynamics, company fundamentals, and investor sentiment.
1. Growth Potential of SMEs
Many SMEs operate in emerging sectors such as technology, renewable energy, healthcare, and specialty manufacturing. These sectors have higher growth potential compared to mature industries, making them attractive for investors seeking exponential returns.
2. Market Inefficiencies and Speculation
SME stocks often have lower liquidity, creating price inefficiencies. Early investors who identify strong companies can benefit from rapid price appreciation after listing.
3. Promoter Credibility and Track Record
A promoter’s experience, credibility, and operational success significantly influence investor confidence. Companies with visionary leadership tend to perform better post-IPO, often rewarding early investors.
4. Favorable Economic Conditions
Macroeconomic factors like GDP growth, low interest rates, and government incentives for SMEs can amplify returns. For instance, policies promoting Make in India or technology adoption can increase SME valuations.
5. Undervalued Offerings
SME IPOs often carry lower valuations compared to mainboard companies. Investors with careful fundamental analysis can identify undervalued opportunities poised for growth.
6. Role of Market Makers
BSE and NSE mandate market makers for SME stocks, ensuring continuous buying and selling, which can reduce volatility and provide price support during initial trading days.
Conclusion of Part 3
High returns in SME IPOs are a result of the interplay between intrinsic company value, sector growth potential, market sentiment, and regulatory mechanisms. However, investors must exercise caution and due diligence to avoid speculative pitfalls.
Part 4: Risks and Challenges in Investing in SME IPOs
While SME IPOs promise high rewards, they are accompanied by unique risks that investors must understand.
1. Limited Operational Track Record
SMEs often have shorter business histories. Any operational misstep, market slowdown, or competitive threat can significantly impact profitability and share price.
2. Lower Liquidity
SME stocks trade on smaller platforms with fewer participants, leading to thin order books. This can result in higher price volatility and difficulty in exiting positions quickly.
3. Market Volatility
SME IPOs are more sensitive to broader market swings. Even positive company performance may not prevent stock prices from falling during bearish market conditions.
4. Regulatory and Compliance Risks
Although SEBI regulates SME IPOs, non-compliance, reporting delays, or governance lapses can affect investor confidence and share performance.
5. Sector-Specific Risks
Many SMEs operate in niche sectors that may face rapid technological changes, policy shifts, or demand fluctuations, affecting long-term sustainability.
6. Overvaluation at Listing
Due to hype, some SME IPOs may be overpriced relative to fundamentals, exposing investors to short-term losses post-listing.
Risk Mitigation Strategies
Diversification: Avoid concentrating capital in one SME IPO.
Fundamental Analysis: Study financials, business model, and growth prospects.
Monitor Market Maker Activity: Ensure liquidity support is sufficient.
Long-Term Perspective: SME IPOs often perform better over 1–3 years than in the immediate post-listing period.
Conclusion of Part 4
Understanding risks is critical for balancing potential high rewards. While SME IPOs can deliver significant returns, careful due diligence, prudent investment size, and long-term perspective are essential to mitigate inherent risks.
Part 5: Strategies for Successful Investment in SME IPOs
Investors can maximize rewards from SME IPOs by combining research, timing, and portfolio management strategies.
1. Identifying Promising SMEs
Focus on companies with:
Strong fundamentals and consistent revenue growth.
Experienced promoters with proven track records.
Products or services in emerging or high-demand sectors.
2. Timing and Market Sentiment
Investors should monitor:
IPO subscription trends: Oversubscription indicates strong demand.
Market conditions: Bullish markets often favor strong listing gains.
Listing day performance and early trading trends for post-IPO opportunities.
3. Diversification Across Sectors
Investing in multiple SME IPOs across different industries reduces sector-specific risk and increases chances of capturing high-growth opportunities.
4. Leveraging Advisory Services
Merchant bankers, financial analysts, and SEBI-registered advisors can provide insights into valuation, risk factors, and listing prospects.
5. Long-Term Investment Approach
While short-term gains are possible, many SME IPOs achieve substantial growth over 1–3 years. Investors focusing on long-term growth can benefit from compounding returns and company expansion.
6. Monitoring Post-Listing Performance
After listing, track:
Quarterly financial results.
Market share growth and competitive positioning.
Promoter activity and adherence to corporate governance.
7. Exit Strategies
Plan exits based on valuation targets or fundamental deterioration. Avoid panic selling during short-term market volatility.
Conclusion of Part 5
SME IPOs represent a compelling opportunity for investors willing to take calculated risks. By combining careful research, diversification, long-term vision, and active monitoring, investors can participate in India’s growth story and potentially achieve high rewards from the SME IPO segment.
Overall Conclusion
Indian SME IPOs are a vibrant, high-potential segment that balances risk with opportunity. Regulatory support, growth potential, and market mechanisms make it possible for investors to reap significant rewards, provided they adopt disciplined investment strategies. By understanding the nuances, risks, and strategies discussed, investors can confidently navigate the SME IPO landscape in India.

Part 2 Ride The Big MovesIntroduction
Financial markets have evolved significantly over the last century, offering a wide variety of instruments to investors and traders. One such instrument is options, which provide flexibility, leverage, and hedging opportunities. Unlike straightforward investments such as stocks or bonds, option trading involves contracts that derive their value from an underlying asset—making them part of the broader derivatives market.
For professional traders, options are indispensable for hedging risk, generating income, and leveraging market moves. For retail participants, they represent both a fascinating opportunity and a high-risk tool that requires discipline and knowledge.
This guide explains option trading in detail, starting from the basics and moving into advanced strategies, risks, and practical applications.

Bitcoin – Let’s Play the Resistance Game at 114,500Bitcoin on the 1-hour chart has entered a critical resistance zone around 114,200–114,500. Price has rallied strongly from the recent lows near 113,000, but now faces a major supply area. The structure suggests that BTC could face rejection here and move back toward the support zone near 112,600 if sellers step in.
As long as price stays below 114,500, this resistance remains valid. A clean breakout above this level with strong momentum would invalidate the bearish view and open the path for higher levels. On the downside, holding support near 112,600 will be key for buyers to maintain control.
Disclaimer: This analysis is for educational purposes only and should not be taken as financial advice. Please do your own research or consult your financial advisor before investing.
Analysis By @TraderRahulPal (TradingView Moderator) | More analysis & educational content on my profile
👉 If you found this helpful, don’t forget to like and follow for regular updates.

September 29 Bitcoin Bybit chart analysisHello
It's a Bitcoin Guide.
If you "follow"
You can receive real-time movement paths and comment notifications on major sections.
If my analysis was helpful,
Please click the booster button at the bottom.
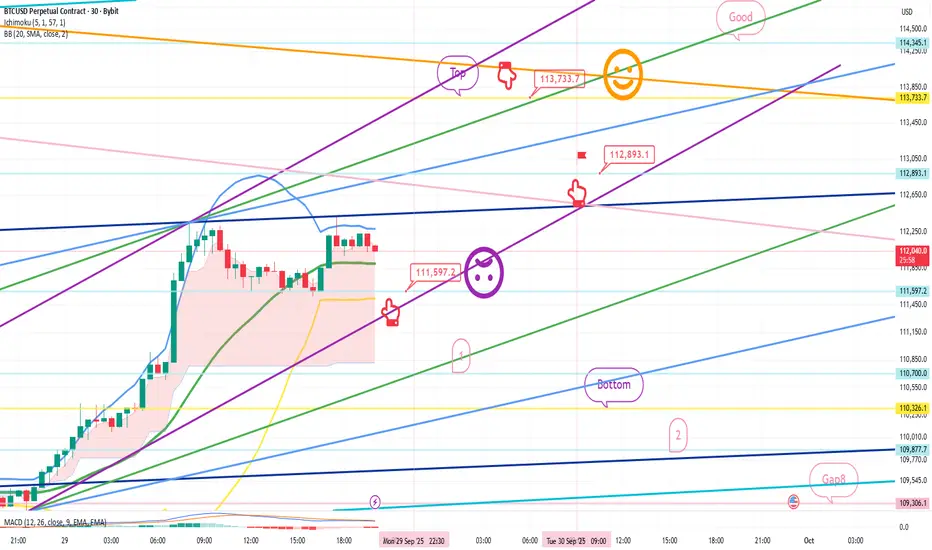
This is a Bitcoin 30-minute chart.
There are no Nasdaq indicators released today.
I developed a strategy based on the rising pattern.
*Red finger movement path:
One-way long position strategy
1. $111,597.2 long position entry point / Stop loss if the purple support line is broken
2. $113,733.7 long position first target -> Good second target
If the strategy is successful, the 112,8K level indicated
can be used as a long position re-entry point.
Up to the first section below, the price is moving sideways to the right.
From the bottom section touch, there's a high probability of a decline to the Gap 8 retracement level.
Please check the bottom support line and section 2 indicated below.
Up to this point,
I ask that you use my analysis for reference only.
I hope you operate safely, with a focus on principled trading and stop-loss orders.
Thank you.
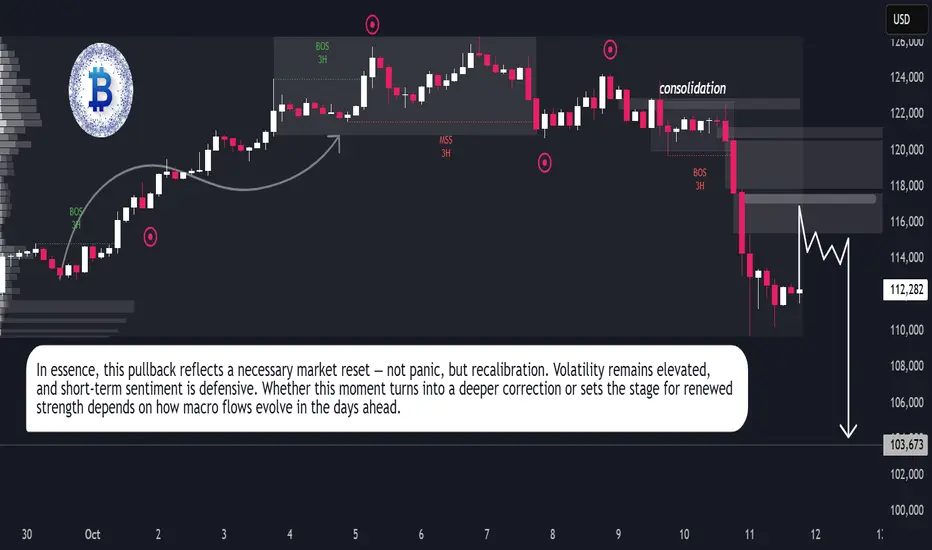
BTC Market Update – Bullish Trend RebuildingBTC Market Update – Bullish Trend Rebuilding
The market structure on Bitcoin highlights a sequence of expansion, consolidation, and sharp corrective phases. After reaching a peak around 115,000, the price shifted into a prolonged sideways phase, where liquidity built up before a decisive breakdown. This breakout introduced stronger bearish momentum, driving price toward lower ranges.
Currently, Bitcoin is stabilizing around 109,500 after the decline, with price action suggesting a potential extension into deeper liquidity zones near the lower range before regaining upward momentum. The projected flow reflects a scenario where downside movement acts as a liquidity sweep, providing the conditions for buyers to re-engage.
The broader outlook remains constructive. Even with short-term pressure favoring the downside, the long-term structure still supports recovery potential. A strong reaccumulation phase could lift Bitcoin back toward the 115,000 zone, aligning with the market’s tendency to reclaim imbalance after periods of sharp displacement.

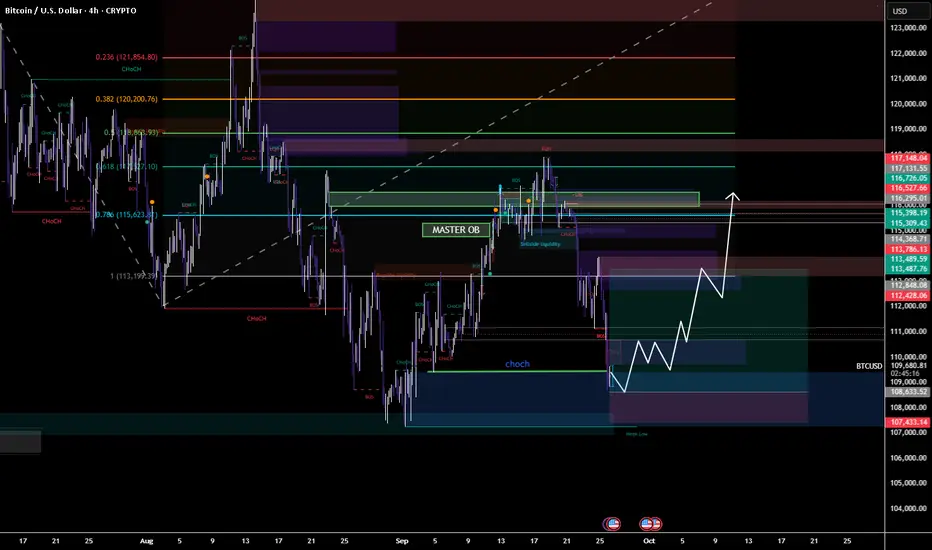
BTC Bulls Eyeing a Reversal From Liquidity SweepBTC Bulls Eyeing a Reversal from Liquidity Sweep”
📌 Description:
Bitcoin swept downside liquidity near 108k, tapping into a demand zone. If this level holds, expect a strong recovery toward the 113.5k–116.5k supply zones, with the Master OB acting as a key magnet for price.
📈 Trade Plan (4H BTCUSD)
🔹 Entry Zone (Long):
108.0k – 109.0k (liquidity sweep + demand zone).
🔹 Stop Loss (SL):
Below 107.0k (weak low / invalidation).
🔹 Take Profit (TP):
TP1: 112.4k (minor FVG close)
TP2: 113.8k – 114k (OB retest zone)
TP3: 115.5k – 116.2k (major supply / Master OB)
🎯 Risk-to-Reward (approx):
Entry: 108.5k
SL: 107k (≈ -1.5k / -1.3%)
TP1: 112.4k (≈ +3.9k / +3.6%) → RR ≈ 1:2.7
TP2: 114k (≈ +5.5k / +5%) → RR ≈ 1:3.8
TP3: 116.2k (≈ +7.7k / +7.1%) → RR ≈ 1:5.2
⚡ Clean long setup: liquidity sweep → bullish CHoCH → push into OB/supply above.
Cryptocurrency : The New Normal & The World of Leverage Trading.📌 Cryptocurrency: The New Normal & The World of Leverage Trading ⚔️ ( A Sweet Killer! )
🌍 Why Are Traders Shifting to Crypto? COINBASE:BTCUSD BITSTAMP:ETHUSD COINBASE:SOLUSD
✔️ Lower capital required compared to stocks
✔️ Fewer gaps (24/7 market = no overnight gap-up/down shockers)
✔️ High leverage opportunities (control bigger trades with smaller margin)
✔️ Global accessibility (Binance, Bybit, OKX, CoinDCX, Mudrex etc.)
📊 Types of Trading in Crypto
💠 **Spot Trading** → In India, 30% tax on capital gains ( check according to your country ).
💠 **Options & Futures** → Taxed as *Business Income* ( like F&O in stocks ). No flat 30% rule.
⚡ What is Leverage?
👉 Leverage means using *small capital* to control a *large trade size* , because the exchange lends you money.
Think of it like **margin trading** in stocks — but much more aggressive.
🔹 Example 1 : Normal Trade style ( No Leverage )
suppose you have 💰 Capital = ₹10,000
Bought BTC at Price = ₹10,000,000
* You can buy 0.001 BTC ( 10000 ➗ 10,000,000 ).
* If BTC rises 10% → Profit = ₹1,000 (+10%)
* If BTC falls 10% → Loss = ₹1,000 (-10%)
👉 Risk & reward move in proportion to your capital.
🔹 Example 2 : Leverage Trade style ( 10x Leverage )
suppose you have 💰 Capital = ₹10,000
opted Leverage = 10x
New Trade Size ( margin ) = ₹1,00,000 ( you can now utilize this margin amount for trading )
* You can buy 0.01 BTC ( 10000 ➗ 10,000,000 ).
* If BTC rises 10% → Profit = ₹10,000 (+100% return)
* If BTC falls 10% → Loss = FULL ₹10,000 ( Liquidation 🚨 )
👉 A 10% move = your account will be blown.
🔹 Example 3:
suppose you have 💰 Capital = ₹10,000
opted Leverage = 50x (Extreme ⚠️)
New Trade Size ( margin ) = ₹5,00,000 ( you can now utilize this margin amount for trading )
* You can buy 0.05 BTC ( 50000 ➗ 10,000,000 ).
* If BTC rises just 2% → Profit = ₹10,000 (+100% return)
* If BTC falls just 2% → FULL ₹10,000 loss ( Liquidation 🚨 )
* If BTC rises just 10% → Profit = ₹50,000 (+500% return)
* If BTC falls just 10% → FULL ₹10,000 loss ( Liquidation 🚨 )
👉 Tiny moves in high volatile asset class = jackpot or wipeout/blown.
⚔️ Key Takeaways :
1️⃣ Leverage multiplies profits 💸 but also multiplies losses too💀 ( a sweet killer! )
2️⃣ Crypto is *highly volatile* (10–20% daily moves are common) → High leverage is extremely risky, if not managed well.
3️⃣ Beginners should **never use more than 2x–3x leverage**
👉 In simple words: **Leverage is a double-edged sword ⚔️**
Used wisely → You’re a king 👑
Used recklessly → You’re broke 🥀
🚘 Liquidation Explained ( ex: Car Analogy )
Imagine you pay ₹10,000 to rent a car worth ₹1,00,000. (That’s 10x leverage).
* The car is in your hands, but ₹90,000 still belongs to the owner of car (exchange).
* If the damage goes beyond your ₹10,000 margin → the owner takes back the car immediately.
👉 That’s liquidation: when your loss = your margin.
🔹 Case 1: Normal Trade style ( No Leverage )
Margin = ₹10,000 → Buy BTC.
If BTC drops 10% → Loss = ₹1,000.
You still have ₹9,000 left.
✅ No liquidation. Just a normal loss.
🔹 Case 2: 10x Leverage Trade style
Margin = ₹10,000
New Trade Size ( margin ) = ₹1,00,000
* BTC rises 10% → Profit = ₹10,000 (+100%)
* BTC falls 10% → Margin wiped = Liquidation 🚨
🔹 Case 3: 20x Leverage Trade style
Margin = ₹10,000
New Trade Size = ₹2,00,000 ( margin )
* BTC rises 5% → Profit = ₹10,000 (+100% return)
* BTC falls 5% → Margin wiped = Liquidation 🚨
👉 Just 5% against you = Account gone.
🔹 Case 4: 50x Leverage Trade style (High-Risk Zone ⚠️)
Margin = ₹10,000
New Trade Size = ₹5,00,000 ( margin )
* BTC rises 2% → Profit = ₹10,000 (+100% return)
* BTC falls 2% → FULL ₹10,000 loss = Liquidation 🚨
👉 Just 2% against you = Blown account = Game over.
🎯 Final Word
Leverage = Power ⚡
But in crypto’s volatile world, it’s also a **trap for the impatient**.
* Smart traders use small leverage.
* Impulsive traders burn out with high leverage.
💬 Question for you: What’s the **highest leverage** you’ve ever used in a trade? Drop it below 👇 (Be honest—we’ve all been tempted!)
If this Idea gave you a value information then please, Boost it, share your thoughts in comments, and follow for more practical trading!
Happy Trading & Investing!
@TradeWithKeshhav and team

Divergence SecretsPart 1: Factors Affecting Option Pricing
Option pricing is dynamic, influenced by multiple factors:
1. Intrinsic Value
Difference between underlying price and strike price.
2. Time Value
Longer time to expiry = higher premium due to uncertainty.
3. Volatility
Higher volatility increases probability of profit → higher premium.
4. Interest Rates
Affects call and put pricing slightly, more relevant in long-term options.
5. Dividends
Expected dividend reduces call price but increases put price.
Popular Models:
Black-Scholes Model: Pricing for European options.
Binomial Model: Pricing for American options.
Part 2: Option Strategies for Beginners
Beginners can start with simple strategies:
Long Call: Buy call, bullish view, limited risk.
Long Put: Buy put, bearish view, limited risk.
Covered Call: Own stock + sell call → generate income, moderate risk.
Protective Put: Own stock + buy put → hedge downside.
Tip: Always define your risk and target before trading.
Part 3: Advanced Option Strategies
For experienced traders, multi-leg strategies can maximize returns:
Straddle: Buy call + buy put (same strike & expiry) → profit from volatility.
Strangle: Buy OTM call + OTM put → cheaper than straddle, still bets on volatility.
Vertical Spread: Buy & sell calls (or puts) at different strikes → limit risk & reward.
Iron Condor: Sell OTM call + buy further OTM call, sell OTM put + buy further OTM put → profits in range-bound markets.
Butterfly Spread: Combine calls or puts to profit near a strike price with limited risk.
Key: Advanced strategies reduce risk or cost but require precise market view.
Part 4: Risk Management in Option Trading
Options are powerful but risky. Effective risk management is critical:
Limited vs Unlimited Risk: Buyers have limited loss (premium), sellers can face unlimited loss.
Position Sizing: Never risk more than 1–2% of trading capital on a single trade.
Hedging: Use protective puts or spreads to reduce downside.
Stop Loss: Predefine maximum loss.
Volatility Awareness: High IV → expensive options; low IV → cheap options.
Part 5: Option Trading in Indian Markets
In India, NSE (National Stock Exchange) is the primary platform. Key points:
Instruments: Nifty, Bank Nifty, Stocks (F&O).
Lot Size: Defined per contract; standard for indices & stocks.
Expiry: Weekly, monthly, quarterly.
Regulation: SEBI regulates, ensures margin & settlement rules.
Example:
Nifty current level: 25,000
Buy Nifty 25,100 CE (call)
Lot size: 50 → Pay premium × 50
Settlement:
Cash-settled for indices.
Physical delivery possible for stock options.
Part 6: Tips for Success in Option Trading
To trade options successfully:
Learn Before Trading: Understand Greeks (Delta, Gamma, Theta, Vega, Rho).
Start Small: Focus on a few stocks or indices.
Track Volatility: Higher IV → cautious buying.
Plan Exits: Define profit and loss targets.
Diversify Strategies: Mix spreads, protective puts, and hedges.
Stay Updated: News, earnings, and macro events affect premiums.
Paper Trade: Practice virtual trading before risking real capital.
Mindset: Option trading is about probability, not certainty. Patience and discipline are key.

Energy Trading and Geopolitics1. Introduction to Event-Driven Trading
Event-driven trading is a subset of fundamental trading strategies that react to specific corporate or macroeconomic events. These events create temporary inefficiencies in the market, which traders attempt to exploit. Unlike long-term investing, which focuses on company fundamentals and growth, event-driven trading is short-term and opportunistic, leveraging price volatility around events.
Key Characteristics:
Trades are short-term, typically lasting hours to days around an event.
High volatility is expected around the event.
Requires pre-event analysis to predict likely outcomes.
Risk is event-specific, rather than market-specific.
2. Earnings Announcements: The Core Event
Earnings announcements are the public disclosure of a company’s financial performance over a given period, usually a quarter. They include metrics such as:
Revenue
Earnings per share (EPS)
Net income
Guidance for future performance
Importance for Traders:
Earnings reports are highly market-sensitive events, often causing large price swings.
The market reacts not just to actual numbers, but also to expectations vs reality.
Earnings Reaction Components:
Surprise Effect – The difference between reported earnings and analyst expectations.
Guidance Effect – Future outlook provided by the company.
Market Sentiment – How traders interpret the news relative to broader market conditions.
3. Types of Event-Driven Earnings Trading Strategies
Event-driven earnings trading can be divided into several approaches:
3.1. Pre-Earnings Positioning
Traders take positions before the earnings release based on expected outcomes.
Bullish Pre-Earnings Trade: Buy a stock anticipating strong earnings.
Bearish Pre-Earnings Trade: Short a stock expecting disappointing results.
Tools Used:
Historical earnings data
Analyst consensus estimates
Options implied volatility
Risks:
Surprise moves can result in rapid losses.
Unanticipated market reactions to guidance or macro news.
3.2. Post-Earnings Reaction Trading
Traders react immediately after the earnings announcement.
Buy the Rumor, Sell the Fact: Stocks often overreact to news.
Momentum Plays: Riding the initial surge after positive surprises.
Mean Reversion Plays: Betting that overreaction will correct itself.
Tools Used:
Real-time news feeds
Trading platforms with low latency
Volatility analysis
Risks:
Sudden reversal after initial move.
Liquidity issues if the stock gaps significantly.
3.3. Options-Based Earnings Strategies
Options provide ways to trade earnings with defined risk.
3.3.1. Straddle
Buy both a call and put at the same strike.
Profits from high volatility, regardless of direction.
Risk is limited to premium paid.
3.3.2. Strangle
Buy out-of-the-money call and put.
Cheaper than straddle but requires bigger moves to profit.
3.3.3. Iron Condor
Sell out-of-the-money call and put while buying farther OTM options.
Profits if stock remains within a range.
Strategy bets on low volatility post-earnings.
3.4. Pair and Relative Performance Strategies
Trading two related stocks to profit from earnings mispricing.
Example: Buy outperformer, short underperformer in same sector.
Reduces market-wide risk, isolates company-specific reactions.
4. Key Factors to Consider Before Earnings Trading
Earnings Expectations
Compare consensus estimates vs historical performance.
Understand market sentiment and analyst revisions.
Volatility
Stocks often exhibit high implied volatility before earnings.
Option premiums increase, providing trading opportunities.
Liquidity
Ensure stock or options have sufficient trading volume.
Avoid illiquid stocks to reduce slippage risk.
Historical Patterns
Some companies have predictable post-earnings moves.
Analyze seasonal patterns and sector behavior.
Macro Environment
Broader market conditions can amplify or dampen earnings reactions.
Example: Interest rate announcements, geopolitical news.
5. Risk Management in Event-Driven Earnings Trading
Event-driven earnings trading carries unique risks due to high volatility and uncertainty.
5.1. Pre-Event Risks
Unexpected Results: Missing analyst expectations can trigger sharp declines.
Volatility Crush: Post-earnings implied volatility often drops, reducing option premiums.
5.2. Post-Event Risks
Gaps and Slippage: Overnight gaps can bypass stop-loss orders.
False Momentum: Initial spikes may reverse quickly.
5.3. Hedging Techniques
Use options to limit downside.
Trade pairs or sector spreads to reduce market exposure.
Scale positions gradually to manage risk.
6. Tools and Platforms for Earnings Trading
Trading Platforms
Real-time order execution
Earnings calendars and alerts
News Feeds
Bloomberg, Reuters, or market-specific news aggregators
Twitter feeds of analysts for sentiment
Analytics Software
Implied volatility tracking
Earnings surprise calculators
Option strategy simulators
Backtesting Platforms
Historical earnings data analysis
Strategy testing under various market conditions
7. Case Studies and Examples
Example 1: Apple Inc. (AAPL)
Pre-Earnings Trade: Expecting strong iPhone sales → bought calls.
Outcome: Positive earnings beat → stock jumped 6% → profit realized.
Lesson: Pre-event positioning can be profitable if market consensus aligns.
Example 2: Tesla Inc. (TSLA)
Post-Earnings Reaction Trade: Tesla missed delivery targets → stock dropped.
Strategy: Shorted the initial momentum → profit from the decline.
Lesson: Quick post-event reactions can exploit overreactions.
Example 3: Options Straddle
Stock: Netflix
Scenario: High uncertainty before earnings
Action: Buy straddle to profit from a large move in either direction.
Outcome: Stock surged → call gained, put lost → net profit exceeded risk.
8. Behavioral Aspects and Market Psychology
Market reactions to earnings often deviate from rational expectations due to:
Herd Behavior: Traders following momentum.
Anchoring: Overemphasis on prior earnings trends.
Confirmation Bias: Ignoring contrary signals.
Understanding these psychological factors can give traders an edge.
9. Regulatory and Reporting Considerations
Insider Trading Rules: Avoid trading on non-public material information.
Earnings Manipulation Awareness: Watch for red flags in financial reports.
Disclosure Compliance: Ensure strategies do not violate SEC or local regulations.
10. Conclusion
Event-driven earnings trading is a sophisticated strategy that requires both fundamental and technical analysis skills. By focusing on corporate events like earnings announcements, traders can exploit short-term volatility and market inefficiencies. Successful execution involves:
Detailed pre-event research
Effective risk management
Rapid execution and monitoring
Understanding market psychology
Using options and hedging strategies wisely
When practiced diligently, earnings trading can become a powerful tool in a trader’s arsenal, offering consistent opportunities in an otherwise efficient market.
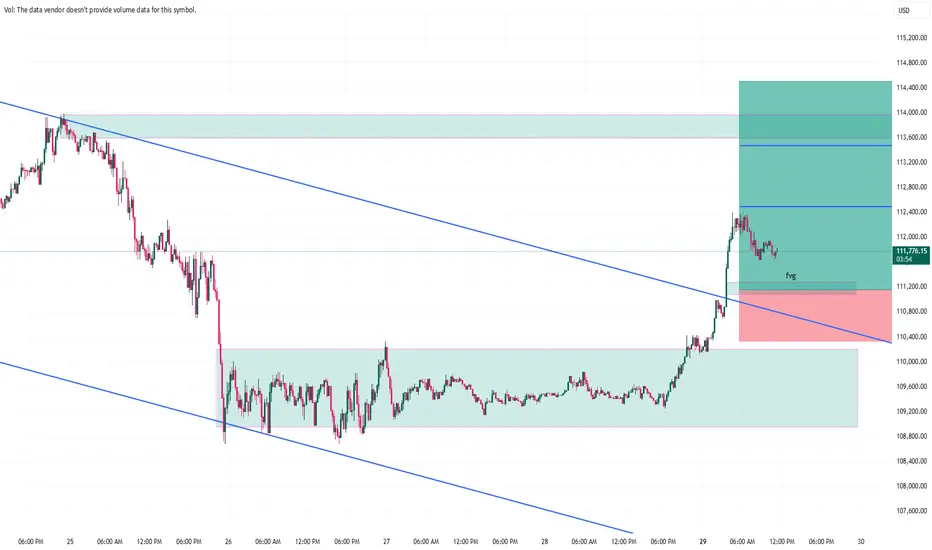
Title: BTCUSD – Breakout from Falling Channel | Long SetupDescription:
Bitcoin has broken out of the falling channel with strong bullish momentum.
✅ Clean breakout from the downtrend structure
✅ Retest of the breakout level showing support
✅ Long position aligned with bullish continuation
Bias: Bullish as long as price holds above the channel breakout level.
Note: This is not financial advice. Please do your own research and manage risk accordingly.
BITCOIN Neowave ForecastNamaskaram
Watch the video to understand my view...
following instruments Discussed in the video...
#XAUUSD
#BTCUSD
#NIFTY 50
#BANK NIFTY
FX:XAUUSD OANDA:XAUUSD COINBASE:BTCUSD

