Part 7 Trading Master Class1. Introduction to Options Trading
Options are one of the most fascinating financial instruments in the market because they allow traders to speculate, hedge, and manage risks in creative ways. Unlike buying and selling shares directly, options give you the right but not the obligation to buy or sell an asset at a predetermined price within a specified period. This flexibility makes options extremely powerful.
However, with power comes responsibility. Options trading is not as straightforward as buying a stock and waiting for its price to go up. Options involve multiple variables—time decay, implied volatility, strike prices, and premiums—that all influence profit and loss. For this reason, traders develop strategies that balance risk and reward depending on their market outlook.
Option trading strategies range from simple ones—like buying a call when you expect a stock to rise—to very advanced ones—like iron condors or butterflies, where you combine multiple contracts to profit from stable or volatile markets.
In this guide, we’ll explore the most widely used option trading strategies, explaining how they work, when to use them, and their advantages and risks.
2. Understanding Options Basics
Before diving into strategies, let’s understand the core building blocks of options:
Call Option
A call option gives the buyer the right to buy an asset at a fixed strike price within a given time frame.
Example: You buy a call option on Reliance at ₹2,500 strike for a premium of ₹50. If Reliance rises to ₹2,600, you can exercise the option and profit.
Put Option
A put option gives the buyer the right to sell an asset at a fixed strike price within a given time frame.
Example: You buy a put option on Infosys at ₹1,500 strike for a premium of ₹40. If Infosys falls to ₹1,400, you can sell it at ₹1,500, earning profit.
Key Terms in Options
Strike Price: The fixed price at which you can buy/sell the asset.
Premium: The cost you pay to buy the option.
Expiry Date: The last date the option is valid.
In the Money (ITM): When exercising the option is profitable.
At the Money (ATM): When strike price ≈ current price.
Out of the Money (OTM): When exercising the option is not profitable.
3. Why Use Options?
Options are not just for speculation—they serve multiple purposes:
Hedging – Investors use options to protect against unfavorable price moves. Example: Buying puts to protect a stock portfolio against a market crash.
Income Generation – By writing (selling) options like covered calls or cash-secured puts, traders collect premiums and generate consistent income.
Leverage – Options allow control of large stock positions with small capital. For example, buying one call contract is cheaper than buying 100 shares of the stock outright.
Speculation – Traders can take directional bets with limited risk. Example: If you expect volatility, you might use straddle or strangle strategies.
Flexibility – Unlike stocks, options allow you to profit in bullish, bearish, or even sideways markets, depending on the strategy.
BTCUSD.PI trade ideas

Gold & BitCoin (Neowave Forecast)Namaskaram Everyone
Welcome to intelligent investor, we provide market insights by synchronising and combining all the price action waves from different time frames and gives you single trend.
How To Read My Charts...Click Below

Bitcoin Bybit chart analysis September 23Hello
It's a Bitcoin Guide.
If you "follow"
You can receive real-time movement paths and comment notifications on major sections.
If my analysis was helpful,
Please click the booster button at the bottom.
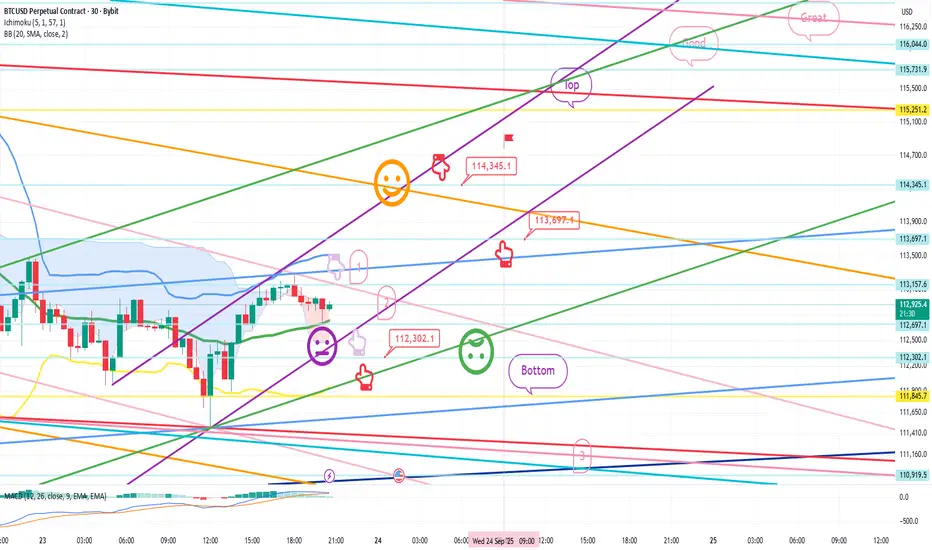
This is Bitcoin's 30-minute chart.
There's an indicator release near 11:00 AM on the Nasdaq,
and I expected a small fluctuation.
I proceeded as safely as possible, considering the current situation.
*When the red finger moves,
One-way long position strategy:
1. Long position entry point at $112,302.1 / Stop loss price if the green support line is broken.
2. Long position initial target at $114,345.1 -> Target prices in order of Top, Good, Great.
After reaching the target price of $114.3K,
you can re-enter the long position at the indicated price of $113.6K.
In the case of 1->2 above,
there's a strong possibility of an upward movement along the purple parallel line. (The 5+15 pattern is still in place.)
The current rebound has already formed a double bottom,
so a drop below the bottom
is not a good move for long positions.
In case of a delay, I've indicated up to section 3 at the bottom.
Thanks to the recent interest from newcomers,
I've made this post publicly available for the first time in a while.
Please use my analysis for reference only.
I hope you operate safely, with a focus on principled trading and stop-loss orders.
Thank you.
btcusdThe live Bitcoin price today is $112591.42 USD with a 24-hour trading volume of $48834864079.08 USD. We update our BTC to USD price in real-time.
$1,12,588.40

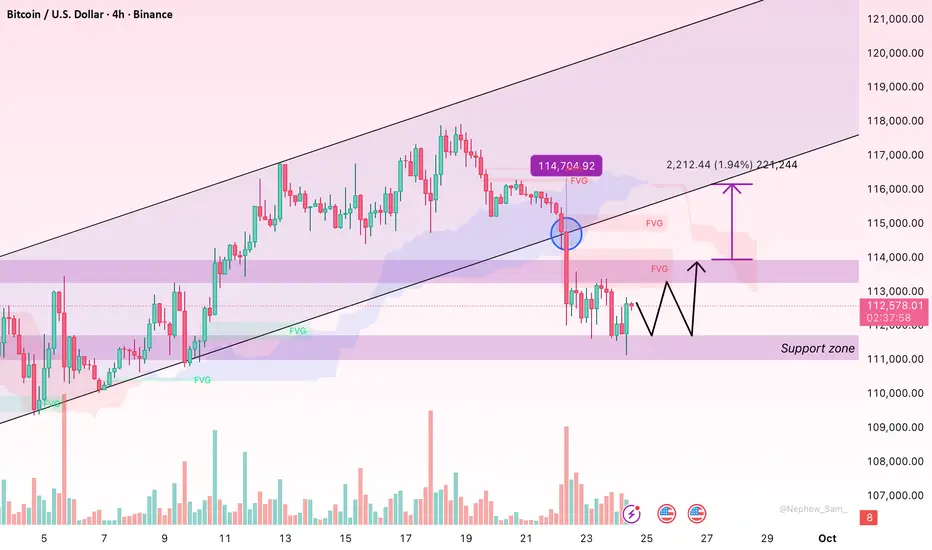
Bitcoin : Short-Term Pullback, Underlying Trend Still PositiveHello everyone,
After reaching the 113,000 USD zone, Bitcoin has seen a short-term correction, but overall the main trend remains intact. On the chart, price action is still trading above the Ichimoku cloud, which serves as a key support area in the event of deeper pullbacks. Fair Value Gaps around 111,000–112,000 USD also act as “stepping stones” for potential retests before price continues higher. Meanwhile, trading volume has eased during this retracement, indicating that this is not a case of capitulation selling, but rather a pause following the strong rally.
From a news perspective, the Federal Reserve continues to maintain high interest rates in an effort to control inflation, yet this has further strengthened Bitcoin’s appeal as an alternative hedge against the US dollar. At the same time, institutional involvement is becoming more evident: MicroStrategy, Tesla, and particularly BlackRock’s push for a Bitcoin ETF are all adding weight to long-term confidence. Against the backdrop of ongoing global uncertainty and persistent banking risks, Bitcoin’s role as “digital gold” stands out even more.
As long as the 111,000–112,000 USD support zone holds, the scenario of breaking above 113,000 and advancing towards 115,000 and even 120,000 USD remains highly likely.
Trade Management: From Entry to Exit1. Understanding Trade Management
Trade management is the systematic process of monitoring, adjusting, and executing trades once a position is initiated. It’s about controlling risk, optimizing profits, and maintaining emotional discipline throughout the lifecycle of a trade. While strategy often focuses on identifying opportunities, trade management emphasizes what happens after you act on a signal.
Key Objectives of Trade Management:
Protect capital from adverse market movements.
Capture maximum potential profits from favorable moves.
Reduce emotional bias and impulsive decision-making.
Maintain consistency across multiple trades.
Trade management is not about predicting the market perfectly but responding effectively to changing conditions. Even the best entry signal can fail without proper management.
2. Pre-Trade Considerations
Effective trade management starts before entering a trade. Planning your trade, even for a few seconds, sets the stage for disciplined execution.
a. Risk Assessment
Risk assessment is the foundation of trade management. A trader must calculate:
Position size: How much capital to allocate.
Maximum acceptable loss: Typically a small percentage of your trading account (1–3% per trade).
Volatility: Understanding how much the market might move against you.
For instance, if a stock trades at ₹500 and you’re willing to risk ₹10 per share with ₹50,000 capital, your position size would be calculated based on the acceptable loss.
b. Setting Trade Objectives
Clear objectives define what success looks like:
Profit target: A realistic price level for taking profits.
Stop-loss: The price at which to exit if the trade goes against you.
Time horizon: Day trade, swing trade, or position trade.
c. Choosing the Entry Point
Entry strategies include:
Breakouts above resistance or below support.
Pullbacks to support or resistance.
Indicator-based signals (moving averages, RSI, MACD).
A well-timed entry improves the risk-reward ratio, a critical factor in trade management.
3. The Entry Stage
a. Confirming the Setup
Before entering:
Ensure the trade aligns with your strategy.
Confirm market conditions (trend direction, volatility, liquidity).
Avoid emotional triggers; rely on logic and strategy.
b. Order Placement
The method of entry can impact trade management:
Market orders: Immediate execution but subject to slippage.
Limit orders: Execute at your desired price, avoiding overpaying or underselling.
Stop orders: Triggered only when certain levels are reached.
c. Position Sizing
Trade management begins at entry. Proper sizing ensures you can withstand market fluctuations without violating risk limits. Calculations should include:
Account size
Maximum risk per trade
Stop-loss distance
4. Initial Trade Management: First Phase
Once a trade is live, the first few minutes or hours are crucial.
a. Monitoring Price Action
Observe how the trade behaves relative to your entry:
Is the price moving in your favor?
Are there signs of reversal or consolidation?
Does the trade align with broader market trends?
b. Adjusting Stop-Loss
Depending on market behavior:
Trailing stop-loss: Moves with favorable price action to lock in profits.
Break-even stop: Adjusts the stop-loss to the entry point once the trade moves in your favor.
These adjustments reduce risk without limiting profit potential.
c. Avoid Over-Management
Too many interventions early in the trade can reduce profitability. Focus on planned adjustments rather than reactive ones.
5. Active Trade Management: Mid-Trade Phase
As the trade progresses, management focuses on protecting gains and assessing market conditions.
a. Monitoring Market Signals
Trend continuation: Indicators like moving averages or ADX can suggest the trend is intact.
Signs of reversal: Divergences or support/resistance tests may indicate slowing momentum.
b. Scaling In or Out
Advanced trade management involves adjusting position size:
Scaling out: Selling a portion of the position to lock in profits while leaving the rest to run.
Scaling in: Adding to a position if the trade continues to move in your favor (requires strict risk control).
c. Emotional Discipline
Avoid greed or fear-driven decisions. Many traders exit too early or hold too long due to emotions, undermining well-planned management strategies.
6. Exit Strategies
Exiting a trade is as important as entering it. Exits can be categorized into profit-taking and loss-limiting.
a. Stop-Loss Management
Fixed stop-loss: Set at trade entry; does not move.
Dynamic stop-loss: Adjusted based on price action or technical levels.
Volatility-based stop: Placed considering market volatility (e.g., ATR-based stop).
b. Profit Targets
Profit targets depend on the strategy:
Risk-reward ratio: Commonly 1:2 or higher.
Key levels: Previous highs/lows, trendlines, Fibonacci retracements.
Trailing profits: Using a moving stop to let profits run as long as the trend continues.
c. Partial Exits
Exiting partially can:
Reduce risk exposure.
Secure profits.
Allow a portion of the trade to benefit from extended moves.
d. Time-Based Exit
Some trades are exited purely based on time:
Day trades end before market close.
Swing trades may close after a few days or weeks based on pre-determined plans.
7. Trade Review and Analysis
After exiting, a trade review is crucial. Successful traders continuously learn from each trade.
a. Recording Trade Data
Entry and exit points
Position size
Stop-loss and target levels
Outcome (profit/loss)
Market conditions
b. Performance Metrics
Evaluate:
Win rate
Average risk-reward ratio
Maximum drawdown
Emotional adherence to strategy
c. Lessons Learned
Identify what worked and what didn’t:
Did you follow the plan?
Were stop-losses or targets set appropriately?
Could trade management have improved outcomes?
This reflection improves future trade management decisions.
8. Psychological Aspects of Trade Management
Effective trade management isn’t only technical; psychology plays a major role.
a. Emotional Control
Fear, greed, and impatience can cause premature exits or overexposure. Discipline ensures consistent management.
b. Patience and Observation
Trades require time to develop. Rushing exits reduces profitability, while overconfidence can lead to excessive risk.
c. Confidence in Strategy
Believing in your setup and management plan prevents impulsive decisions during volatile periods.
9. Tools and Techniques for Trade Management
Modern trading offers tools to aid trade management:
Stop-loss orders: Automatic exit when a price level is breached.
Trailing stops: Adjust automatically to follow market trends.
Alerts and notifications: Track critical price movements.
Charting software: Helps visualize trends, supports, and resistance levels.
Risk calculators: Ensure proper position sizing and exposure.
Using these tools reduces human error and improves consistency.
10. Common Mistakes in Trade Management
Even experienced traders can fall into traps:
Ignoring stop-losses: Leads to large, unnecessary losses.
Over-trading: Entering too many positions without proper management.
Excessive micromanagement: Constantly adjusting stops or positions.
Emotional trading: Letting fear or greed dictate decisions.
Failing to review trades: Missing opportunities to improve future performance.
Avoiding these mistakes is as important as any technical skill.
11. Advanced Trade Management Strategies
Once basic management is mastered, traders can explore advanced techniques:
a. Hedging
Use options or correlated instruments to protect open positions.
b. Scaling Positions Dynamically
Adjust size in response to volatility and trend strength.
c. Diversification
Manage multiple trades across assets to reduce risk concentration.
d. Algorithmic or Automated Management
Automated systems can manage stops, take profits, and exit trades based on predefined rules, reducing emotional interference.
12. Conclusion: The Art of Trade Management
Trade management is the bridge between strategy and profitability. While entries are important, how a trader manages the trade—adjusting stops, scaling positions, monitoring risk, and controlling emotions—ultimately determines long-term success. Consistent, disciplined trade management transforms market volatility from a threat into an opportunity.
By mastering this process from entry to exit, traders can:
Minimize losses during adverse conditions.
Maximize profits during favorable trends.
Build confidence and consistency in their trading approach.
Develop a systematic, rules-based trading methodology that outperforms purely speculative approaches.
The ultimate goal is not just winning trades but managing trades to create sustainable, long-term profitability.
BTCUSDBitcoin is the first decentralized cryptocurrency. Based on a free-market ideology, bitcoin was invented in 2008 when an unknown entity published a white paper under the pseudonym of


Bitcoin’s Correction Puzzle: Wedge Break, Macro Shifts!!Bitcoin has entered a fascinating phase after breaking down from its rising wedge formation, leaving the market in a medium-term correction cycle. Current price action around 113000 is trying to stabilize, but the structure suggests this zone is fragile. If bulls cannot reclaim and hold above the invalidation band near 116000, corrective flows are to dominate. The first major support sits around 103600, where a pause or bounce could develop. If that level folds, the market opens up for a deeper liquidity sweep toward 93000. Should this pocket fail to hold, Bitcoin’s path could extend into the 75000 region a zone that looks extreme but is consistent with how deep-pocket corrections unfold after a parabolic wedge break.
From a macro angle, the pressure is building. The Fed’s transition toward deeper cuts reflects softer growth, but while rate reductions support risk sentiment broadly, the narrative is colliding with dollar weakness, shifting liquidity conditions, and fading institutional momentum after the wedge breakdown. Equity markets still command flows, and with gold and silver absorbing part of the safe-haven bid, Bitcoin’s role as digital gold is being tested again. Yet, structurally, this correction is not an end-game it’s part of the broader cyclical rhythm. Bulls will need to defend lower zones convincingly to rebuild positioning before another attempt at fresh highs.
In essence, Bitcoin is in a correction phase where short-term optimism hangs on reclaiming 116000, while failure opens doors to a deeper hunt for liquidity at 103600, 93000, and potentially 75000. The macro backdrop makes this correction phase more interesting than usual it’s not just about price action, but about how Bitcoin will reassert its place in a market torn between easing policy, risk-on appetite, and competition from traditional safe-haven flows. Trade safe !!
Key Levels:
Invalidation band (bulls must reclaim): 116000
First support: 103600
Deep pocket zone: 93000
Extreme correction target: 75000

Retail Trading vs Institutional Trading1. Introduction to Market Participants
Financial markets are arenas where buyers and sellers interact to trade securities, commodities, currencies, and other financial instruments. Participants range from small individual traders to massive hedge funds and banks. Among them, retail traders and institutional traders represent two fundamentally different types of participants:
Retail Traders: Individual investors trading their own personal capital, typically through brokerage accounts. They operate on a smaller scale and often lack access to sophisticated market tools and data.
Institutional Traders: Large entities such as hedge funds, mutual funds, pension funds, and banks that trade on behalf of organizations or clients. They have access to advanced trading platforms, proprietary research, and considerable capital.
These differences have profound implications for trading strategies, risk management, and market influence.
2. Objectives and Motivations
Retail Trading Goals
Retail traders are typically motivated by personal financial goals, which may include:
Wealth accumulation: Generating additional income for retirement or long-term financial security.
Speculation: Capitalizing on short-term market movements for potential high returns.
Learning and experience: Gaining exposure to financial markets as a personal interest.
Retail traders often seek smaller but frequent gains, and their investment horizon can vary from intraday trading to multi-year holdings. Emotional factors, such as fear and greed, play a significant role in their decision-making.
Institutional Trading Goals
Institutional traders operate with a broader set of objectives, including:
Client returns: Maximizing investment returns for clients, shareholders, or beneficiaries.
Capital preservation: Managing risk to avoid significant losses, particularly when dealing with large portfolios.
Market efficiency: Institutions often seek to exploit market inefficiencies using advanced strategies.
Unlike retail traders, institutional traders are guided by formal investment mandates, compliance requirements, and fiduciary responsibilities. Their decisions are often more systematic, data-driven, and risk-managed.
3. Scale and Capital
One of the most obvious differences between retail and institutional trading is the scale of capital:
Retail Traders: Typically trade with personal savings ranging from a few hundred to a few hundred thousand dollars. Capital limitations restrict their market influence and often their access to premium financial tools.
Institutional Traders: Operate with millions to billions of dollars in assets. This scale allows institutions to participate in large transactions without immediately affecting market prices, though their trades can still move markets in less liquid instruments.
The size of capital also affects strategies. Large orders from institutions are carefully planned and often executed in stages to avoid market disruption, whereas retail traders can often enter and exit positions more freely.
4. Access to Market Information and Tools
Access to information and tools is another critical distinction:
Retail Traders
Relatively limited access to proprietary market data.
Rely on public sources, online trading platforms, and subscription services for research.
Use simple charting tools, technical indicators, and news feeds.
Institutional Traders
Access to real-time market data feeds, professional analytics, and algorithmic trading tools.
Can employ high-frequency trading, quantitative strategies, and derivatives hedging.
Often have teams of analysts, economists, and data scientists to support trading decisions.
This access disparity often results in retail traders being reactive while institutional traders are proactive, enabling the latter to exploit market inefficiencies more efficiently.
5. Trading Strategies
Retail Trading Strategies
Retail traders typically employ a variety of strategies, including:
Day trading: Buying and selling within the same day to capitalize on small price movements.
Swing trading: Holding positions for days or weeks to benefit from intermediate-term trends.
Buy-and-hold investing: Long-term investment in stocks or ETFs based on fundamentals.
Options trading: Speculating on market movements with leveraged contracts.
Retail strategies often rely heavily on technical analysis and shorter-term trends due to smaller capital and less access to proprietary insights.
Institutional Trading Strategies
Institutional traders have a broader arsenal:
Algorithmic and high-frequency trading (HFT): Exploiting price discrepancies at millisecond speeds.
Arbitrage strategies: Taking advantage of price differences across markets or instruments.
Portfolio diversification and hedging: Balancing large positions across asset classes to manage risk.
Macro trading: Investing based on global economic trends and geopolitical developments.
Institutions combine fundamental analysis, quantitative models, and risk management frameworks, enabling them to navigate both volatile and stable markets effectively.
6. Risk Management Practices
Retail Traders
Risk management is often inconsistent and based on personal judgment.
Common tools include stop-loss orders, position sizing, and diversification, but adherence varies.
Emotional trading can exacerbate losses, especially during volatile markets.
Institutional Traders
Risk management is rigorous and regulated.
Use advanced techniques like Value at Risk (VaR), stress testing, and derivatives hedging.
Decisions are structured to meet fiduciary responsibilities, ensuring client funds are protected.
The disciplined risk management of institutions often gives them a competitive advantage over retail traders, who may rely on gut instinct rather than structured analysis.
7. Market Impact
Retail traders, due to their smaller scale, generally have minimal impact on market prices. They can, however, collectively influence trends, especially in heavily traded retail stocks or during speculative frenzies (e.g., “meme stocks”).
Institutional traders, on the other hand, can significantly move markets. Large orders can influence prices, liquidity, and volatility, especially in less liquid assets. This ability requires institutions to carefully manage order execution and market timing to avoid slippage and adverse price movement.
8. Behavioral Differences
Behavioral factors play a significant role in distinguishing retail and institutional traders:
Retail traders: More susceptible to emotional biases, such as fear, greed, overconfidence, and herd behavior. Social media and news often influence their decisions.
Institutional traders: Tend to follow disciplined processes, supported by data-driven models and compliance requirements. While human emotion exists, it is mitigated by institutional structures.
Behavioral finance studies show that retail investors often underperform compared to institutional investors due to these emotional and cognitive biases.
Conclusion
While retail and institutional traders share the same markets, their approaches, resources, and impacts are vastly different. Retail trading is more personal, flexible, and emotionally driven, whereas institutional trading is structured, capital-intensive, and data-driven. Recognizing these differences allows retail traders to make better strategic decisions, manage risk more effectively, and potentially learn from institutional practices.
For aspiring traders, the key takeaway is that knowledge, discipline, and adaptability matter more than capital size alone. By understanding institutional strategies, leveraging proper risk management, and mitigating behavioral biases, retail traders can significantly improve their odds of success.
BTC Neowave UpdateBTC Intraday Update
Our entry 1 is activated yesterday, so maintain that with stoploss
2nd entry will be created when.....s1 will complete by breaking up of black cycles
Short Term Trend
Learn More about trend here

Top Forex Weekly Analysis DXY, BTC, GOLD, EURUSD 22-28 Sept 2025DXY (US Dollar Index):
DXY bounced from the key 2011 channel support around 96.60 last week, fueled by the recent Fed rate decision.
Resistance stands at 97.70; a weekly close above this level could push DXY towards 98.60.
As long as it stays above 96.60, the outlook remains cautiously bullish.
Failure to break above 97.70 would keep the index range-bound between 96.60 and 97.70, while a break below 96.60 would signal bearish territory.
BTC (Bitcoin):
Bitcoin is currently in an upward trend, forming a "Wedge" reversal pattern and showing buying pressure.
Key resistance near 128,505 with a potential rally target above 145,605 if it breaks above 135,605.
A break below support at 103,405 would indicate a bearish trend, potentially dropping BTC below 90,505.
Short-term bullish corrections are expected, but a cautious approach is advised due to possible downward rebounds.
GOLD (XAU/USD):
Gold shows strong gains near 3668 and continues an uptrend supported by technical patterns.
Potential correction to test support near 3535 before rebounding towards a target above 4045.
Bullish momentum is confirmed if gold closes above 3745, while a fall below 3205 would negate the rally and push prices lower.
Gold remains influenced by interest rates, USD strength, and global events.
EURUSD:
EUR/USD shows a slight upside tilt but faces supply zone resistance.
Possible correction towards 1.16 to 1.14 or a breakout beyond key resistance near 1.18.
A strong breakout above 1.1955 would open the way to 1.2265, while a close below 1.1485 supports a bearish scenario.
Momentum indicators and pattern reversals suggest mixed short-term outlook with trading opportunities during potential corrections.

BTC/USD (Short Cycles)Namaskaram Everyone
BTC is in uptrend but going down in Medium cycle.
currently risk reward is not much favourable, for that you need to wait for short term cycle retracement.
If you need shorter degree chart i will update it, reply in comments.
Intraday Gear 3
Intraday Gear 2
Learn More about trend here

One Last Move This pattern is ideal to understand where price is increasing making higher low
when seen on Graphically representation it looks more like ending diagonal which is popular in the Financial Markets as Pattern suggest the end of ongoing momentum
I have also marked momentum indicator indicating the another one push is likely to occur
This is education content
My Opinion Fresh Buy is bad idea Trail the stop on current holding take profits before its too late
Good luck

Part 1 Support and Resistance1. Introduction to Option Trading
Option trading is a sophisticated financial instrument used widely in modern markets for hedging, speculation, and portfolio management. Options are derivatives, meaning their value is derived from an underlying asset, such as stocks, indices, commodities, or currencies. Unlike buying or selling the underlying asset directly, options give traders the right—but not the obligation—to buy or sell the asset at a predetermined price within a specific timeframe.
The global options market has grown exponentially, as institutional investors, retail traders, and hedge funds recognize the flexibility, leverage, and risk-management capabilities of options. They are integral to strategies ranging from simple protective hedging to complex arbitrage trades.
1.1 What Is an Option?
An option is a contract that grants its holder certain rights:
Call Option: The right to buy the underlying asset at a specific price (strike price) before or on a specified expiry date.
Put Option: The right to sell the underlying asset at a specific price before or on a specified expiry date.
Unlike futures or forwards, which carry obligations, options give the holder flexibility, making them versatile tools for both risk mitigation and speculative opportunities.
2. Key Terminology in Option Trading
Understanding option trading requires familiarity with certain fundamental terms:
Strike Price: The predetermined price at which the underlying asset can be bought (call) or sold (put).
Premium: The price paid to buy the option. This is influenced by time value, intrinsic value, volatility, and market conditions.
Expiry Date: The date on which the option contract expires and becomes void.
In-the-Money (ITM): An option with intrinsic value (e.g., a call option with a strike price below the current market price).
Out-of-the-Money (OTM): An option with no intrinsic value (e.g., a call option with a strike price above the current market price).
At-the-Money (ATM): An option where the strike price equals the current market price.
Underlying Asset: The financial instrument (stock, index, commodity, or currency) on which the option is based.
Volatility: A measure of the asset's price fluctuations, which directly impacts option pricing.


Bitcoin Market Report – Liquidity Grabs Before Next ExpansionThe market is showing clear signs of engineered volatility, with strong impulsive moves followed by rapid retracements. This behavior reflects liquidity targeting, where price sweeps both sides before resuming its broader path.
Current conditions suggest Bitcoin is in a redistribution stage, with momentum alternating to trap short-term participants. The repeated liquidity grabs signal that larger players are accumulating positions while clearing out weaker hands.
The overall structure points to continued testing of lower liquidity pools before any major directional expansion. Once this phase is complete, the market is likely to enter a more decisive trend, supported by the buildup of institutional flow and reduced volatility pockets.
In short, Bitcoin is cycling through liquidity collection and preparation, positioning itself for a larger move as market balance shifts.

BTCUSD 3R Sell side trade BTCUSD is forming sell side trade as current bias and draw on liquidity both are at down side. Price has also left SIBIs to attract price upside for a while and then return back to target. In weekend price may have low volatility and trade possibly generate on Monday or later.
1. There is a 4H time frame bearish FVG.
2. There is bearish FVG in 1H and 30m overlapping with 4H FVG. Now price is approaching it slowly.
3. These FVGs are forming inside Fib golden zone.
4. Order flow is bearish. And draw on liquidity is also at downside.
5. Most probably price will take liquidity of FVGs and create MSS/CISD/TS/iFVG in LTF.
6. Price should show rejection/reversal in LTF (5m,1m) at FVG zone.
All these combinations are signalling a high probability and 3R trade scenario.
Note – if you liked this analysis, please boost the idea so that other can also get benefit of it. Also follow me for notification for incoming ideas.
Also Feel free to comment if you have any input to share.
Disclaimer – This analysis is just for education purpose not any trading suggestion. Please take the trade at your own risk and with the discussion with your financial advisor.

Part 1 Ride The Big MovesIntroduction to Options Trading
Options trading is a dynamic segment of the financial markets that allows investors to hedge risk, speculate on price movements, and enhance returns. Unlike stocks, which represent ownership in a company, options are financial derivatives—contracts whose value is derived from an underlying asset, such as stocks, indices, commodities, or currencies. By offering flexibility and leverage, options have become a popular tool for both professional traders and retail investors.
What Are Options?
An option is a contract that gives the buyer the right—but not the obligation—to buy or sell an underlying asset at a predetermined price, called the strike price, before or on a specific date known as the expiration date. The seller, or writer, of the option has the obligation to fulfill the contract if the buyer chooses to exercise it.
There are two main types of options:
Call Options – These give the holder the right to buy the underlying asset at the strike price. Investors purchase call options when they expect the price of the underlying asset to rise.
Put Options – These give the holder the right to sell the underlying asset at the strike price. Investors buy put options when they expect the price of the underlying asset to fall.
Key Terms in Options Trading
Understanding options requires familiarity with some key concepts:
Premium: The price paid by the buyer to the seller for the option. This is influenced by factors like the underlying asset price, strike price, time to expiration, volatility, and interest rates.
Strike Price: The price at which the buyer can buy (call) or sell (put) the underlying asset.
Expiration Date: The date on which the option expires. After this, the option becomes worthless if not exercised.
In-the-Money (ITM): A call option is ITM if the underlying price is above the strike price, and a put option is ITM if the underlying price is below the strike price.
Out-of-the-Money (OTM): A call option is OTM if the underlying price is below the strike price, and a put option is OTM if it’s above the strike price.
At-the-Money (ATM): When the underlying price is equal to the strike price.

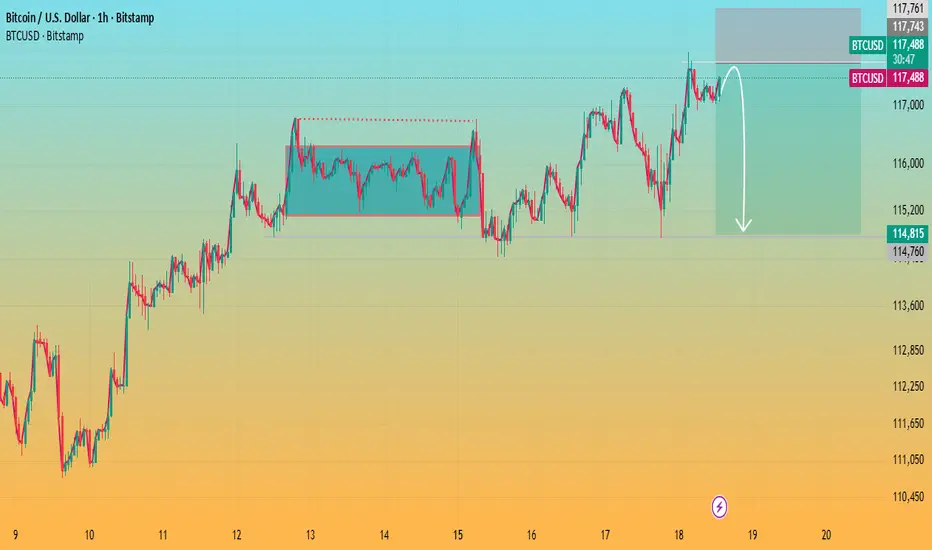
Bitcoin Testing Resistance with Potential Pullback AheadKey observations:
Range Breakout: Earlier, Bitcoin broke out of a consolidation zone (marked box), which triggered the recent upward move.
Resistance Zone: Price is hovering near the 5.15%–5.42% gain zone, where selling pressure has historically emerged.
Pullback Signal: The drawn arrow suggests a possible rejection at this resistance, pointing to a corrective move down toward the 3% zone.
Momentum Check: If BTC fails to hold above this resistance, a retracement is likely. However, a strong breakout could open the door toward 6% gains.
📌 Conclusion:
Bitcoin is at a decision point. Rejection at resistance could bring a pullback toward 2.8%–3.0%, while a breakout above 5.4% would continue the bullish momentum.

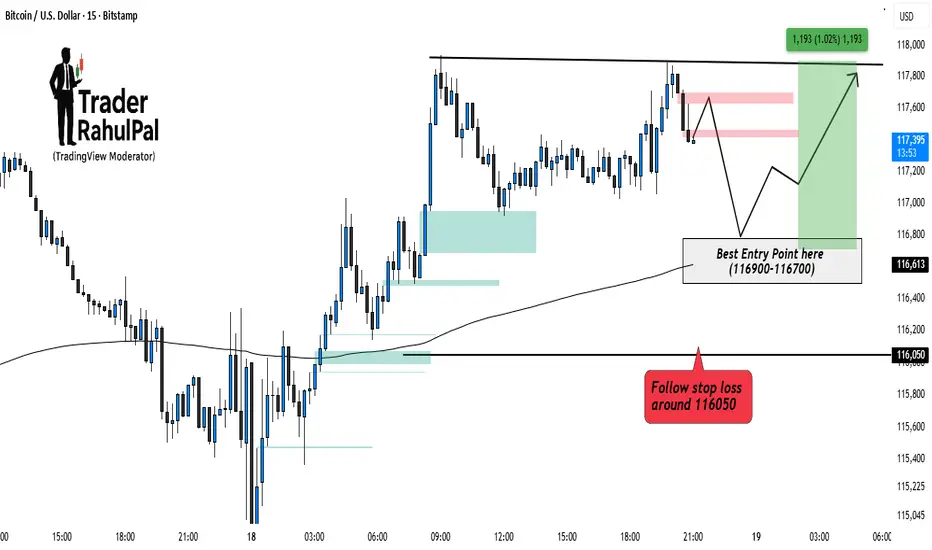
Bitcoin Bullish side Entry Setup Intraday – Key Levels to Watch!Bitcoin is consolidating near its upper resistance zone after a recent bounce. Price action suggests that a pullback into the 116900–116700 range can offer a high-probability entry for buyers. Maintaining a stop loss around 116050 helps to protect against deeper downside risk. As long as this zone holds, the bias remains bullish, with potential upside toward 117800–118000 . Intraday traders should closely watch how price reacts around the entry zone before positioning.
Disclaimer: This analysis is for educational purposes only and should not be taken as financial advice. Please do your own research or consult your financial advisor before investing.
Part 1 Candle Stick Pattern Introduction
Options trading is one of the most versatile and powerful instruments in the financial markets. Unlike traditional stock trading, options allow traders and investors to gain exposure to an asset's price movements without actually owning the asset. Options belong to the derivatives family because their value derives from an underlying asset, such as stocks, indices, commodities, currencies, or ETFs.
Options trading has become increasingly popular in India, the United States, and global markets due to its flexibility, potential for leveraged profits, and ability to hedge risks. Investors use options for speculation, income generation, and risk management, making it a crucial tool in modern portfolio strategies.
Basics of Options
An option is a contract that gives the holder the right, but not the obligation, to buy or sell an underlying asset at a predetermined price on or before a specific date. This differentiates options from futures, where both parties are obligated to execute the contract.
Key terms in options trading:
Underlying Asset: The stock, index, commodity, or currency on which the option is based.
Strike Price: The price at which the option holder can buy (call) or sell (put) the underlying asset.
Expiry Date: The date on which the option contract expires.
Premium: The cost of buying an option, paid by the buyer to the seller.
Intrinsic Value: The difference between the current price of the underlying and the strike price, if favorable to the option holder.
Time Value: The extra value based on the time remaining until expiration and expected volatility.
In-the-Money (ITM), At-the-Money (ATM), Out-of-the-Money (OTM): Terms used to describe an option’s profitability status.
Options provide flexibility, allowing investors to profit from rising, falling, or sideways markets, depending on the chosen strategy.
