Part 8 Trading master ClassWhy Trade Options?
Options are popular because of their flexibility. They can serve multiple purposes:
Hedging (Insurance)
Just like insurance, options protect against downside risk.
Example: Buying a put option to protect your stock holdings.
Speculation (Profit from Price Movements)
Traders use options to bet on direction, volatility, or even stability of prices.
Income Generation
Selling covered calls or cash-secured puts generates steady premium income.
Leverage
Options allow large exposure with smaller capital compared to stocks.
How Options Work: Pricing
Option pricing is complex, but two main values exist:
Intrinsic Value → Difference between stock price and strike (if favorable).
Time Value → Extra value based on time left till expiry and expected volatility.
Example:
Stock = ₹1,000
Call strike = ₹950, Premium = ₹70
Intrinsic = ₹1,000 – ₹950 = ₹50
Time Value = ₹20
Options Market Structure
The options market involves:
Buyers of Options – Limited risk (premium), unlimited potential reward.
Sellers (Writers) of Options – Limited reward (premium), potentially high risk.
Exchanges (like NSE in India, CBOE in US) – Standardized contracts.
Clearing Corporations – Ensure smooth settlement, reduce counterparty risk.
BTCUSD.PI trade ideas

Part 7 Trading master ClassIntroduction to Options Trading
Financial markets offer countless opportunities for investors and traders to grow wealth. Among them, options trading stands out as one of the most versatile, powerful, and misunderstood tools. Options can help protect a portfolio from risk, generate extra income, or allow a trader to speculate on price movements with limited upfront capital.
At its core, options trading is about making calculated decisions on probabilities — the probability of a stock rising, falling, or staying stable. While stocks represent ownership in a company, options are contracts that give special rights tied to those stocks (or other assets).
Before diving deep, remember this: options are not inherently risky. Misuse of options is risky. With the right understanding, options can be a trader’s best friend.
Basics of Options
What is an Option?
An option is a financial contract that gives the buyer the right (but not the obligation) to buy or sell an underlying asset (like a stock, index, or commodity) at a predetermined price (strike price) before or on a certain date (expiry date).
Two main types exist:
Call Option → Right to buy the underlying at strike price.
Put Option → Right to sell the underlying at strike price.
The buyer pays a fee, known as the premium, to acquire this right.
Example:
Stock: Reliance Industries trading at ₹2,500
You buy a Call Option with strike ₹2,600, expiring in 1 month, premium ₹50.
If Reliance rises to ₹2,700 before expiry:
You can buy at ₹2,600, sell at ₹2,700, and profit (₹100 – ₹50 = ₹50 per share).
If Reliance stays below ₹2,600:
The option expires worthless, and you lose only the premium (₹50).
Key Terms
Strike Price → Fixed price at which option can be exercised.
Expiry Date → Last date to exercise the option.
Premium → Cost of buying the option.
Lot Size → Minimum quantity per option contract.
In the Money (ITM) → Option has intrinsic value.
Out of the Money (OTM) → Option has no intrinsic value.
At the Money (ATM) → Strike price is close to current market price.

How Smart Liquidity Shapes Price Movements1. Understanding Liquidity in Trading
Liquidity refers to how easily an asset can be bought or sold without causing a significant change in its price. In a highly liquid market, a trader can enter or exit a position quickly at the desired price. In illiquid markets, even small orders can create sharp price movements.
High liquidity: Stocks like Apple, Amazon, or Nifty 50 stocks.
Low liquidity: Small-cap stocks or exotic cryptocurrencies.
Liquidity affects price stability, volatility, and order execution. Traders often think price moves purely based on supply and demand, but liquidity tells the deeper story: prices move where liquidity exists.
2. Who Controls Smart Liquidity?
Smart liquidity is usually controlled by:
Institutional investors: Banks, hedge funds, mutual funds.
Market makers: Entities that provide liquidity by continuously quoting buy and sell prices.
High-frequency trading (HFT) firms: Using algorithms to detect and exploit liquidity.
Large retail players with significant capital.
These participants often have more information, better technology, and strategic motives, enabling them to move markets subtly without causing abrupt price swings.
Key point: Smart liquidity is not random; it is strategically placed where it can create maximum impact on price.
3. Types of Liquidity
Understanding liquidity types is essential for spotting smart money activity:
a) Visible Liquidity
Orders you can see in the order book. For example:
Limit orders displayed at certain price levels.
Market depth showing buy/sell interest.
b) Hidden Liquidity
Orders that are not visible to the general market. This can include:
Iceberg orders: Large orders split into smaller visible chunks.
Hidden institutional positions built slowly to avoid moving price drastically.
c) Imbalance Liquidity
Occurs when buy orders far exceed sell orders (or vice versa). Smart money exploits these imbalances by pushing prices to areas where retail stops are placed.
4. How Smart Liquidity Moves Prices
Smart liquidity shapes price movements through accumulation, manipulation, and distribution:
a) Accumulation
Smart money accumulates positions at low prices without triggering panic or retail selling.
This is often seen in a consolidation phase or a “range” where prices appear to be moving sideways.
Retail traders often miss this because there is no clear breakout yet.
Example:
A stock trades between ₹100–₹105. Smart money gradually buys large quantities at ₹100–₹102. Price doesn’t rise immediately because selling pressure absorbs the buying, but once accumulation is sufficient, a breakout occurs.
b) Manipulation
Smart money intentionally creates liquidity traps to force retail traders into making mistakes.
This includes stop-hunting, where price briefly dips below support levels to trigger stop-loss orders, providing liquidity for smart money to buy.
Example:
Price of a currency pair is at 1.3450, and many retail traders have stop-loss at 1.3440. Smart money pushes price to 1.3438, triggering retail stops, and then price rises as smart money has acquired positions at lower levels.
c) Distribution
Once positions are large enough, smart money starts selling into strength.
Retail traders often buy late, thinking the uptrend is endless, providing liquidity for smart money to exit.
Example:
After a strong uptrend, institutional traders start selling gradually around ₹120–₹125 while retail traders keep buying. Eventually, the stock reverses, leaving late buyers trapped.
5. Recognizing Smart Liquidity Zones
Smart money typically operates around key price levels. Recognizing these zones helps traders anticipate future movements.
a) Support and Resistance Levels
These are areas where price historically reacts.
Smart liquidity is often hidden just beyond these levels (e.g., a stop-loss cluster).
b) Liquidity Pools
Liquidity pools are areas with a concentration of pending orders.
Smart money often targets these pools to acquire or offload large positions without creating abrupt volatility.
c) Order Book Analysis
Watching the depth of market (DOM) and level 2 order book can reveal where liquidity resides.
Sudden appearance or disappearance of large orders often signals smart money activity.
6. Smart Liquidity in Trend Formation
Price trends are not purely driven by news or fundamentals. They are largely engineered by liquidity flows:
Uptrend: Smart money absorbs selling pressure at lower levels and pushes price upward when liquidity dries out.
Downtrend: Smart money sells gradually into rallies while retail buys impulsively.
Sideways trends: Smart money accumulates or distributes positions while retail chases minor price movements.
7. Tools and Techniques to Detect Smart Liquidity
a) Volume Analysis
Unusual spikes in volume often indicate smart money activity.
Clues: High volume at support/resistance without significant price movement suggests accumulation or distribution.
b) Candlestick Patterns
Long wicks often show liquidity sweeps (stop-hunting) by smart money.
Patterns like pin bars and inside bars around key levels are often liquidity-driven.
c) Market Structure
Smart liquidity targets weak points in market structure: swing highs/lows, breakouts, and fake breakouts.
Recognizing these allows traders to anticipate reversals or continuations.
d) Footprint and Order Flow Charts
Advanced tools that track real-time buy/sell imbalances.
Helps traders see where institutional orders are entering/exiting.
8. Liquidity and Stop-Hunting
Stop-hunting is one of the most famous tactics of smart liquidity:
Retail traders place stops near obvious levels.
Smart money triggers these stops to create temporary volatility.
Once stops are triggered, price moves in the intended direction as smart money executes trades.
Example:
Stock support at ₹50.
Retail stops at ₹49.80.
Price dips to ₹49.78, triggers stops → liquidity provided → smart money buys → price rises.
Conclusion
Smart liquidity is the invisible hand that shapes price movements in every market. While retail traders often focus on visible price action, smart liquidity analysis allows you to understand why price moves, not just where. By identifying accumulation, distribution, stop-hunting, and liquidity zones, traders can align their strategies with the forces driving the market.
The most successful traders don’t fight smart money—they follow liquidity, entering when smart money enters and exiting when it exits. Understanding smart liquidity isn’t just a technical skill; it’s a market intuition built through observation, patience, and practice.
Price is a reflection of liquidity, and liquidity is the language of smart money. Master this language, and you can navigate markets with greater confidence, precision, and profitability.
BTCUSD 4.5R sell side beautiful scenarioBTCUSD is in range from last 5 days but now it is showing Smart Money’s interest. And it appears a down side trade is being developed as it has swept upside liquidity and forming CISD after displacement.
1. It has taken upside liquidity.
2. Formed CISD after displacement.
3. It has formed FVG and BPR on 1h time frame and price is inside POI.
4. POI is created inside OTE zone confirming good RnR.
5. Most probably price will take liquidity of FVG and OTE zone and create MSS/TS in LTF.
6. Price should show rejection/reversal in LTF (5m,1m) at FVG zone.
All these combinations are signalling a high probability and 4.5R trade scenario.
Note – if you liked this analysis, please boost the idea so that other can also get benefit of it. Also follow me for notification for incoming ideas.
Also Feel free to comment if you have any input to share.
Disclaimer – This analysis is just for education purpose not any trading suggestion. Please take the trade at your own risk and with the discussion with your financial advisor.

BITCUSDALWAYS TAKE TRADE WITH CONFIRMATION
Note : Trading in any financial market is very risky. I post ideas for educational purpose only. It is not financial advice. Do not hold us responsible for any potential loss you may incur. Please consult your financial adviser before trading.

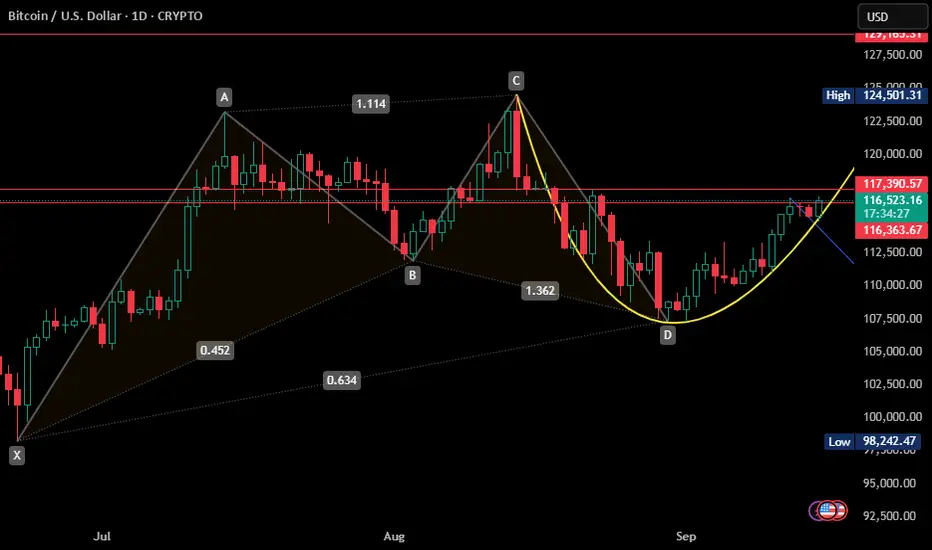
BTC COMLETED BAT PATTERN & FORMING ROUNDING BOTTOMBTC day chart shows that BAT PATTERN is completed now it is forming rounding bottom,But it will go for breakout when previous high get broken which is marked by two red lines as resistance.
after sustaining abov this two resistances it may confirm that it will go to test all time high.
this isnot my buy/sell call.
BTC/USD 15/09/2025: Bullish Potential Pre-Fed DecisionMarket Overview: Steady with Huge Potential
Bitcoin remains the king of crypto with a market cap of 2.31 trillion USD, dominating the space. The 24-hour trading volume is at 33.29 billion USD (+4.72%), showing decent buying interest but not enough for a massive rally yet. With only 19.92 million BTC circulating (94.86% of the 21 million total supply), there’s low inflationary pressure, which is great for long-term value. Can BTC keep its 92.27% yearly gain? Drop your thoughts in the comments below! 📊
Technical Analysis: Double Bottom and Bullish Channel Looking Hot
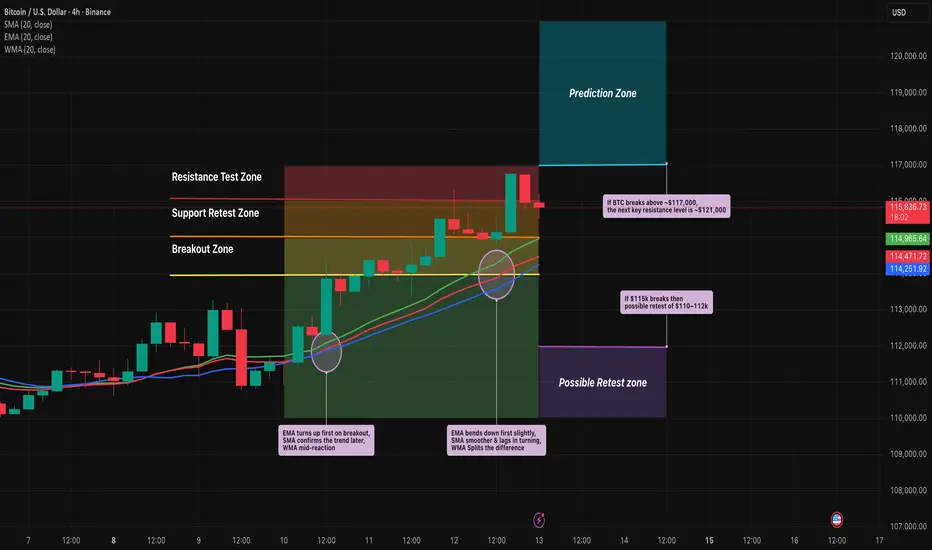
Support & Resistance: Strong support at 114,000 - 115,000 USD (holding since early September). Resistance is at 116,000 - 116,500 USD—break this, and we could see 120,000 USD next! If it fails, expect a retest of 114,000 USD. Watch for a breakout, traders! ⚠️
Trend: The chart shows a double bottom pattern from September’s low, with the bullish channel still intact. The Fear & Greed Index is at 53-55 (Neutral), meaning no one’s panicking or getting too excited. RSI is neutral, MACD is slightly soft, but the daily timeframe screams “Buy”! 📉
Macro News & Triggers: Fed Decision to Steal the Show?
The market is glued to the Fed’s expected 0.25% rate cut this week—if it happens, risk assets like Bitcoin could see a flood of cash! 🌊 On the bullish side: Billionaire Tim Draper is pushing for BTC adoption, predicting 250,000 USD by December 2025, and Capital Group turned a 1 billion USD investment into 6 billion USD profits. But watch out for whale selling and weak altcoins (like SHIB, down 3.22%)—they could drag BTC lower. Ready for some volatility? 🔥
Forecast & Trading Strategy: Your Game Plan
Short-Term (1-7 Days): BTC likely to trade between 114,000 - 117,000 USD, with the Fed as the big trigger. A rate cut could push it to test 120,000 USD; if not, it might dip to 114,000 USD. There’s a 60% chance of an upside if it holds above 115,000 USD—perfect for a long trade! 📈
Long-Term (2025-2030): Super bullish! Changelly predicts 116,220 USD today, rising to 117,978 USD tomorrow; Investing Haven sees stability around 116,087 USD. With the last halving and institutional buying, BTC could smash past 200,000 USD by year-end. But diversify your portfolio to stay safe! 💡
Fellow traders, it’s time to make your move! Keep the BTC/USD chart open on TradingView and share your predictions in the comments. Do your own research (DYOR) and trade smart! 🙌
#Bitcoin #BTCUSD #CryptoAnalysis #TradingView #FedRateCut #BullishBTC #Crypto2025 #Altcoins #WhaleWatch #FearAndGreed

Btc/usd 4h analysis Bitcoin has broken above the descending trendline from August and is now consolidating near the 115,000 zone. Price action suggests a shift in momentum towards the upside, supported by the series of higher lows forming since early September.
Key Resistance: 115,700 – 116,400.
Support Levels: 114,700 → 112,900 → 111,800 → 110,150.
Trendline: Rising trendline providing support, keeping structure bullish in the short-term.
RSI (14): Currently at 56, holding above the 50 level → indicates bullish momentum remains intact, though slightly cooling from recent highs.
🔑 Trading Plan
Bullish Bias: As long as price holds above 114,700 and the rising trendline, next upside targets sit at 116,400 and 118,000.
Bearish Scenario: A close below 114,700 + RSI under 50 could open the way for a deeper retracement towards 112,900 – 111,800.

btcbearish crossover occurs when the MACD line crosses below the signal line. This indicates a potential shift to downward momentum, especially if it happens above the centerline

BTC Next Move - Bearish or Bullish “The coming week brings a major FED announcement. JP Morgan has already warned that a rate cut could drag markets down, viewing it as a politically driven move. But beyond predictions, the charts are worth watching—Gold has already broken out of its accumulation zone, and now the question is whether Bitcoin can follow the same path.”

BTCUSD | Buy & Sell Setup | 14 Sep 2025 – 10:58 ISTBTCUSD | Buy & Sell Setup | 14 Sep 2025 – 10:58 IST
Buy Zone: 116094.90 – 115961.20
Sell Zone: 115694.50 – 115411.20
Scenario : Buy
Entry: 115975.00
Stop Loss: 115690.00
Targets:
TP1 → 116257.50
TP2 → 117000.00
Analysis:
From Buy Zone (116094.90 – 115961.20) creates possibilities for a buy move.
Scenario 2 : Sell
Entry: 115690.00
Stop Loss: 115975.00
Targets:
TP1 → 114698.00
TP2 → 113370.00
Analysis:
From Sell Zone (115694.50 – 115411.20) creates possibilities for a sell move.
Stay alert on updates here.
⚠️ Disclaimer: This idea is shared for educational purposes only and should not be considered financial advice. Please do your own analysis before making trading decisions.

btc shortCertain candlestick patterns can offer immediate clues for potential reversals, though they are best used with other indicators. Examples include the Evening Star pattern.

Part 1 Support And ResistanceIntroduction to Options
Financial markets offer multiple instruments to trade: equities, futures, commodities, currencies, bonds, and derivatives. Among derivatives, options stand out as one of the most flexible and powerful tools available to traders and investors.
An option is not just a bet on direction. It’s a structured contract that can protect a portfolio, generate income, or speculate on volatility. Unlike buying stocks, where profits are straightforward (stock goes up, you gain; stock goes down, you lose), option trading allows for non-linear payoffs. This means you can design trades where:
You profit if the market goes up, down, or even stays flat.
You control large exposure with limited capital.
You cap your risk but keep unlimited potential reward.
Because of this flexibility, options have become an essential part of modern trading strategies across the world, from Wall Street hedge funds to Indian retail investors trading on NSE’s F&O segment.
What are Options? Basic Concepts
At its core, an option is a contract between two parties:
Buyer of the option → Pays a premium for rights.
Seller (writer) of the option → Receives the premium but takes on obligations.
Definition
An option is a financial derivative that gives the buyer the right, but not the obligation, to buy or sell an underlying asset at a predetermined price (called strike price) on or before a certain date (expiry date).
Underlying assets can be:
Stocks (Infosys, Reliance, Apple, Tesla)
Indices (Nifty, Bank Nifty, S&P 500)
Commodities (Gold, Crude oil)
Currencies (USD/INR, EUR/USD)

BTC Weekly AOI Rejection | 4H Engulfing ConfirmationPrice tapped into the weekly AOI and showed strong rejection with a clean 4H bullish engulfing. Weekly structure still bullish, and rejection suggests continuation to the upside. Expecting momentum toward the $124k–$144k zone if price sustains above $110k support.
Weekly Rejection from AOI
4H Engulfing Confirmation
EMA vs SMA vs WMA: Which Moving Average Should You Use?🔎 Intro / Overview
Moving Averages remain one of the most trusted tools in technical analysis. They smooth price action, highlight the trend, and often act as dynamic support or resistance.
In this post, we compare the 20-period SMA, EMA, and WMA on BTCUSD 4H to show how each reacts differently to market moves.
___________________________________________________________
📔 Concept
SMA (Simple Moving Average): Every candle in the lookback is weighted equally → smooth but slower to react.
EMA (Exponential Moving Average): Recent candles carry more weight → reacts faster, hugs price closely.
WMA (Weighted Moving Average): Linear weighting → a balance between SMA’s stability and EMA’s sensitivity.
The difference lies in responsiveness. Faster averages react early but risk false signals, slower averages confirm trends but lag.
___________________________________________________________
📌 How to Use
1️⃣ Plot the 20-period SMA, EMA, and WMA together.
2️⃣ Watch how each responds during pullbacks, rallies, and consolidations.
3️⃣ Use EMA for quicker signals, SMA for smoother long-term view, and WMA if you prefer a middle ground.
4️⃣ Combine with price action or RSI to avoid relying on moving averages alone.
___________________________________________________________
🎯 Trading Plan
Intraday traders: EMA crossovers (e.g., 9 vs 21 EMA) for faster entries and exits.
Swing traders: SMA for identifying trend direction and major support/resistance.
Balanced traders: WMA for medium-term setups where stability and responsiveness matter equally.
Always align the moving average with your trading style and risk appetite.
___________________________________________________________
📊 Chart Explanation
On BTCUSD 4H:
EMA (red) bent upward first during the $114k breakout, SMA (blue) confirmed later, and WMA (green) sat between them.
At the $115k retest, EMA dipped first, while SMA lagged.
At $116.5–117k resistance, EMA whipsawed but SMA stayed smoother.
Notice how these differences become clear during sharp pullbacks, quick rallies, and sideways ranges.
___________________________________________________________
👀 Observation
EMA is quick but noisy ⚡, SMA is calm but late 🕰️, WMA strikes a middle ground ⚖️.
___________________________________________________________
❗ Why It Matters?
Choosing the right moving average impacts how quickly you spot entries, confirm trends, and manage stop-losses. Understanding the differences helps traders adapt strategies to both trending and sideways markets.
___________________________________________________________
🎯 Conclusion
No single moving average is “best.” Each serves a purpose depending on the timeframe and style of trading. The key is consistency — choose one that aligns with your plan, test it, and apply it with discipline.
👉 Which one do you prefer in your trading — EMA, SMA, or WMA?
___________________________________________________________
⚠️ Disclaimer
📘 For educational purposes only ·
🙅 Not SEBI registered ·
❌ Not a buy/sell recommendation ·
🧠 Purely a learning resource ·
📊 Not Financial Advice
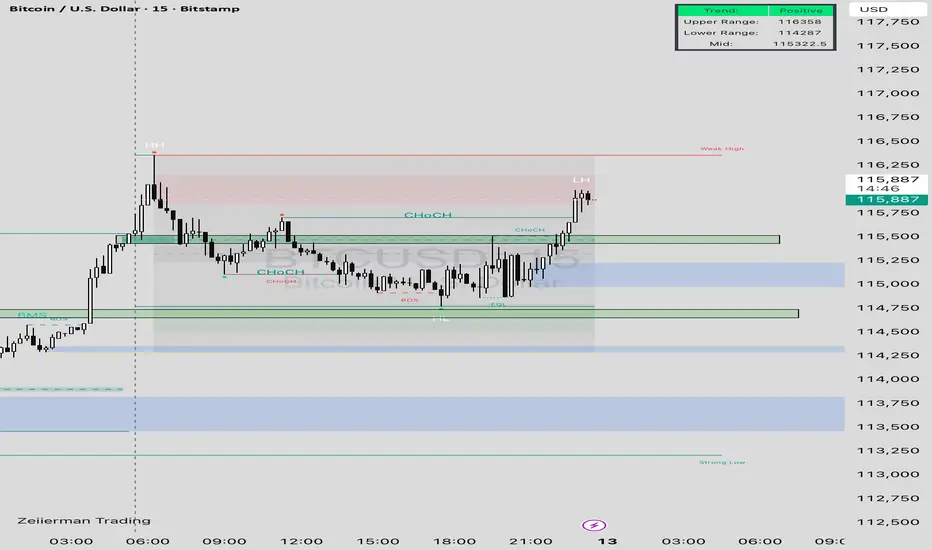
Bitcoin (BTC/USD) 15-Minute Market Structure Analysis – Sept 12,This 15-minute Bitcoin chart highlights a positive market trend with current price action at $115,896 (+0.31%). The structure shows a recent Change of Character (ChoCH) and Break of Structure (BOS), indicating bullish momentum after reclaiming support near 114,750. The price is testing the 116,000 resistance zone, marked by a weak high (HH) and lower high (LH) structure. Key levels are defined with:
• Upper Range : 116,358
• Lower Range: 114,287
• Midpoint: 115,322.5
The chart suggests possible liquidity grabs near the weak high and continuation toward the upper range if bullish momentum holds, while failure could retest demand zones around 115,000–114,750.
OANDA:BTCUSD
Part 1 Ride The Big MovesWhat is an Option?
An option is a financial contract that gives the buyer the right, but not the obligation, to buy or sell an underlying asset at a predetermined price (called the strike price) on or before a specific date (called the expiry date).
There are two main types of options:
Call Option – Gives the buyer the right to buy the underlying asset.
Put Option – Gives the buyer the right to sell the underlying asset.
Example:
If you buy a call option on stock XYZ with a strike price of ₹500, you can buy the stock at ₹500 even if the market price rises to ₹600.
If you buy a put option on stock XYZ at ₹500, you can sell it at ₹500 even if the market price falls to ₹400.
How Options Work
Call Option Buyer: Expects the price to rise. Pays a premium upfront. Profit = Unlimited (price can rise indefinitely) – Premium paid. Loss = Premium paid (if price falls below strike).
Put Option Buyer: Expects the price to fall. Pays a premium upfront. Profit = Strike – Price (max is strike – 0) – Premium paid. Loss = Premium paid.
Option Seller (Writer): Receives the premium. Takes obligation to buy/sell if the buyer exercises. Risk = Can be unlimited for call sellers.
Factors Affecting Option Prices (Option Greeks)
Option price is influenced by:
Delta (Δ) – How much the option price moves with a 1-point move in underlying.
Gamma (Γ) – How fast delta changes with underlying price.
Theta (Θ) – Time decay; how much value the option loses each day.
Vega (V) – Sensitivity to volatility in the underlying asset.
Rho (ρ) – Sensitivity to interest rates.
Tip: Time decay is crucial – options lose value as expiry approaches if the underlying doesn’t move favorably.

Bitcoin Bybit chart analysis September 11 (CPI)Hello
It's a Bitcoin Guide.
If you "follow"
You can receive real-time movement paths and comment notifications on major sections.
If my analysis was helpful,
Please click the booster button at the bottom.
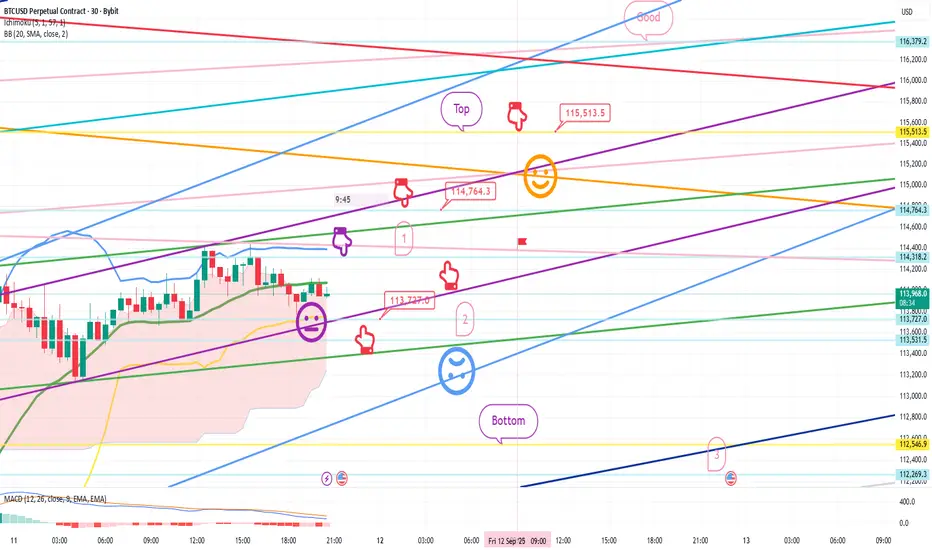
This is Bitcoin's 30-minute chart.
The CPI indicator will be released shortly at 9:30 AM.
I implemented the strategy based on Nasdaq movements.
*When the red finger moves,
Long position strategy
Confirm the upward wave by touching the first section above (autonomous shorting)
1. $113,727 long position entry point / Stop loss if the light blue support line is broken
2. $114,764.3 long position 1st target -> Top 2nd -> Good 3rd target
If the daily candlestick forms before 9:00 AM tomorrow,
you can switch to a short position if the top section is touched.
You can also use the first section shown as a long position switching point.
If the price falls immediately without touching the purple finger at the top, the final long position is at the second level. The strategy was to place a stop-loss order from the breakout of the light blue support line until the possibility of a sideways movement.
From the breakout of the light blue support line, the price opens up to the bottom -> level 3, so long positions should be cautious.
Please use my analysis to this point for reference only.
I hope you operate safely, adhering to principled trading and a stop-loss order.
Thank you.
Trading Errors That Separate Winners from Losers1. Lack of a Trading Plan
One of the most glaring differences between winning and losing traders is the presence—or absence—of a clear trading plan.
Winners: Enter the market with a plan that covers entry criteria, exit points, risk tolerance, and position sizing. They know exactly why they are entering a trade and under what conditions they will exit, win or lose.
Losers: Trade impulsively, often chasing tips, reacting to news, or “winging it” based on emotions. Without predefined rules, they rely on hope and gut feelings, which are inconsistent and unreliable.
Think of it like driving without a destination or map—you may move, but you’re likely to get lost. Trading without a plan is essentially gambling.
2. Ignoring Risk Management
Risk management is often called the “holy grail” of trading. It is not glamorous, but it determines survival.
Winners: Risk only a small portion of their capital on each trade (often 1–2%). They use stop-loss orders, hedge positions, and understand the risk-reward ratio before entering a trade. They think in probabilities and know that protecting capital is more important than chasing quick gains.
Losers: Risk far too much on a single trade, sometimes even their entire account. They move stop-loss levels farther to avoid taking a small loss, only to suffer a devastating one later. A few bad trades can wipe out months or years of effort.
A classic rule says: “Take care of the downside, and the upside will take care of itself.” Winners live by this; losers ignore it.
3. Overtrading
Overtrading is one of the most common traps for beginners.
Winners: Understand that patience pays. They wait for high-probability setups, sometimes taking just a handful of trades in a week or month. They trade less, but smarter.
Losers: Feel the need to be in the market constantly. They confuse activity with productivity, opening positions based on boredom, fear of missing out (FOMO), or the illusion that “more trades = more profit.”
Overtrading not only increases transaction costs but also magnifies exposure to emotional mistakes.
4. Emotional Decision-Making
Markets are emotional arenas, and controlling psychology is as important as technical skill.
Winners: Maintain discipline and detach emotionally from trades. They accept losses as part of the business and move on without revenge-trading.
Losers: Allow fear, greed, hope, or frustration to dictate their moves. A small loss triggers panic. A big win creates overconfidence, leading to reckless bets. They chase losses, double down, or refuse to cut losers, turning manageable mistakes into disasters.
The famous trader Paul Tudor Jones once said: “Losers average losers.” This reflects the emotional trap of holding on to bad trades instead of accepting defeat.
5. Lack of Education and Preparation
Trading looks deceptively simple. Charts, news, and platforms are accessible to anyone. But without a strong foundation, losses are inevitable.
Winners: Invest time in education, study market structure, read books, analyze charts, and even backtest strategies. They treat trading as a profession, not a hobby.
Losers: Jump into markets unprepared, lured by promises of quick riches. They copy strategies without understanding them, rely on social media tips, or trade based on rumors.
In any competitive field—sports, medicine, law—training is essential. Trading is no different. Lack of preparation ensures failure.
6. Failure to Adapt
Markets are dynamic. What works today may not work tomorrow.
Winners: Adapt strategies to evolving conditions. If volatility rises, they adjust position sizing. If market structure changes, they reevaluate systems. They are flexible, constantly learning and evolving.
Losers: Stick rigidly to outdated methods or strategies, even when evidence shows they no longer work. They resist change, hoping markets will return to conditions where their strategy worked.
Adaptability is survival. Dinosaurs didn’t adapt and went extinct. Traders who fail to adapt face the same fate.
7. Neglecting the Importance of Psychology
Many traders focus only on technical indicators or news but ignore the psychology of trading.
Winners: Develop strong mental frameworks—discipline, patience, resilience. They understand cognitive biases like loss aversion, confirmation bias, and recency bias, and work to minimize their impact.
Losers: Are controlled by psychological traps. They believe they’re always right, seek only confirming evidence, and fear taking losses. This mindset sabotages even good strategies.
Trading is 80% psychology and 20% technique. Those who underestimate this imbalance often lose.
8. Unrealistic Expectations
Another error that separates losers from winners is expectation management.
Winners: Aim for consistent returns, not overnight riches. They understand compounding and set achievable goals. For them, trading is a marathon, not a sprint.
Losers: Expect to double their money every week, quit jobs overnight, or become millionaires in months. Such expectations lead to overleveraging, impulsive trades, and eventual ruin.
The harsh truth: trading is not a get-rich-quick scheme. Those who see it that way rarely last.
9. Ignoring Journal Keeping and Review
One of the simplest but most powerful tools in trading is a trading journal.
Winners: Keep detailed records of trades, including entry/exit, reasoning, emotions, and outcomes. They review mistakes, identify patterns, and refine strategies.
Losers: Don’t track trades. They forget mistakes, repeat them, and fail to see patterns of error.
Reviewing a journal is like a coach analyzing a game replay—it highlights strengths and weaknesses that cannot be seen in the heat of the moment.
10. Misuse of Leverage
Leverage magnifies both gains and losses.
Winners: Use leverage cautiously, only when setups are highly favorable. They ensure their accounts can handle drawdowns without panic.
Losers: Abuse leverage, turning small moves against them into catastrophic losses. They view leverage as a shortcut to quick profits, forgetting it’s a double-edged sword.
Many traders don’t fail because they are wrong, but because they are overleveraged when wrong.
11. Blindly Following Others
In today’s world, tips, social media, and chat groups flood traders with “advice.”
Winners: May listen to others but always do their own research before acting. They know that ultimately, their money is their responsibility.
Losers: Follow every tip or influencer without analysis. They jump on hype-driven moves, often buying at tops and selling at bottoms.
The herd mentality is strong in markets, but as Warren Buffett says: “Be fearful when others are greedy, and greedy when others are fearful.”
12. Lack of Patience and Discipline
Trading rewards patience and punishes impatience.
Winners: Can wait days or weeks for a setup that matches their rules. They avoid shortcuts and stick to discipline.
Losers: Want instant results. They break rules, enter trades prematurely, and exit too early out of fear.
Impatience turns strategy into chaos. Discipline turns chaos into consistency.
Conclusion: Turning Errors into Edges
The line between winning and losing traders isn’t about intelligence, luck, or even access to capital. It’s about behavior, discipline, and error management. Winners aren’t error-free—they simply make fewer critical mistakes and learn from every one. Losers repeat the same destructive errors until their capital or confidence runs out.
To move from losing to winning:
Create and follow a trading plan.
Prioritize risk management over profit.
Develop patience, discipline, and emotional control.
Treat trading as a profession—study, practice, and adapt.
Journal and review trades consistently.
The markets will always test you. But by avoiding these errors, you’ll stand among the minority who consistently extract profits rather than donate them.
BTC - LONGBitcoin has broken above the 200 EMA, confirming bullish bias.Price is supported by the 10 & 20 EMA crossover (short-term bullish trend). As long as BTC holds above $115,000, upside targets are $117,600 and then $120,000. If it loses $115,000, caution — the bullish setup may fail.

Trading in BTC Ideas for profitsThe "90% rule" in trading is a general observation, often called the 90/90/90 rule, which states that 90% of new traders lose 90% of their initial capital within the first 90 days of trading. This rule serves as a cautionary concept, highlighting the high failure rate among novice traders due to a lack of proper education, poor risk management, and emotional decision-making, rather than being a precise statistic

Bitcoin (BTC/USD) Outlook – 4H ChartBitcoin is showing strong bullish structure while trading around $114,200, respecting its ascending channel and aiming higher.
🔎 Bullish Signals:
Ascending Channel:
Price is moving within a clear upward channel, signaling a steady uptrend.
Support Confirmation:
Strong demand zone holding around $113,700 – $114,000.
As long as this level is protected, bulls remain in control.
Upside Targets:
$114,800 – First breakout resistance.
$115,900 – $116,200 – Key supply zone (once cleared, momentum may accelerate).
$117,200 – Next bullish extension target inside the channel.
Momentum Bias:
Candles are forming higher highs & higher lows – a classic bullish continuation pattern.
📌 Bullish Trading Plan:
Above $114K: Upside move towards $114.8K → $115.9K → $117.2K.
Only if $113.7K breaks: Short-term retracement possible, but bias stays bullish inside channel.
#BTC #Crypto #BitcoinAnalysis #BTCUSD #CryptoTrading

BTCUSD 1D Time frame📈 Price Action
Previous Close: $113,897.00
Day’s Range: $112,204.00 – $114,451.00
Current Price: $113,897.00
🔧 Technical Indicators
Relative Strength Index (14): 55.39 — Indicates neutral momentum.
MACD: Positive — Suggests upward trend.
Moving Averages:
5-day MA: $112,545.50
20-day MA: $112,519.63
50-day MA: $114,828.28
100-day MA: $109,519.30
200-day MA: $101,144.13
Stochastic Oscillator (14): 67.91% — Indicates bullish momentum.
Average True Range (ATR): $3,177.03 — Suggests moderate volatility.
Directional Movement Index (ADX): 10.23 — Indicates a weak trend.
📊 Support & Resistance Levels
Immediate Support: $112,000
Immediate Resistance: $115,000
🧠 Trend Analysis
Trend: Neutral to bullish
Momentum: Positive
Volatility: Moderate
Summary: Bitcoin is currently trading near $113,897, showing a neutral to bullish trend with positive momentum. The 50-day moving average is above the current price, indicating potential upward movement. Traders should monitor the support level at $112,000 and resistance at $115,000 for potential breakout opportunities.
