Part 8 Trading Masterclass With ExpertsReal-Life Example – Hedging a Portfolio
Suppose you hold ₹5,00,000 worth of Indian equities. You worry about a market correction. Instead of selling your holdings, you buy Nifty Put Options as insurance.
Nifty at 20,000
You buy Put Option at Strike 19,800, Premium = 200 × 50 lot = ₹10,000.
If Nifty falls to 19,000:
Put gains = (19,800 – 19,000) × 50 = ₹40,000
Your portfolio loss is partially offset by option profit.
This is how professionals use options for protection.
Psychological Aspects of Options Trading
Options trading is as much about mindset as knowledge:
Stay disciplined. Don’t chase every trade.
Accept losses—they’re part of the game.
Avoid greed—taking profits early is better than losing them later.
Learn patience—sometimes the best trade is no trade.
Options trading is a powerful tool in the world of financial markets. For beginners, it may look overwhelming, but once broken down into clear concepts, options are simply another way to express your view on the market. Whether you want to speculate, hedge, or generate income, options offer flexibility that stocks alone cannot match.
The key for beginners is education + risk management + practice. Start small, learn continuously, and slowly expand your strategies. Over time, you’ll realize that options aren’t scary—they’re opportunities waiting to be unlocked.
With the right approach, options trading can transform your trading journey, making you not just a participant in the markets, but a smart strategist who uses every tool available.
BTCUSD.PI trade ideas

BTC developing a good sell opportunityBTC is moving in range for long time. Now it has shown a displacement after ChoCH and formed a bearish 15m FVG. There may be a good trade at sell side if price approach it. Well there are two trade scenarios are forming.
1. Price moves to 15m FVG and OTE overlap zone.
2. Most probably price will take liquidity of FVG and OTE zone and create MSS in LTF.
3. After breaking trend line it should pullback till FVG/trend line or any newly created OB/FVG.
All these combinations are signalling a high probability and high Risk and Reward (1:8) trade scenario.
Note – if you liked this analysis, please boost the idea so that other can also get benefit of it. Also follow me for notification for incoming ideas.
Also Feel free to comment if you have any input to share.
Disclaimer – This analysis is just for education purpose not any trading suggestion. Please take the trade at your own risk and with the discussion with your financial advisor.

Momentum Trading1. What is Momentum Trading?
Momentum trading is a short- to medium-term trading strategy that seeks to capitalize on existing price trends. Instead of trying to predict reversals, momentum traders look to “go with the flow.”
If a stock is rising on strong demand, momentum traders buy it expecting further upside.
If a stock is falling with heavy selling pressure, momentum traders short it anticipating deeper declines.
The core principle is captured in the phrase: “The trend is your friend—until it ends.”
Key Features of Momentum Trading:
Trend Following Nature: It follows short- or medium-term price trends.
Time Horizon: Typically days, weeks, or months (shorter than investing, longer than scalping).
High Turnover: Traders frequently enter and exit positions.
Reliance on Technicals: Heavy use of charts, indicators, and price action rather than fundamentals.
Psychological Driver: Momentum feeds on crowd behavior—fear of missing out (FOMO) and herd mentality.
2. The Theoretical Foundation
Momentum trading is not just a market fad. It is supported by both behavioral finance and empirical evidence.
a) Behavioral Explanation
Investor Herding: Investors often chase rising assets, amplifying the trend.
Anchoring & Confirmation Bias: Traders justify existing moves instead of challenging them.
Overreaction: News or earnings surprises create outsized reactions that persist.
b) Empirical Evidence
Academic studies (notably Jegadeesh & Titman, 1993) have shown that stocks with high past returns tend to outperform in the near future. Momentum is a recognized market anomaly that challenges the Efficient Market Hypothesis (EMH).
c) Physics Analogy
Borrowed from physics, “momentum” suggests that a moving object (in this case, price) continues in its trajectory unless acted upon by external forces (news, earnings, or macro shocks).
3. Tools of Momentum Trading
Momentum traders rely heavily on technical analysis. Here are the most widely used tools:
a) Moving Averages
Simple Moving Average (SMA) and Exponential Moving Average (EMA) smooth price action and help spot trends.
Crossovers (e.g., 50-day EMA crossing above 200-day EMA) indicate bullish momentum.
b) Relative Strength Index (RSI)
Measures speed and magnitude of price changes.
RSI above 70 → Overbought (possible reversal).
RSI below 30 → Oversold (possible bounce).
c) Moving Average Convergence Divergence (MACD)
Shows momentum shifts via difference between two EMAs.
A bullish signal arises when MACD line crosses above the signal line.
d) Volume Analysis
Momentum without volume is weak.
Rising prices with high volume = strong momentum.
Divergence between price and volume warns of exhaustion.
e) Breakouts
Prices breaking above resistance or below support often spark momentum moves.
Traders enter on breakout confirmation.
f) Relative Strength (vs Market or Sector)
Stocks outperforming their index peers often display sustainable momentum.
4. Types of Momentum Trading
Momentum trading is not monolithic. Strategies vary depending on timeframes and style.
a) Intraday Momentum Trading
Captures short bursts of momentum within a trading session.
Driven by news, earnings, or opening range breakouts.
Requires fast execution and strict stop-loss discipline.
b) Swing Momentum Trading
Holds positions for several days to weeks.
Relies on technical setups like flags, pennants, and breakouts.
Less stressful than intraday but requires patience.
c) Position Momentum Trading
Longer-term trend riding (weeks to months).
Relies on moving averages and macro catalysts.
Used by professional traders and hedge funds.
d) Sector or Thematic Momentum
Traders focus on hot sectors (e.g., AI stocks, renewable energy, defense).
Strong sector momentum amplifies individual stock trends.
5. Steps in Momentum Trading
Step 1: Idea Generation
Screeners identify stocks with high relative strength, unusual volume, or new highs/lows.
Step 2: Entry Strategy
Buy during a confirmed breakout.
Enter after consolidation within an uptrend.
Use RSI/MACD confirmation.
Step 3: Risk Management
Place stop-loss below support or recent swing low.
Position size carefully (2–3% of portfolio risk per trade).
Step 4: Exit Strategy
Exit when trend weakens (moving average crossover, bearish divergence).
Book partial profits as price extends far from moving averages.
Step 5: Review & Adapt
Analyze past trades to refine strategy.
6. Psychology of Momentum
Momentum is deeply linked with market psychology.
Fear of Missing Out (FOMO): Traders chase rising assets.
Confirmation Bias: Investors justify price moves with narratives.
Greed and Overconfidence: Leads to over-leveraging in trending markets.
Panic Selling: Accelerates downward momentum.
Understanding these forces helps traders anticipate crowd behavior.
7. Advantages of Momentum Trading
High Profit Potential: Strong trends can deliver outsized returns in short periods.
Flexibility: Works across asset classes—stocks, forex, commodities, crypto.
Clear Rules: Entry and exit are based on technical signals.
Exploits Market Inefficiencies: Captures persistent trends ignored by fundamentals.
8. Risks and Challenges
Trend Reversals: Sudden reversals can cause sharp losses.
False Breakouts: Price may fail to sustain moves, trapping traders.
High Transaction Costs: Frequent trading leads to commissions and slippage.
Emotional Stress: Fast decisions can lead to mistakes.
Overcrowding: When too many traders chase momentum, reversals become violent.
9. Risk Management in Momentum Trading
Momentum trading is risky without strict controls:
Stop-loss Orders: Essential to protect capital.
Trailing Stops: Lock in profits while letting trends run.
Position Sizing: Never risk more than 1–2% of portfolio per trade.
Diversification: Spread momentum bets across assets.
Avoid Overtrading: Quality over quantity.
10. Momentum in Different Markets
a) Equity Markets
Most popular application.
Works best in growth stocks and small/mid-cap names.
b) Forex
Momentum driven by economic releases, central bank decisions, geopolitical risks.
c) Commodities
Momentum thrives on supply-demand imbalances (oil, gold).
d) Cryptocurrencies
Momentum is extreme due to speculative nature and retail participation.
Conclusion
Momentum trading is a blend of science and art—mathematics, psychology, and market intuition. Its power lies in its ability to capture sustained moves fueled by collective human behavior.
Yet, it is not without risks. Momentum reversals can be brutal, requiring traders to maintain discipline, use stop-losses, and avoid emotional decisions.
For those who can balance courage with caution, momentum trading offers one of the most exciting paths in financial markets. It rewards quick thinking, technical mastery, and psychological resilience.
In the end, momentum is the pulse of markets—it reflects fear, greed, and human emotion in motion. By learning to read and ride that pulse, traders position themselves not just as participants, but as masters of the market’s rhythm.

Bitcoin – H4 Mid-Term AnalysisBitcoin – H4 Mid-Term Analysis
Hello Traders,
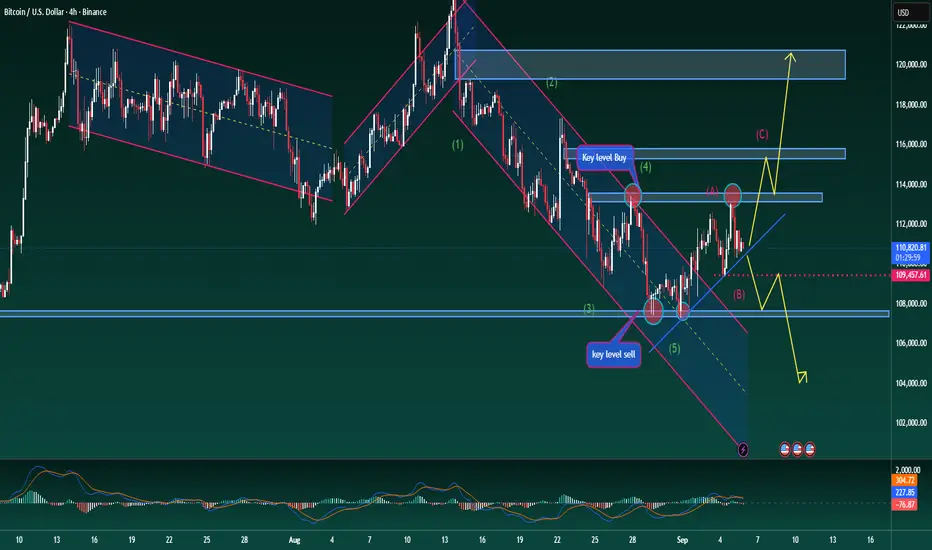
Bitcoin continues to trade within a wide sideways range. Despite the spike in volume following the recent NFP release, the market has not yet confirmed a dominant trend. Price action is still rotating within the 107k – 113k zone.
Elliott Wave Perspective
Wave 5 appears to have completed, and an A–B corrective structure is taking shape. This opens the possibility for one more upward leg before the next decisive move develops.
Trendline & Key Levels
A descending trendline is currently acting as resistance. It may offer early short opportunities, though a clear break below 107k is required to confirm a mid-term bearish outlook.
On the flip side, if price respects the trendline and bounces higher, a wave C rally could unfold.
Importantly, BTC is still holding above the rising channel, suggesting that bearish momentum remains limited for now.
Scenarios to Watch
Bullish Case:
If Bitcoin sustains above 107k and manages a breakout above 113k, momentum could extend towards 115k – 118k. Long positions can be considered once confirmation comes from stronger volume or a MACD crossover.
Bearish Case:
Failure to hold above 107k would expose the market to further downside, targeting 104k – 101k where strong historical support is located.
Professional Take
The market remains indecisive in the mid-term, with no clear directional bias yet. Traders should closely watch the reaction at 107k and the descending trendline to determine the next move. Flexibility and strict risk management are essential in this phase of heightened volatility.
“Bitcoin Price Action: Liquidity Grab Fuels Next Bullish Impulse“Bitcoin Price Action: Liquidity Grab Fuels Next Bullish Impulse 📈”
Hello Traders & Investors,
Let’s take a closer look at BTCUSD from both a structural and liquidity perspective.
🔹 Market Structure
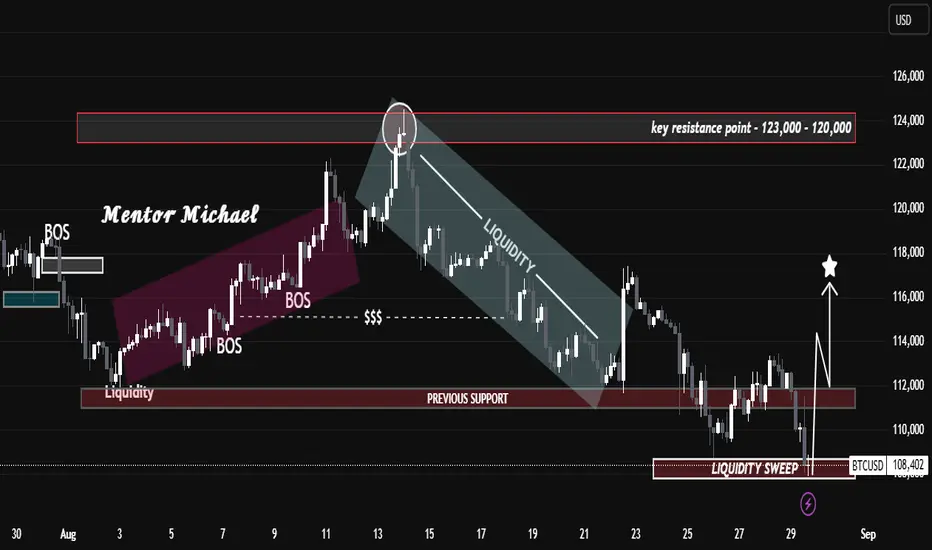
The chart shows that after a strong bullish leg into mid-August, BTCUSD faced heavy rejection from the 120,000 – 123,000 resistance zone, which remains the most important supply area on the chart. This rejection triggered a clear Break of Structure (BOS), leading to a correction and liquidity grab.
Recently, price created a liquidity sweep in the 108,000 – 110,000 region, trapping late sellers and collecting orders from beneath previous lows. Following that, BTCUSD reclaimed the 111,000 – 112,000 zone, confirming it as new support.
🔹 Liquidity & Smart Money Behavior
The downside sweep indicates accumulation, where smart money entered long positions.
Liquidity resting above current levels (towards 116,000 → 120,000) is now the most likely target for price.
The previous liquidity channel to the downside has been fully absorbed, shifting bias toward bullish continuation.
🔹 Key Levels to Watch
Support: 111,000 – 112,000 (liquidity sweep + reclaimed support).
Resistance: 120,000 – 123,000 (major supply and reaction zone).
🔹 Projection
As long as BTCUSD holds above 111,000, my bias remains bullish. The next objective lies at the 120,000 zone, which aligns with untested supply and prior rejection levels. However, traders should be prepared for a reaction or short-term retracement once this area is tested.
✅ Conclusion:
BTCUSD has shown strength after sweeping liquidity from the downside. The structure now supports a bullish push toward 120,000, provided 111,000 support continues to hold. This remains a critical level for validation of further upside.

Option Trading The Mechanics of Option Pricing
1. Intrinsic Value vs. Time Value
Intrinsic Value: The profit if the option were exercised now.
Time Value: The extra value due to remaining time until expiry.
Option Premium = Intrinsic Value + Time Value.
2. Moneyness of Options
In the Money (ITM): Immediate profit if exercised.
At the Money (ATM): Strike ≈ Current price.
Out of the Money (OTM): No immediate profit, only time value.
3. Option Greeks (The DNA of Options)
Delta: Sensitivity of option price to underlying movement.
Gamma: Sensitivity of Delta to underlying movement.
Theta: Time decay – options lose value as expiry nears.
Vega: Sensitivity to volatility.
Rho: Sensitivity to interest rates.
Understanding Greeks is critical for advanced traders.
Risks in Option Trading
Options are not risk-free.
Premium Decay (Theta Risk): Options lose value daily.
Volatility Risk: Implied volatility crush can hurt positions.
Liquidity Risk: Wide bid-ask spreads increase costs.
Assignment Risk: Writers can be forced to fulfill contracts.
Unlimited Losses: Naked option selling is dangerous.

Bitcoin Bybit chart analysis September 3Hello
It's a Bitcoin Guide.
If you "follow"
You can receive real-time movement paths and comment notifications on major sections.
If my analysis was helpful,
Please click the booster button at the bottom.
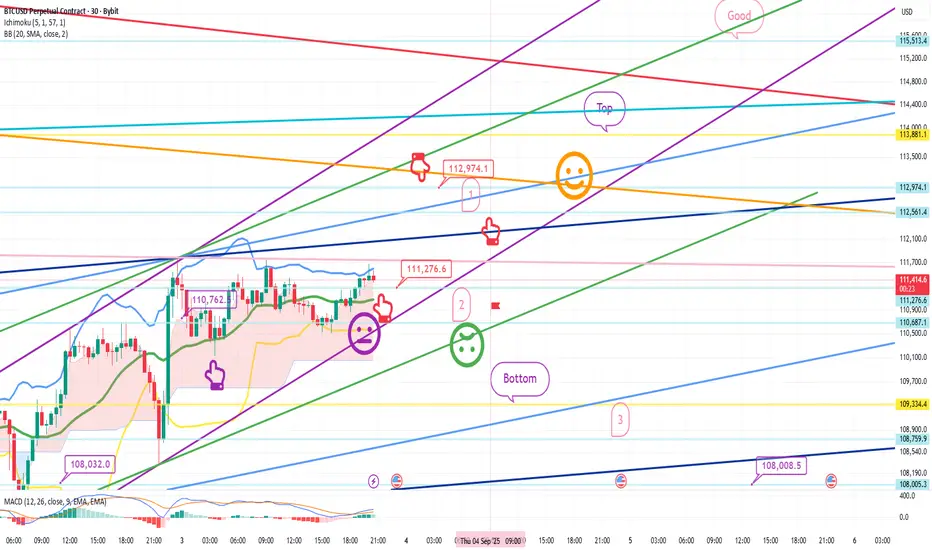
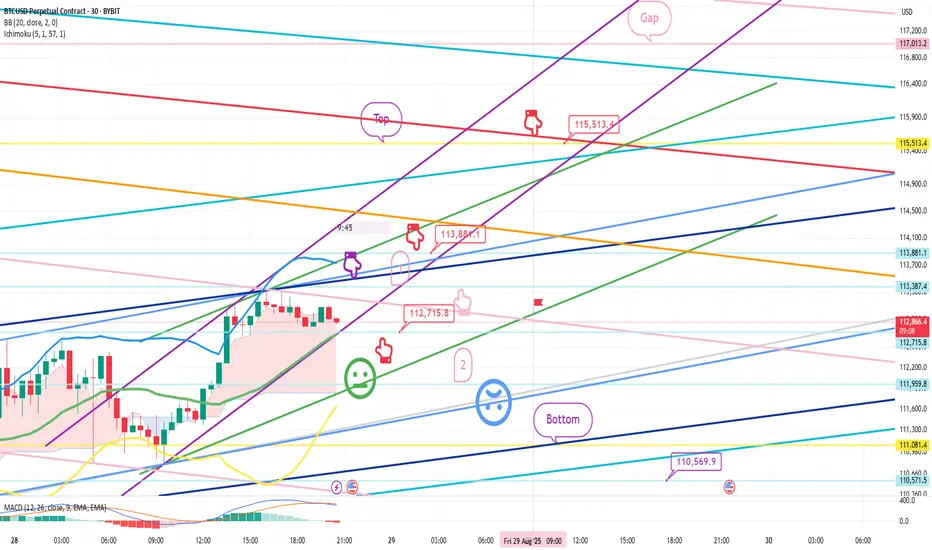
This is a Bitcoin 30-minute chart.
The Nasdaq indicators will be released at 11:00 AM.
At the bottom left is the long position entry point from the 1st, $108.032.
Above that is the purple finger at $110,762.5.
I've linked the strategy to the long position re-entry point.
*If the red finger follows the path,
it's a one-way long position strategy.
1. Long position entry point at $111,276.6 / Stop loss if the green support line is broken.
If the price falls sharply from the current level,
it's a long position waiting point up to section 2.
If the price touches or breaks the green support line,
it breaks the short-term pattern, which is not a good strategy for long positions.
2. Long position at $112,974.1, first target -> top section, second target
When it reaches 112.9K, the first section is the upper section for re-entry into a long position.
The uptrend line is the green support line -> the deep blue support line.
From the second section, it could fall to the bottom -> the third section -> 108K.
From the deep blue support line,
a medium- to long-term correction and sideways trading may follow, so please keep this in mind.
As long as the Nasdaq doesn't crash today, that's fine.
Please use my analysis as a reference only.
I hope you operate safely, with a strict trading strategy and stop-loss orders.
Thank you.
BTCUSD FORMING INVERSE HEAD & SHOULDER In hourly chart BTC forming inverse head and shoulder pattern which is clearely visible.
> theren is break out seen in this chart.
> target as well as support/resistance T1,T2 & S1,S2 is mentioned here
> this is just for information not buy/sell call.

BITCOINbitcoin creat higher high & lower low ,bitcoin cmo 110649 rasistance zone 119000 to 120800 lower side target 99550 risk reward 1:1

Part 6 Learn Institutional Trading Deep Dive into Option Strategies
One of the biggest advantages of options is the ability to combine them into structured strategies. Let’s expand on some common and advanced ones:
A. Single-Leg Strategies
These involve buying or selling just one option.
Long Call: Buy a call option expecting prices to rise.
Low risk (limited to premium paid).
High reward if stock surges.
Long Put: Buy a put option expecting prices to fall.
Best for bearish outlook.
Acts as portfolio insurance.
Short Call (Naked Call): Sell a call without owning stock.
You receive premium.
Unlimited risk if stock rises sharply.
Short Put (Naked Put): Sell a put option.
You receive premium.
Big risk if stock collapses.
B. Multi-Leg Strategies (Spreads & Hedging)
Bull Call Spread: Buy a lower strike call & sell a higher strike call.
Profits if stock rises moderately.
Lower risk than naked call.
Bear Put Spread: Buy higher strike put & sell lower strike put.
Works in moderately bearish markets.
Covered Call: Own stock + sell call option.
Generates steady income.
Capped upside potential.
Protective Put: Own stock + buy put option.
Insurance against stock falling.

Part 4 Learn Institutional Trading Option Greeks (Risk Measures)
Greeks are mathematical tools that measure how sensitive an option is to different factors:
Delta: Sensitivity to price change. (How much option moves if stock moves ₹1).
Gamma: Rate of change of delta.
Theta: Time decay (how much option loses value as expiry nears).
Vega: Sensitivity to volatility.
Rho: Sensitivity to interest rates.
Traders use Greeks to build precise strategies.
Option Strategies
Options can be combined into powerful strategies:
Single-leg: Buy call, Buy put, Sell call, Sell put.
Spreads: Bull call spread, Bear put spread.
Neutral strategies: Iron condor, Butterfly spread, Straddle, Strangle.
Advanced: Calendar spread, Ratio spread.
Each strategy suits different market conditions (bullish, bearish, sideways, volatile).

Retail vs Institutional Trading1. Defining Retail and Institutional Trading
1.1 Retail Trading
Retail traders are individual investors who buy and sell financial instruments with their personal money. They typically trade via online brokerage accounts or traditional brokers, using platforms like Zerodha, Robinhood, Charles Schwab, Fidelity, or Interactive Brokers.
Characteristics of retail traders:
Small capital size (from a few hundred dollars to a few lakh/ thousands).
Shorter time horizons, often focusing on short-term gains or personal investment goals.
Use of simplified platforms and basic tools.
Limited access to insider research or advanced market data.
Highly influenced by news, social media, or trends.
1.2 Institutional Trading
Institutional traders are large organizations that trade on behalf of clients, funds, or corporations. Examples include mutual funds, hedge funds, pension funds, insurance companies, sovereign wealth funds, and investment banks.
Characteristics of institutional traders:
Massive capital base, often billions of dollars.
Longer time horizons, though hedge funds may also engage in short-term or high-frequency trading.
Access to advanced research, analytics, and algorithmic trading systems.
Ability to negotiate better fees, spreads, and execution rates.
Often influence market prices due to the sheer size of their trades.
2. Scale of Operations
The most obvious difference between retail and institutional trading is scale.
A retail trader may buy 50 shares of Apple or a few lots of Nifty futures.
An institutional trader might purchase millions of shares or manage portfolios worth tens of billions.
This scale difference creates unique dynamics:
Institutions cannot move in and out of positions easily without affecting prices.
Retail traders, due to their small size, enjoy agility and can enter/exit positions quickly.
3. Tools and Technology
3.1 Retail Traders
Retail traders typically rely on:
Trading apps (e.g., Zerodha Kite, Robinhood, TD Ameritrade).
Technical indicators like moving averages, RSI, MACD.
Basic charting platforms (TradingView, MetaTrader).
Limited access to real-time institutional data.
3.2 Institutional Traders
Institutional traders operate on another level with:
Algorithmic and High-Frequency Trading (HFT) systems.
Proprietary trading models, AI, and machine learning.
Direct market access (DMA) with ultra-low latency.
Bloomberg terminals and advanced risk management dashboards.
Teams of analysts and quants for research.
Thus, while retail trading is often manual and discretionary, institutional trading is increasingly automated and systematic.
4. Market Impact
4.1 Institutional Impact
When an institution places a trade worth hundreds of millions, it can move the market price significantly. For example, if BlackRock decides to buy a large stake in a company, the stock may rise due to sudden demand.
4.2 Retail Impact
Retail traders usually have minimal market-moving power individually. However, when retail traders act collectively—such as the GameStop short squeeze of 2021—they can move markets in dramatic ways.
5. Trading Strategies
5.1 Retail Trading Strategies
Swing trading: Holding for days/weeks.
Day trading: Multiple intraday trades.
Options trading: Buying calls/puts with limited risk.
Trend following: Using technical indicators.
News-based trading: Reacting to announcements.
Retail traders often focus on simplicity and quick gains.
5.2 Institutional Trading Strategies
Quantitative trading: Using complex mathematical models.
High-frequency trading (HFT): Thousands of trades in milliseconds.
Arbitrage: Exploiting price differences across markets.
Long-term value investing: Buying undervalued assets for decades.
Hedging: Managing risk for clients.
Institutions play a more diverse and sophisticated game, balancing risk with return.
6. Advantages and Disadvantages
6.1 Retail Traders – Advantages
Agility: Small size means quick exits.
Independence: Can take risks institutions cannot.
Accessibility: Online trading platforms allow low entry barriers.
Potential for outsized gains: A single bet can multiply wealth.
6.2 Retail Traders – Disadvantages
Lack of information edge.
Higher fees/spreads compared to institutions.
Emotional decision-making (fear & greed).
Susceptible to scams, herd mentality, or misinformation.
6.3 Institutional Traders – Advantages
Access to best research, tools, and liquidity.
Negotiated low transaction costs.
Economies of scale.
Ability to influence companies (activist investing).
6.4 Institutional Traders – Disadvantages
Too large to be nimble—cannot exit quickly.
Market scrutiny from regulators.
Pressure to perform consistently for clients.
Vulnerable to systemic risks (2008 crisis showed big funds collapsing).
7. Psychology of Trading
Retail traders often suffer from emotional biases: fear of missing out (FOMO), panic selling, or chasing hype stocks.
Institutional traders follow more disciplined, rule-based systems with committees and checks to reduce emotional influence.
However, even institutions are not immune to herding behavior—when many funds chase the same trend (dot-com bubble, crypto mania).
8. Regulatory Environment
Retail trading is regulated to protect small investors from fraud and unfair practices.
Institutional trading is regulated to prevent market manipulation, insider trading, and systemic risks.
Regulators such as SEBI (India), SEC (U.S.), FCA (UK) ensure fair play across both sides.
9. Retail vs Institutional in Emerging Markets
In markets like India, Brazil, and Southeast Asia, retail participation has exploded due to:
Mobile apps and digital brokers.
Increased financial literacy.
Rising disposable incomes.
At the same time, institutions (domestic mutual funds, FIIs) dominate long-term flows. The push-pull between retail excitement and institutional discipline often drives volatility.
10. Case Studies
10.1 GameStop Mania (2021)
Retail traders on Reddit’s WallStreetBets drove a short squeeze against hedge funds, showing retail’s collective power.
10.2 2008 Global Financial Crisis
Institutional excesses in mortgage-backed securities triggered a meltdown, proving that large-scale institutional risks can destabilize the entire global economy.
10.3 Indian Markets (2020–2022)
Post-COVID, Indian retail investors surged through platforms like Zerodha and Groww, increasing direct retail ownership of equities. However, FIIs (Foreign Institutional Investors) still dominate net flows.
Conclusion
Retail and institutional traders may seem to be playing the same game, but they operate with very different tools, capital, psychology, and strategies.
Retail trading is marked by agility, independence, and passion, but limited by scale and access.
Institutional trading is marked by power, research, and influence, but limited by bureaucracy and systemic exposure.
Both are crucial pillars of the financial markets. Retail provides liquidity, diversity, and vibrancy, while institutions provide stability, scale, and depth.
Ultimately, the relationship between retail and institutional traders is not adversarial but symbiotic—together, they make markets more efficient, liquid, and reflective of global economic realities.
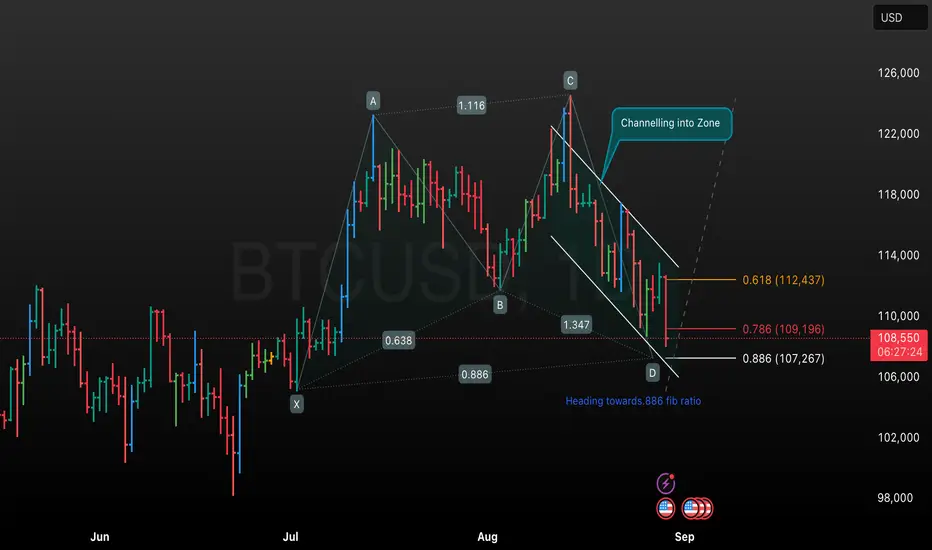
BTCUSD Harmonic Pattern & Fibonacci AnalysisChart Analysis
• The chart uses a harmonic pattern (possibly a Bat or Gartley pattern) marked by the points X, A, B, C, and D, with each leg labeled with its Fibonacci ratio (e.g., AB: 0.638, BC: 1.347, CD targeting 0.886).
• A trend channel is highlighted with the annotation “Channelling into Zone,” indicating price action is moving within a defined support and resistance path downwards.
• The two major Fibonacci retracement/support levels indicated are:
• 0.618 (112,437): This is a classic Fibonacci resistance zone where price may face strong selling pressure if it bounces.
• 0.786 (109,196): Another retracement level and a commonly watched zone for harmonic patterns.
• 0.886 (107,267): This is the final target for the D point in many harmonic patterns (such as a Bat), where a reversal is often anticipated.
• Price is currently at 108,429 USD, trading below both the 0.618 and 0.786 Fibonacci retracement levels, and approaching the 0.886 target, suggesting further downside is possible but a reversal could occur near the D point.
• The overall tone is slightly bearish until price reaches the projected D point (near 107,267), where traders might look for potential long setups if a reversal confirmation appears.
Key Observations
• Bearish channel: The trend is currently down, with price respecting the channel boundaries.
• Fibonacci confluence: Critical Fibonacci levels may offer support/resistance and act as potential reversal zones.
• Pattern completion: A harmonic pattern projects an oversold zone near the 0.886 ratio, often resulting in a corrective or reversal move.
• Watch for reversal confirmation: If price action shows support at or near the 0.886 Fibonacci zone, a bullish reversal is likely according to harmonic trading principles.
This analysis assumes familiarity with harmonic patterns, Fibonacci retracement, and candlestick channels as used in technical trading.
XAUUSD GOLD ANALYSIS ON (03/09/2025)BTCUSD UPDATEDE
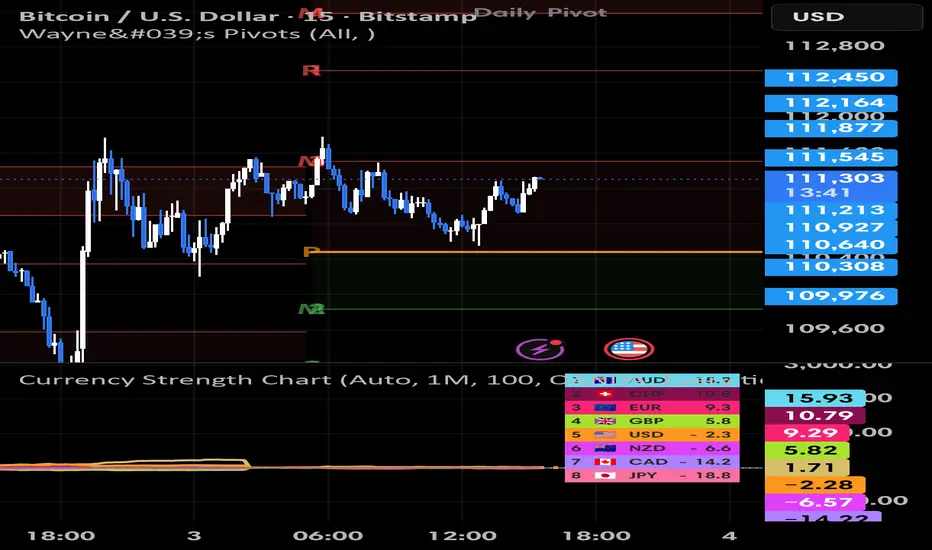
Current price - 112200
If price stay above 109000,then next target 114500,118000,122000 and below that 105000
Plan; if price break 112200-111800 area and above that 112200 area,we will place buy oder in BTCUSD with target of 114500 and 118000 & stop loss should be placed at 109000

Bitcoin bullish breakout possible Bitcoin currently trading at 111250 and trying to test resistance at 111800 level If Bitcoin breaks resistance level then a target of 112450 can be achieved.Similarly if it goes down it can test 109700 level currently if dollar goes bearish today and tomorrow a bullish breakout possible.

Bitcoin – Bearish Scenario Moving as PlannedBitcoin – Bearish Scenario Moving as Planned
Hello traders,
BTC is moving exactly in line with the plan, reacting well within the channel and showing a pullback at the retest of the rising trend. Hopefully many of you managed to catch the short signal shared earlier.
Following the current momentum, BTC is holding well on the downside. The short position can be maintained in the medium term, with the next long zone expected around 105k.
On higher timeframes, BTC still remains in a broader bullish structure, with potential for higher targets from long-term buy zones. However, current market sentiment shows much of the liquidity flowing into gold, so BTC may move more slowly in the short run.
This is my next trading outlook for BTC. Take it as reference, stay patient, and manage your trades with discipline. Do share your views in the comments.

BTC - ShortThe price is currently around $109,930.The chart outlines a gray zone above and a green zone below, representing likely resistance (where sellers may step in) and support (where buyers may be active).
A red shaded area near the current price marks the 50% retracement level—often a key decision point in price action analysis.
The setup shows a potential short trade: traders are betting on prices falling from the 50% retracement level down toward the lower green zone. The stop-loss (gray area) is set above the recent top to limit losses if price rises. The target (green area) is below, aiming for a profit if price drops back toward recent lows.

Liquidity Grab Completed – Bulls Back in Control?Liquidity Grab Completed – Bulls Back in Control?
Key Technical Insights:
Resistance Rejection: Price sharply rejected the 120K – 123K resistance zone, confirming this area as a key supply level.
Bearish Liquidity Flow: After rejection, BTC flowed within a descending liquidity channel, continuously taking out internal supports before finding a base.
Previous Support → Liquidity Sweep: Around 108K, price executed a strong liquidity sweep, triggering stop hunts below prior support, then showing a bullish reaction.
Market Structure Shift Incoming: The sweep suggests a potential accumulation phase, where institutions collect orders before pushing price higher.
Upside Targets: If price holds above the reclaimed support at 112K, bullish momentum could aim for 116K – 118K in the near term ⭐.
⚠️ Risk Consideration: A failure to sustain above 108K would invalidate the bullish outlook, opening room for deeper downside.
📌 Summary:
BTCUSD is transitioning from a liquidity-driven decline into a possible reversal phase. The liquidity sweep at 108K could mark the start of a bullish leg if structure confirms with higher highs. Traders should monitor 112K as the short-term pivot point.
Trading Master Class With ExpertsWhat are Options? (Basics)
An Option is a financial contract between two parties:
Buyer (Holder): Pays a premium for the right (not obligation) to buy/sell.
Seller (Writer): Receives the premium and has an obligation to honor the contract.
There are two basic types:
Call Option (CE) – Right to buy.
Put Option (PE) – Right to sell.
Example:
Suppose Infosys stock is trading at ₹1500. You buy a Call Option with a strike price of ₹1550 expiring in 1 month. If Infosys goes above ₹1550, you can exercise your right to buy at ₹1550 (cheaper than market). If it doesn’t, you just lose the small premium you paid.
This flexibility is the beauty of options.
Key Terms in Options Trading
Before diving deeper, let’s understand some key terms:
Strike Price: The fixed price at which you can buy/sell the asset.
Premium: The price paid to buy the option.
Expiry Date: The date on which the option contract expires.
Lot Size: Options are traded in lots (e.g., 25 shares per lot for Nifty options).
In-the-Money (ITM): When exercising the option is profitable.
Out-of-the-Money (OTM): When exercising would cause a loss.
At-the-Money (ATM): When the strike price = current market price.
Option Buyer: Pays premium, has limited risk but unlimited profit potential.
Option Seller (Writer): Receives premium, has limited profit but unlimited risk.
Types of Options – Calls and Puts
Call Option (CE)
Buyer has the right to buy.
Profits when the price goes up.
Put Option (PE)
Buyer has the right to sell.
Profits when the price goes down.
Example with Reliance stock (₹2500):
Call Option @ 2600: Profitable if Reliance goes above ₹2600.
Put Option @ 2400: Profitable if Reliance goes below ₹2400.

Bitcoin Bybit chart analysis August 28Hello
It's a Bitcoin Guide.
If you "follow"
You can receive real-time movement paths and comment notifications on major sections.
If my analysis was helpful,
Please click the booster button at the bottom.
This is a 30-minute Bitcoin chart.
Although not visible on the screen,
I've used the same strategy as the long position entry point two days ago, at $109,950.4.
*If the red finger moves,
this is a conditional long position strategy.
1. After touching the first section at the top, the red finger indicates a long position entry point of $112,715.8. Stop-loss price if the green support line is broken.
(Since the purple finger touches the market, it's likely to immediately connect with an uptrend, so it's best not to open a short position. Check for an upward wave. Also, it's important to check whether the purple support line is broken first.)
2. Long position: $113,881.1. 1st target -> Top. 2nd target -> Target price up to the final gap.
If the price falls immediately without touching the purple finger at the top, hold for the final long position at section 2. Stop-loss price if the light blue support line is broken. Since the light blue support line is a mid-term uptrend line,
it's crucial for long positions not to break out today.
Below that, the bottom is open to $110.5K.
Up to this point, I ask that you use my analysis for reference only.
I hope you operate safely, with a focus on principled trading and stop-loss orders.
Thank you.
btc paper trade plannedETF Outflows: Over $1.17 billion pulled from major Bitcoin ETFs, signaling caution from institutional investors
Network Activity: Dropped by 13%, indicating weaker speculative demand
Historical Trends: September has been a weak month for BTC in 8 of the last 12 years
Momentum Forecast
Sideways to Slightly Lower: Most analysts expect BTC to consolidate or dip slightly through September
Support Level: If ETF outflows continue, BTC could test $100K

BTCUSD LOOK LIKE BAT PATTERN Here i would like to show you all that there is pattern formation which is known as BAT PATTERN.
> This pattern is known as reversal pattern.
> Reversal will be confirmed when today's candle get closed above previous day candle.
> Be carefull if breakout not sustained above previous day candle for long.
> To short this you must wait to break low of previous day candle.
This is not my buy/sell call.
