BTCUSD Long Setup – Trend Continuation Play📌 Trade Details
Entry: 113,256.5
Target: 115,317.7
Stop Loss: 111,874.4
📊 Trade Rationale
✅ Trend Continuation: Price has respected the ascending trendline multiple times, indicating strong buyer interest.
✅ Break of Structure: Recent higher highs and higher lows confirm bullish momentum.
✅ Support Flip: Zone around 113,050 acted as resistance earlier and is now being retested as support.
✅ Volume Confirmation: Rising volume supports the bullish continuation bias.
✅ Clean Risk–Reward: With SL below structure and TP near major resistance, this setup offers a favorable RRR.
🎯 Target Zone
The target aligns with the next strong supply zone at 115,300+, where sellers may re-enter.
⚠️ Risk Management
Always size positions wisely, as crypto remains highly volatile. Protect your capital first.
Disclaimer:
This idea is for educational purposes only and not financial advice. Do your own research before entering any trade.
BTCUSD.PI trade ideas

Part 3 Institutional Trading Types of Option Traders
There are mainly four types of participants:
Option Buyers (Long Call / Long Put)
Pay premium.
Limited loss (premium), unlimited profit.
Usually retail traders.
Option Sellers (Short Call / Short Put)
Receive premium.
Limited profit (premium), unlimited loss.
Usually big institutions (because margin required is high).
This is why buyers dream, sellers earn is often said in option markets.
Why Trade Options?
Options are powerful because they allow:
Leverage → Small premium controls large value.
Hedging → Protect portfolio from crashes (insurance).
Speculation → Bet on direction, volatility, or time decay.
Income → Selling options to earn steady premium (if managed wisely).

F&O Trading & SEBI Regulations1. Introduction
The Indian stock market has seen remarkable growth over the last few decades, and one of the most fascinating areas of this growth has been in derivatives trading. Derivatives are financial instruments that derive their value from an underlying asset, and in India, the most widely traded derivatives are Futures and Options (F&O).
F&O trading allows investors and traders to participate in the price movement of stocks, indices, and commodities without necessarily owning them. It provides opportunities to hedge risks, speculate, and arbitrage.
However, with great power comes great responsibility. The Securities and Exchange Board of India (SEBI)—the market regulator—plays a crucial role in ensuring that F&O trading does not turn into a high-risk gamble for unsuspecting investors. SEBI lays down strict rules and guidelines to maintain market integrity, protect investors, and reduce systemic risks.
This article will give you a comprehensive understanding of F&O trading and SEBI’s regulations governing it.
2. Understanding Derivatives
Before diving into F&O, let’s clarify what derivatives are.
A derivative is a financial contract whose value depends on the performance of an underlying asset. In India, the underlying assets include:
Equity shares (like Reliance, Infosys, HDFC Bank)
Stock indices (like Nifty 50, Bank Nifty)
Commodities (like gold, crude oil)
Currencies (like USD/INR)
Types of derivatives:
Forwards – Customized contracts between two parties, traded over-the-counter (OTC).
Futures – Standardized contracts traded on exchanges like NSE & BSE.
Options – Contracts that give the right, but not the obligation, to buy or sell an asset.
Swaps – Mostly used in currency and interest rate markets.
In India, Futures and Options are the most liquid and popular derivative instruments, especially in the stock market.
3. What is F&O Trading?
3.1 Futures
A Futures contract is an agreement to buy or sell an underlying asset at a predetermined price on a specific date in the future.
Example: If you buy Nifty Futures at 20,000 today, you are betting that Nifty will be above 20,000 on the expiry date.
If Nifty rises to 20,500, you make a profit.
If Nifty falls to 19,500, you incur a loss.
3.2 Options
An Options contract gives the buyer the right but not the obligation to buy or sell the underlying asset at a predetermined price.
Two types of options:
Call Option (CE): Right to buy.
Put Option (PE): Right to sell.
Example:
If you buy Reliance Call Option at ₹2,500 strike, you profit if Reliance moves above ₹2,500.
If you buy Reliance Put Option at ₹2,500 strike, you profit if Reliance falls below ₹2,500.
Options also have premium, strike price, and expiry terms.
3.3 Why do people trade F&O?
Hedging: Protecting investments from adverse price movements.
Speculation: Betting on price movements for profit.
Arbitrage: Exploiting price differences between markets.
Leverage: Controlling large positions with small capital.
4. Growth of F&O Trading in India
The Indian F&O market has grown tremendously since it was introduced in 2000. NSE and BSE both offer equity derivatives, but NSE has emerged as the dominant player.
Key reasons for popularity:
High liquidity in index derivatives like Nifty 50 & Bank Nifty.
Opportunity for intraday traders to capture price swings.
Low margin requirements compared to cash market.
Availability of weekly options.
However, SEBI has also noticed risks—especially from retail investors treating F&O like gambling, leading to heavy losses. Reports show that nearly 9 out of 10 retail traders lose money in F&O trading.
This has pushed SEBI to tighten regulations.
5. SEBI’s Role in Regulating F&O
The Securities and Exchange Board of India (SEBI) is the watchdog of Indian financial markets. Its mission is to:
Protect investor interests.
Promote fair and efficient markets.
Regulate intermediaries and stock exchanges.
Minimize systemic risks.
For F&O trading, SEBI has set strict rules, margins, disclosures, and eligibility criteria.
6. SEBI Regulations on F&O Trading
Let’s explore the major regulations SEBI has imposed:
6.1 Eligibility of Stocks for Derivatives
Not all stocks can be traded in F&O. To qualify:
The stock must have a minimum market capitalization of ₹5,000 crore.
Average daily traded value should be high.
Adequate liquidity must exist.
Price band restrictions and surveillance mechanisms should be applicable.
This ensures that only liquid and stable stocks are allowed in F&O.
6.2 Contract Specifications
SEBI mandates standardization of contracts:
Lot size: Minimum notional value (₹5-10 lakhs).
Expiry: Monthly & weekly expiries.
Strike intervals: Based on stock/index price range.
Tick size: ₹0.05 for equity derivatives.
This standardization prevents manipulation.
6.3 Margin Requirements
Margins are crucial in derivatives as they are leveraged products.
Types of margins:
SPAN Margin – Based on risk of position.
Exposure Margin – Additional buffer.
Premium Margin – For option buyers.
Mark-to-Market (MTM) Margin – Daily settlement of gains/losses.
This ensures that traders have skin in the game and cannot default.
6.4 Risk Mitigation Measures
Daily price bands for stocks in derivatives.
Position limits for clients, members, and FIIs.
Ban periods for stocks crossing OI (Open Interest) limits.
Intraday monitoring of margins and positions.
6.5 Disclosure Requirements
Brokers must give risk disclosure documents before enabling F&O trading.
Investors must sign an agreement acknowledging risks.
Margin details and exposure reports are sent via SMS/email daily.
6.6 Segregation of Clients’ Funds
Brokers must segregate their own funds from clients’ funds. Misuse of client collateral is strictly prohibited.
6.7 Investor Protection & Education
SEBI regularly issues advisories warning retail traders about F&O risks.
Investor education campaigns (e.g., “Options are not lottery tickets”).
Free online resources for risk management.
7. SEBI’s New Regulations (Recent Developments)
In the last few years, SEBI has tightened norms further:
Peak Margin Reporting (2021):
Traders must maintain full margin upfront.
No more leveraging via intraday tricks.
Intraday Leverage Ban (2022):
Brokers cannot offer more than 20% margin funding.
This reduced excessive speculation.
Increased Disclosure of F&O Risks (2023-24):
Exchanges must display warnings showing percentage of retail traders losing money.
Eligibility Tightening (2023):
SEBI proposed reviewing stocks in derivatives regularly. Illiquid stocks may be excluded.
Investor Suitability Check (2024 Proposal):
Only financially literate and risk-capable investors may be allowed in F&O in future.
8. Benefits of SEBI Regulations
Market Stability: Prevents manipulation and speculation bubbles.
Investor Protection: Safeguards retail traders from blind gambling.
Transparency: Standardized contracts and disclosure norms.
Risk Management: Margins and limits reduce systemic collapse.
Trust in Markets: Encourages more participation in regulated environment.
9. Challenges & Criticisms
Despite SEBI’s efforts, challenges remain:
Retail Traders’ Losses: Majority still lose money due to lack of knowledge.
Over-regulation Concerns: Some argue SEBI rules reduce liquidity.
Complexity: F&O remains difficult for beginners despite regulations.
Broker Malpractices: Some brokers mis-sell options strategies to clients.
Speculative Craze: Many traders treat weekly options like gambling.
10. Future of F&O Trading in India
Looking ahead:
F&O will remain the largest contributor to market volumes.
SEBI may bring financial literacy tests before allowing retail traders.
More focus on institutional participation and reducing retail over-exposure.
Increased use of AI-driven surveillance to detect manipulation.
Potential restrictions on weekly options if speculation rises.
Conclusion
Futures and Options trading is an exciting and powerful tool in the financial markets, offering opportunities for hedging, speculation, and arbitrage. But it is also risky, especially for retail investors without proper knowledge and discipline.
The Securities and Exchange Board of India (SEBI) plays a vital role in ensuring that F&O trading remains fair, transparent, and not a casino for retail investors. Its regulations on eligibility, margins, disclosures, and risk management are designed to create a balance between freedom and protection.
As India’s capital markets continue to grow, SEBI’s regulations will evolve further. Traders must remember that regulations are not restrictions but safeguards—helping ensure that markets grow sustainably while protecting investors.
The future of F&O in India is bright, but only if traders approach it with knowledge, discipline, and respect for risk management.

BITCON - At SupportSharing my analysis of the Bitcoin perpetual futures daily chart. We are currently seeing Bitcoin testing a strong support zone around $108,000 to $110,500. This area has shown buying interest, with price dipping slightly below but quickly rebounding, indicating demand strength.
The recent sharp decline started after hitting a major resistance zone near $123,500 to $125,000, where sellers took control and pushed prices down.
Volume has increased during this downtrend, signaling active participation and confirming the selling pressure. However, the support level is holding for now, with a small bullish candle forming, which could imply a potential short-term bounce.
Traders should watch this support closely—if it holds with increased volume, it may lead to a recovery. A break below, especially on high volume, could signal further downside.
Stay cautious and trade smart!

Reversal trade in BTCBTC seems taking reversal on 4H chart after creating a W pattern, breaking it, pull back and move in the direction.
it may high RnR trade.
P.S. - this is just a technical analysis not a trade advice.

BTCUSDT.P MEXC 15MThis BTC/USDT analysis dives into the order flow using Cumulative Volume Delta (CVD) to gauge the real strength behind recent price movements. CVD provides a crucial look "under the hood" by tracking the net difference between aggressive market buys and sells.
Currently, we're observing a potential divergence between price action and CVD. While the price may be showing one thing, the CVD indicates whether conviction from buyers or sellers supports the move. This discrepancy can often be a leading indicator for a potential reversal or trend exhaustion. Let me know your thoughts in the comments!

BTCUSD Weekly – Supply Pressure vs Key Support (110K in Focus)On the weekly timeframe, BTC is trapped between major supply (117K–119K) and key support (110K–112K).
Supply Zone: Price has faced multiple rejections near 117K–119K, showing strong seller presence.
Order Block/Resistance: The yellow zone around 113K is acting as an active selling area, preventing BTC from reclaiming higher ground.
Support Zone: BTC is currently testing the 110K–112K support zone. If this level holds, we could see another attempt to reclaim 113K.
Scenarios:
1. Bullish Breakout (less likely unless strong volume appears):
Needs to reclaim 113K and break above 119K.
Target zone → 126K–134K.
Stop loss for longs → below 110K.
2. Bearish Breakdown (higher probability if 110K fails):
If 111K–110K zone breaks, BTC likely retests the 103K–106K demand zone.
If that fails → extended move possible toward 97K.
Stop loss for shorts → above 113.5K.
Bias: Neutral to Bearish unless BTC reclaims 113K with strong volume.

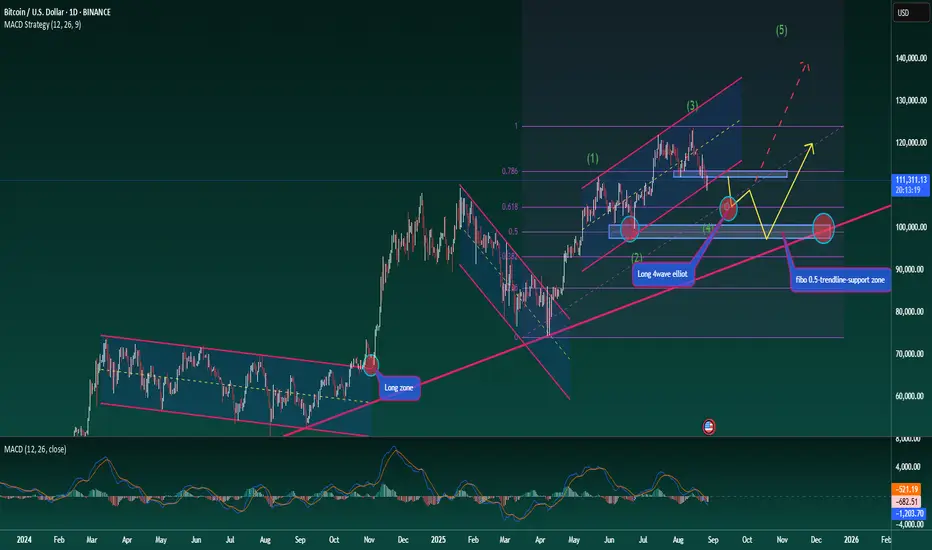
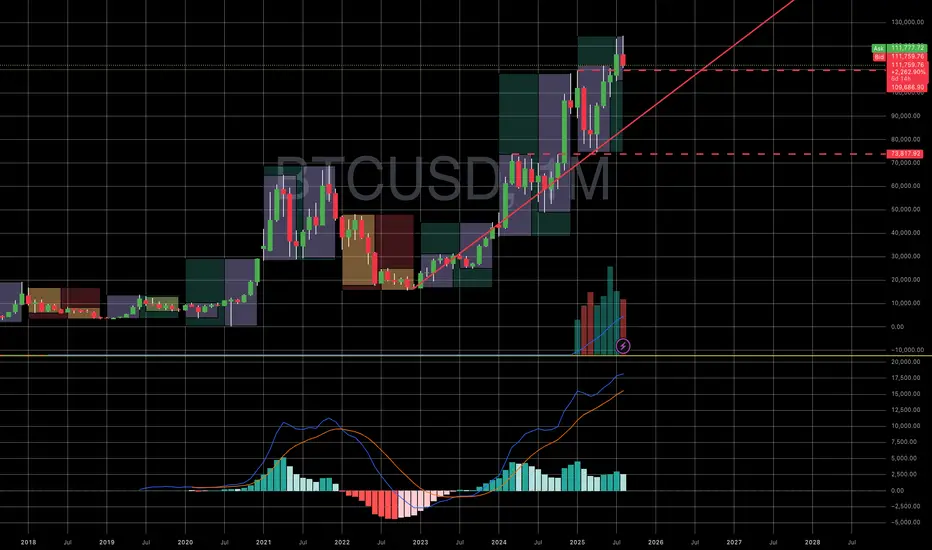
Bitcoin – Long-Term View with Elliott Wave StructureBitcoin – Long-Term View with Elliott Wave Structure
Hello traders,
Let’s take a medium- to long-term look at BTC. The broader trend is clearly bullish, but for any uptrend to be sustainable, healthy corrections are necessary. At present, BTC is moving through a corrective phase, identified as wave 4 in the Elliott Wave structure.
To gauge how far this correction may extend before wave 5 begins, we can apply Fibonacci Retracement. Two key levels stand out: 0.618 and 0.5.
At 0.618, we see a strong support zone, but it may not yet be the decisive level for confirming the wave count. If BTC reacts positively here and rallies into wave 5, the Elliott structure remains clean and valid.
At 0.5, the level aligns with an ideal Fibonacci retracement ratio and also shows up as an important structural support on the chart. A break below this could trigger deeper downside, as highlighted by the ascending trendline.
Long-Term Trading Plan
Entry 1: Around Fibonacci 0.618 at 105k
Entry 2: Around Fibonacci 0.5 at 99k
This outlook fits a medium-term plan, but if the second zone (99k) provides a strong reaction, it could also become the base for a longer-term bullish structure.
Stay disciplined, monitor these levels closely, and trade with proper risk management.
What’s your view on BTC’s long-term structure? Share your thoughts in the comments.
BTC Decision Zone – Bulls Defend or Bears Take OverBitcoin (BTC) Market Analysis – Key Technical and Fundamental Insights
Technical Outlook:
Trend: BTC is trading within a defined range, with major resistance around 122,500–125,000 USD and critical support at 107,500–110,000 USD. The price action has printed a double top pattern, typically a bearish signal, followed by lower highs and increased selling volume.
Momentum: Indicators such as RSI and MACD (based on typical setups) suggest weakening bullish momentum; a decisive break below support could confirm further downside. Conversely, a bounce from this zone could trigger a short-term corrective rally toward 115,000–117,500 USD.
Volume & Market Structure: High trading activity around 110,000 reinforces its importance. If this level fails, a volume gap below it could lead to swift moves toward 105,000–100,000 USD.
Fundamental Factors:
Macro Conditions: Ongoing uncertainty around U.S. interest rate policy and dollar strength adds pressure to risk assets like BTC. A hawkish Fed stance tends to weigh on crypto, while any pivot to easing could support prices.
Regulation: Global regulatory scrutiny remains a risk; any negative developments could accelerate bearish sentiment.
Adoption & Institutional Flow: Long-term fundamentals remain constructive with rising institutional participation (ETFs, custody solutions), but short-term volatility persists as traders react to macro headlines and liquidity conditions.
Conclusion & Outlook:
BTC is at a decision point. A sustained hold above 107,500 could favor short-term buyers, while a confirmed break below opens room for deeper downside. Long-term investors may view pullbacks as opportunities for accumulation, but traders should remain cautious and manage risk actively.

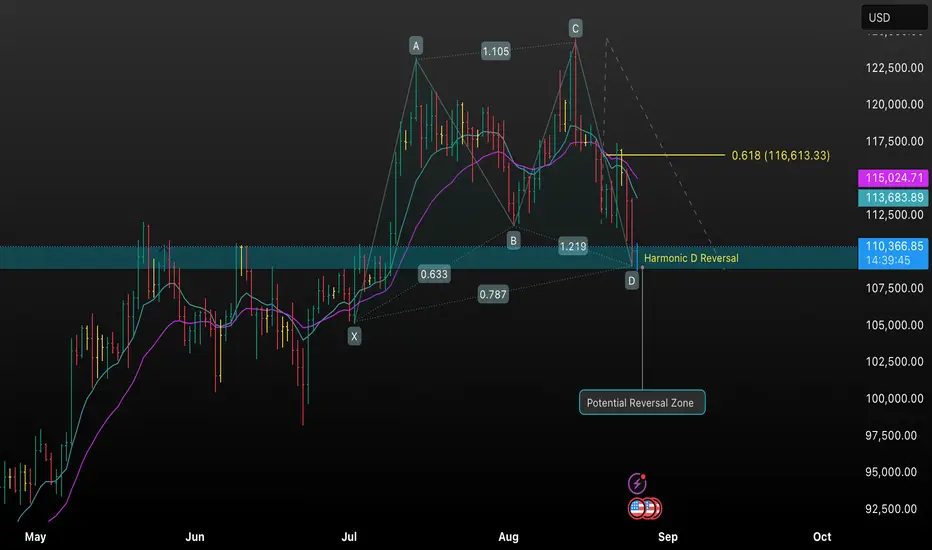
BTCUSD Harmonic Pattern & Potential Reversal This TradingView chart analyzes Bitcoin (BTCUSD) using a harmonic pattern approach, illustrating the price pathway through significant XABCD points. The “Potential Reversal Zone” (PRZ) and Harmonic D completion area suggest a possible bullish reversal. Key Fibonacci retracement levels, moving averages, and support-resistance zones inform the analysis, providing actionable insights for swing traders and technical analy
BTCUSD: Expanding Triangle Presents good buy, But Risks RemainHello,
An expanding triangle is taking shape on the BTCUSD chart, offering a potential entry point for traders seeking exposure to the crypto market. From current levels, a recovery back to Bitcoin’s all-time high could yield an estimated 14% return.
While this setup looks attractive, it’s important to weigh the risks:
Market Immaturity & Volatility
Despite delivering strong returns in recent years, cryptocurrencies remain highly volatile and relatively immature as an asset class. Broad portfolio adoption within a long-term strategic allocation still appears premature.
Comparisons With Gold
Some investors draw parallels between Bitcoin and gold. However, gold enjoys a more established position in financial markets, with proven use cases and a reliable track record as a portfolio hedge during downturns. Bitcoin has yet to achieve that level of credibility.
Portfolio Construction Considerations
For investors open to the potential of crypto evolving into a recognized asset class, it may be best treated as a satellite investment within a core-satellite strategy. The “core” should remain in traditional, well-established assets, while a small allocation to crypto can provide upside without distorting overall portfolio balance.
On the other hand, conservative investors—those unwilling to withstand extreme price swings or skeptical of crypto’s long-term viability—may be better off avoiding exposure to this market altogether.
In short, the current technical pattern highlights opportunity, but prudent portfolio construction and a clear understanding of the risks remain essential before committing capital.
Follow me on Tradingview to keep getting my analysis. Feel free to comment with the assets you would like us to look at.
Disclosure: I am part of Trade Nation's Influencer program and receive a monthly fee for using their TradingView charts in my analysis.

Trading Psychology & Discipline1. What is Trading Psychology?
Trading psychology refers to the emotional and mental state of a trader when making decisions in the market. It includes fear, greed, confidence, patience, discipline, hope, regret, and risk perception.
Every trader faces these emotions, but winners manage them better.
Fear: Fear of losing money, fear of missing out (FOMO), or fear of being wrong.
Greed: Wanting more profit, overtrading, or not booking gains at the right time.
Hope: Holding on to losing trades, hoping they will reverse.
Regret: Feeling bad after missing an opportunity or making a mistake, leading to revenge trading.
In short: Trading psychology is the battlefield inside your own mind.
2. Why is Trading Psychology Important?
Imagine two traders using the same strategy. One follows rules strictly, cuts losses early, and controls emotions. The other panics, hesitates, and breaks rules. Who will succeed?
Trading is not only about analysis—it’s about execution. And execution depends on your mindset.
Some key reasons psychology matters:
Markets are uncertain; your emotions influence decisions.
Risk management requires discipline (most ignore stop-losses due to ego or fear).
Profits come from consistency, not one lucky trade.
Without mental control, you will overtrade, average down losses, or chase stocks blindly.
3. Core Emotions in Trading
Let’s break down the main emotions that affect traders:
(A) Fear
Afraid to enter trades → missed opportunities.
Afraid of losses → cutting winners too early.
Afraid of stop-loss hitting → widening stop-losses unnecessarily.
(B) Greed
Holding winners too long, expecting more.
Taking oversized positions.
Trading without proper setup.
(C) Hope
Hoping a loss turns into profit → ignoring stop-loss.
Adding more to losing positions (averaging down).
(D) Overconfidence
After a few wins, believing you “cannot lose.”
Taking unnecessary risks, leading to a big blowup.
(E) Impatience
Not waiting for setups.
Jumping into trades because “the market is moving.”
Recognizing these emotions is the first step to controlling them.
4. The Role of Discipline in Trading
If psychology is the mind, discipline is the practice. Discipline means sticking to your trading plan, following rules, and controlling impulses.
Key aspects of discipline:
Following a Trading Plan
A plan defines entry, exit, risk, and money management. Discipline ensures you don’t deviate from it.
Risk Management
Never risking more than a fixed percentage of capital per trade (e.g., 1-2%).
Patience
Waiting for the right setup instead of forcing trades.
Consistency
Small, regular gains build wealth—not random big wins and losses.
Avoiding Emotional Trading
No revenge trades, no FOMO entries.
5. Common Psychological Mistakes Traders Make
Revenge Trading
After a loss, trying to recover immediately with a random trade.
Overtrading
Entering too many trades without quality setups.
Ignoring Stop-loss
Letting small losses grow into big ones.
Overleveraging
Using excessive capital, hoping for big profits.
FOMO (Fear of Missing Out)
Jumping into a trade because “everyone is buying.”
Lack of Patience
Exiting early before the strategy plays out.
6. How to Build Strong Trading Psychology
Developing trading psychology is like training your muscles—it takes practice.
Step 1: Create a Trading Plan
Define entry rules, exit rules, stop-loss, and position size.
Write them down and follow strictly.
Step 2: Use Risk Management
Risk only 1–2% of your capital per trade.
Use stop-loss religiously.
Step 3: Keep a Trading Journal
Record trades, reasons, and emotions.
Helps identify emotional mistakes.
Step 4: Detach from Money
Focus on executing strategy, not on profits/losses.
Think in terms of probabilities, not guarantees.
Step 5: Practice Patience
Trade only when setup matches your plan.
Avoid impulsive entries.
Step 6: Control Greed & Fear
Book profits as per plan, don’t hold forever.
Accept losses as cost of doing business.
Step 7: Develop Routine
Start with daily market analysis.
Take breaks—don’t stare at charts all day.
7. Practical Techniques to Improve Discipline
Set Daily/Weekly Limits
Example: Maximum 3 trades per day.
Or: Stop trading after losing 3% of account.
Use Technology
Automated stop-loss orders prevent emotional decisions.
Meditation & Mindfulness
Helps stay calm, reduces stress.
Backtesting & Practice
Confidence increases when strategy is tested.
Accept Uncertainty
No setup has 100% accuracy.
Losses are part of trading business.
8. Trading Psychology for Different Styles
Day Trading: Needs quick decision-making, high emotional control.
Swing Trading: Patience is key; avoid checking prices every minute.
Investing: Long-term vision, ability to ignore short-term volatility.
Each style requires a different psychological approach.
9. Case Studies: Psychology in Action
Case 1: The Fearful Trader
Ravi has a solid strategy, but every time he enters a trade, he exits quickly with a tiny profit because he fears losing. Over time, his small wins cannot cover occasional big losses. His fear costs him consistency.
Case 2: The Greedy Trader
Anita makes 15% in a stock but doesn’t exit. She wants 25%. The market reverses, and her profit turns into a 10% loss. Greed made her lose a winning trade.
Case 3: The Disciplined Trader
Arjun risks only 1% per trade, follows stop-loss strictly, and journals his trades. His profits are steady and he grows his account slowly but surely. He survives where others blow up.
10. Building the Trader’s Mindset
The ultimate goal is to think like a professional.
Focus on process, not outcome.
Accept losses as natural.
Think in probabilities, not certainties.
Detach ego from trading decisions.
11. The Growth Path of a Trader
Unconscious Incompetence – You don’t know what you don’t know.
Conscious Incompetence – You realize mistakes, but still repeat them.
Conscious Competence – You follow rules with effort and discipline.
Unconscious Competence – Psychology and discipline become second nature.
12. Final Thoughts
Trading psychology & discipline are not “soft skills”—they are the foundation of trading success.
Without psychology, strategies fail.
Without discipline, emotions take over.
With the right mindset, even an average trader can beat the markets.
Remember:
👉 The market is not your enemy—your emotions are.
👉 Treat trading like a business, not a gamble.
👉 Consistency beats occasional brilliance.

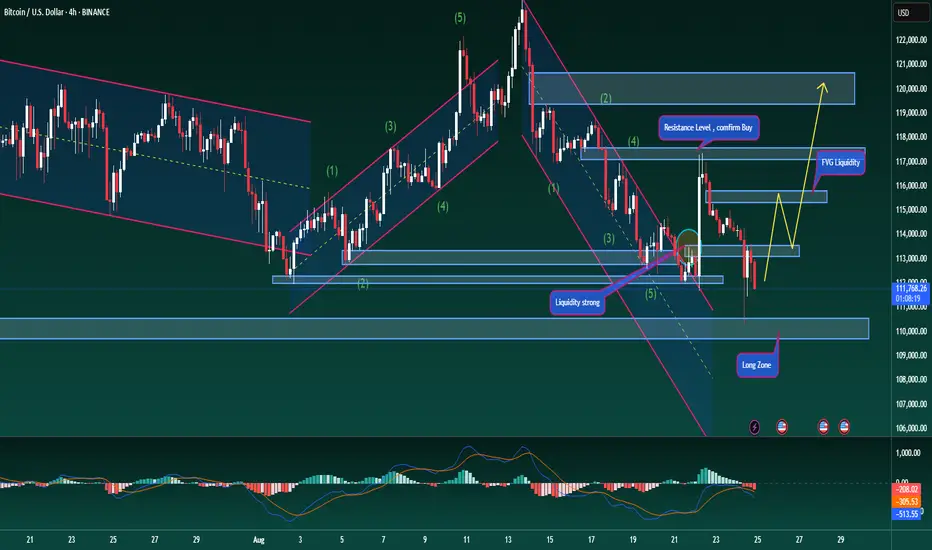
Accumulate liquidity, and then move up toward 113,697
• Current Price: Around 110,138 USD.
• Highlighted Zones:
• BSL (Buy-Side Liquidity) zone near 117,000 – 118,000 USD.
• SSL (Sell-Side Liquidity) zone around 109,000 USD.
• Levels Marked:
• PDH (Previous Day High) at 113,697 USD.
• PDL (Previous Day Low) at 109,409 USD.
• Market Structure:
• The price is currently trading near the PDL/SSL zone, suggesting possible accumulation or liquidity grab before a potential upward move.
• A projected path (dotted lines) indicates a possible consolidation, then a move up toward PDH, and further toward the BSL zone.
• A support/resistance flip (S/S) is marked around the 111,000 USD level, suggesting a key zone to watch for validation of bullish momentum.
Interpretation:
The chart suggests a potential bullish scenario: price might retest the SSL zone, accumulate liquidity, and then move up toward 113,697 (PDH) and possibly the 117k BSL zone.

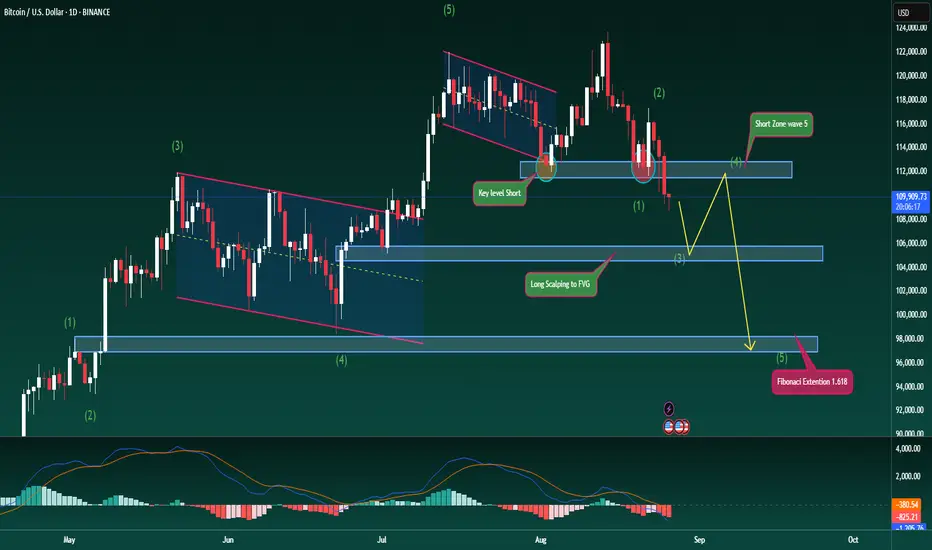
Bitcoin Trend Reversal – Elliott Wave in PlayBitcoin Trend Reversal – Elliott Wave in Play
Hello traders,
Today we look at a fresh scenario for BTC as price has broken decisively below a major support zone, showing clear short-side strength. This could mark the beginning of a medium-term downtrend, signalling a shift in market structure.
The 112k level has been fully taken out after two strong rejections earlier, and now the market looks ready to seek lower levels, potentially targeting 97k–98k based on Fibonacci Extension.
From an Elliott Wave perspective, BTC is currently in wave 3 of the down cycle, and has not yet reached the reaction point for wave 4. I expect the 105k zone to act as support for this leg down. From there, price could bounce into wave 4 before completing wave 5 lower towards 97k, or even 95k. This would provide a solid area to plan medium-term long entries afterwards.
The MACD also supports the bearish view, with both volume and moving averages trending below, signalling strong downside momentum.
I’ve marked the key price levels on the chart for clarity. Please use this scenario as reference and manage risk carefully with your trades.
What’s your outlook for BTC here? Share your thoughts in the comments so we can discuss together.
BTC/USDThe BTC/USD trade with an entry price of 109,492, stop-loss at 108,687, and exit price at 111,161 is a short-term buy trade setup designed to capture upward momentum in Bitcoin. The trade aims for a profit of about 1,669 points while risking around 805 points, giving a favorable risk-to-reward ratio of nearly 1:2, which is ideal for consistent trading results.
The entry price at 109,492 is chosen strategically, likely after confirmation of bullish signals such as a bounce from support, a trendline reversal, or indicators like RSI and MACD showing upward momentum. Entering at this level suggests confidence that BTC/USD would rise toward the target zone.
The stop-loss at 108,687 is placed below a nearby support level, ensuring downside protection if the market moves unexpectedly against the trade. This prevents large losses and maintains discipline in risk management.
The exit price at 111,161 is the take-profit target, likely aligned with a resistance zone. Securing profits at this level ensures gains are locked in before any potential pullback.
Overall, this setup highlights disciplined planning, strong technical analysis, and strict risk control, which are essential for trading successfully in the volatile BTC/USD market.

Bitcoin / USD – 15m Short Sell In this setup, I’m tracking BTC price action using the Fear Index (21) and Trend Shift Histogram (14) as confluence indicators for potential entries.
🔻 Key Observations:
The Fear Index showed a strong spike before the sharp sell-off, indicating growing selling pressure.
The Trend Shift Histogram gave multiple bearish signals (highlighted with arrows), aligning with the price rejection and downward continuation.
After the heavy drop, BTC attempted a recovery but faced resistance within the marked zone, forming a bearish retest.
📌 Trade Setup:
Short entry taken on confirmation of bearish trend shift.
Stop loss placed above the rejection zone.
Target aligned with the momentum continuation shown by the histogram and fear index.
⚡️ Conclusion:
This setup highlights how combining sentiment-based indicators (Fear Index) with momentum confirmation (Trend Shift Histogram) can help anticipate strong market moves. Always manage risk carefully, as volatility in lower timeframes can be sharp.

Bitcoin – Trading Plan Update Bitcoin – Trading Plan Update
Hello traders,
The BTC scenario has played out well, with price reacting strongly at 110.4k and bouncing higher. This level has cleared much of the short-side liquidity, while the H4 candle could not close below the 111.8k support. As a result, long entries around 110k can still be expected to target higher levels, at least towards 115.5k.
The primary focus remains on the long side as long as price does not confirm a sustained bearish move. Long positions will remain valid until price breaks decisively below 110k.
For traders who already closed longs or missed the earlier entry, wait for a retest of the FVG zone near 111.5k. If price reacts higher, fresh longs around 113k can be considered.
Short-term selling opportunities may also appear near 115.5k and 117.2k, where price could face resistance.
My BTC strategies are still aligning well with current price action. That said, this is my personal outlook based on my trading method. Please trade responsibly, stick to your own plan, and manage risk carefully.
What’s your view on BTC right now? Share your thoughts in the comments below.
Part 1 Support and ResistanceCall and Put Options in Action
Call Option Example
Reliance is trading at ₹2500.
You buy a 1-month call option with strike price ₹2550, premium ₹50, lot size 505.
If Reliance rises to ₹2700 → Profit = (2700 - 2550 - 50) × 505 = ₹50,500.
If Reliance falls below 2550 → You lose only the premium (₹25,250).
Put Option Example
Nifty is at 20,000.
You buy a 1-month put option, strike 19,800, premium 100, lot size 50.
If Nifty falls to 19,200 → Profit = (19,800 - 19,200 - 100) × 50 = ₹25,000.
If Nifty rises above 19,800 → You lose premium (₹5,000).
Participants in Options Trading
Option Buyer – Pays premium, has limited risk and unlimited profit potential.
Option Seller (Writer) – Receives premium, has limited profit and potentially unlimited risk.
Example:
Buyer of call: Unlimited upside, limited loss (premium).
Seller of call: Limited profit (premium), unlimited loss if stock rises.

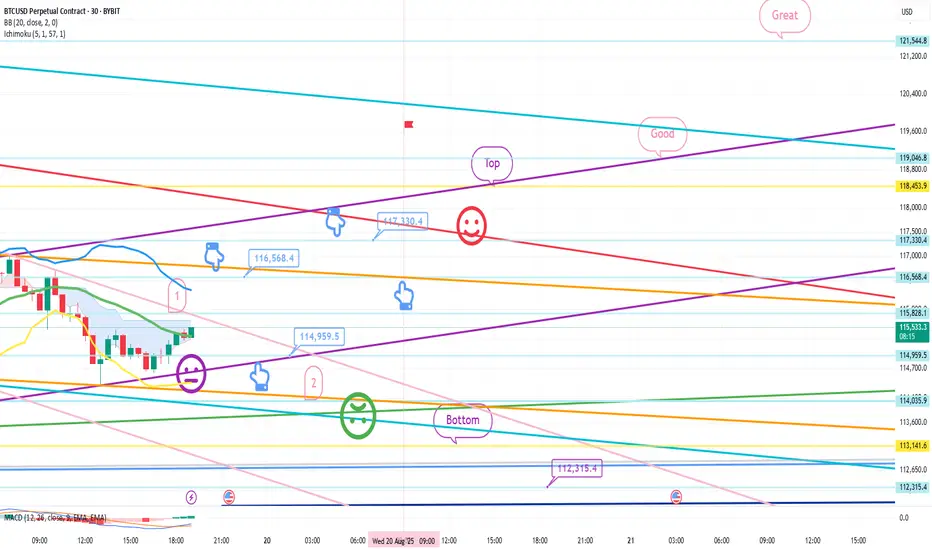
Bitcoin Bybit chart analysis August 22Hello
It's a Bitcoin Guide.
If you "follow"
You can receive real-time movement paths and comment notifications on major sections.
If my analysis was helpful,
Please click the booster button at the bottom.
This is the Nasdaq 30-minute chart.
There are no separate indicators released.
Roughly speaking,
the strategy is to switch from short to long at the light blue finger, or to wait long at the bottom.
The bottom is today's major support line and the 6+12 pattern recovery point.
If the price moves along the light blue finger path,
there's a possibility that it will eventually fall to touch the 6+12 level again.
Please note this.
I applied this directly to Bitcoin.
This is a 30-minute Bitcoin chart.
The Nasdaq is moving sideways in a downward trend,
while Bitcoin has continued its vertical decline after hitting a new high.
*If the blue finger moves along the path,
switch from short to long. Or, if it immediately declines, wait long in the second section.
This is a two-way neutral strategy.
1. $116,568.4 short position entry point / Stop loss price if the orange resistance line is broken.
2. $114,959.5 long position switch / Stop loss price if the purple support line is broken.
3. $117,330.4 long position first target / 116.5K long position re-entry point.
After this, long position target prices are listed in order of Top, Good, and Great.
The first point above is the best short position entry point for today.
If the price declines around the first touch, hold long at the second point.
Stop loss price if the green support line is broken.
In the case of Bitcoin, the candlestick is breaking out of the 12+ daily pattern,
and the downside is open.
If the bottom point is maintained, the mid-term uptrend will be broken.
-> If the bottom point is broken out, the mid-term uptrend will be broken. A medium-term downtrend may be forming.
(MACD dead cross on weekly chart)
If the Nasdaq only moves sideways, that's good,
but if it declines, BTC could fall even more sharply.
Due to low participation, I decided to take a break this week,
but I've had some free time, so I'm sharing this with everyone for the first time in a while.
Please use my analysis for reference only.
I hope you operate safely, with a focus on principled trading and stop-loss orders.
Thank you.
BTC | Distribution Warning at the TopWeekly Frame - MACD Histogram
Daily Frame - Oscillator RSI
BTC cleared $112k ATH but follow-through is weak (only ~13.5% vs 48.5% in the 2024 impulse). Weekly MACD histogram is rolling toward/under zero, ETF flows show recent net outflows, and on-chain data says many wallets are in profit — a classic distribution setup. Expect higher short-term downside risk until proven otherwise.
What to watch (signals): a decisive weekly / daily close below the Jul 7 weekly low (~$107.4k) would be a major bearish trigger and likely open a move toward $99k → $88–90k. Conversely, a sustained weekly close above the current distribution zone + renewed ETF inflows would invalidate the bear case and allow a retest of $120k+.
Short setup (early entry): look for rejection in the $112k area with confirmation (D/H4 bearish candle + rising sell volume). Suggested stop > $117k (protect against false breakouts). Initial targets: $107k, then $99k if momentum continues. Use scaled entries and confirm with volume / on-chain metrics.
Risk management: reduce leverage, keep position sizes small, and never trade full size into macro windows (Fed/PCE/NFP). Require at least one flow or volume confirmation before adding. If you prefer safer trades, wait for a confirmed breakout (H4/D close) in either direction.
#BTC #BTCUSD #Bitcoin #crypto #TA #MACD #RSI #OnChain #ETFflows #TradingView
BTC/USD Bearish Retest Setup – Eye on 106.6K TargetTrend: BTC is in a downtrend channel (rejection line above, support line below).
EMA Signals: Price is trading below EMA 70 & EMA 200 → bearish bias remains strong.
Supply & Demand:
Support zone: around 112,000 – 112,500 (price just bounced).
RBR Supply zone: 114,300 – 116,000 where sellers are likely waiting.
📊 Strategies in play
Support–Resistance: Bounce at support, retest expected at supply zone.
EMA Strategy: Bearish since candles trade under 200 EMA.
Break & Retest: Price could retest supply before resuming drop.
Target Projection: If rejection at supply holds, target = 106,600 zone (chart target point).
⚖️ Risks
A clean break above 116,000 would invalidate bearish setup and open room for reversal.
Range trading possible between 112k–116k before breakout.
✅ Summary: BTC short-term bias remains bearish. Expect retest of 114.3k–116k supply before continuation lower toward 106.6k target. Only a strong breakout above 116k flips the trend bullish.

Options Trading Strategies1. Introduction to Options Trading
Options are one of the most versatile financial instruments available in the stock market. Unlike straightforward stock trading, where you buy or sell shares, options give you the right but not the obligation to buy or sell an underlying asset at a pre-determined price within a specific time.
Because of their flexibility, options allow traders to:
Hedge against risk,
Generate income,
Speculate on market direction, or
Even profit from volatility itself.
Options trading strategies are structured combinations of options (calls, puts, or both) that help traders tailor risk and reward according to their outlook. Understanding these strategies is essential because options are a double-edged sword: they can multiply profits but also magnify risks if used incorrectly.
2. Basics of Options
Before diving into strategies, let’s recap the key concepts:
Call Option → Right to buy the asset at a certain price. (Bullish in nature)
Put Option → Right to sell the asset at a certain price. (Bearish in nature)
Strike Price → Pre-decided price at which the option can be exercised.
Premium → Cost of buying the option.
Expiry → The date on which the option contract ends.
In the Money (ITM) → Option has intrinsic value.
Out of the Money (OTM) → Option has no intrinsic value, only time value.
Understanding these basics is critical because all option strategies are built using calls and puts in different combinations.
3. Why Use Option Strategies?
Traders and investors don’t just buy calls and puts randomly. Instead, they use structured strategies to achieve specific goals:
Hedging: Protecting a stock portfolio against downside risk.
Income Generation: Earning premium by selling options.
Speculation: Taking directional bets with limited risk.
Volatility Trading: Profiting from changes in implied volatility regardless of direction.
4. Categories of Option Strategies
Option strategies can be grouped into four main categories:
Bullish Strategies → Profit when the market rises (e.g., Bull Call Spread, Covered Call).
Bearish Strategies → Profit when the market falls (e.g., Bear Put Spread, Protective Put).
Neutral Strategies → Profit when the market stays in a range (e.g., Iron Condor, Butterfly).
Volatility Strategies → Profit from volatility expansion/contraction (e.g., Straddle, Strangle).
5. Popular Options Trading Strategies
Let’s dive into some of the most commonly used strategies with examples, payoff logic, pros, and cons.
5.1 Covered Call (Income Strategy)
How it works: Hold the stock + sell a call option.
Example: Own 100 shares of Reliance at ₹2,500. Sell a call with strike ₹2,600 for ₹30 premium.
Payoff:
If Reliance stays below ₹2,600 → keep shares + earn ₹30 premium.
If Reliance rises above ₹2,600 → shares are sold at ₹2,600 but you still keep the premium.
Pros: Steady income, reduces cost of holding.
Cons: Caps upside potential.
5.2 Protective Put (Insurance Strategy)
How it works: Hold stock + buy a put option.
Example: Buy Infosys at ₹1,400. Buy a put with strike ₹1,350 at ₹20 premium.
Payoff:
If stock rises → unlimited upside, only premium lost.
If stock falls → downside limited at strike price.
Pros: Protects against big losses.
Cons: Premium cost reduces profit.
5.3 Bull Call Spread (Moderately Bullish)
How it works: Buy a lower strike call + Sell a higher strike call.
Example: Buy Nifty 19,800 Call at ₹200, Sell 20,200 Call at ₹80. Net cost = ₹120.
Payoff:
Max profit = Difference in strikes – net premium = ₹400 – ₹120 = ₹280.
Max loss = ₹120 (premium paid).
Pros: Limited risk, limited reward.
Cons: Capped profit even if market rallies big.
5.4 Bear Put Spread (Moderately Bearish)
How it works: Buy a higher strike put + sell a lower strike put.
Example: Buy 19,800 Put at ₹220, Sell 19,400 Put at ₹100. Net cost = ₹120.
Payoff:
Max profit = Difference in strikes – net premium = ₹400 – ₹120 = ₹280.
Max loss = ₹120 (premium).
Pros: Controlled bearish play.
Cons: Capped profit.
5.5 Straddle (Volatility Play)
How it works: Buy 1 Call + 1 Put of the same strike.
Example: Nifty at 20,000 → Buy 20,000 Call (₹200) + Buy 20,000 Put (₹180). Total = ₹380.
Payoff:
If Nifty moves sharply either side (>₹380), profit.
If Nifty stays near 20,000, loss of premium.
Pros: Profits from big moves.
Cons: Expensive, time decay hurts if market is flat.
5.6 Strangle (Cheaper Volatility Play)
How it works: Buy OTM Call + OTM Put.
Example: Buy 20,200 Call (₹120) + Buy 19,800 Put (₹100). Cost = ₹220.
Payoff: Needs larger move than straddle, but cheaper.
Pros: Lower cost.
Cons: Requires significant market move.
5.7 Iron Condor (Range-Bound Strategy)
How it works: Combine a Bull Put Spread + Bear Call Spread.
Example:
Sell 19,800 Put, Buy 19,600 Put.
Sell 20,200 Call, Buy 20,400 Call.
Payoff: Profit if Nifty stays between 19,800–20,200.
Pros: Income from stable markets.
Cons: Risk if market breaks range.
5.8 Butterfly Spread (Range-Bound, Low Risk)
How it works: Buy 1 ITM Call, Sell 2 ATM Calls, Buy 1 OTM Call.
Example:
Buy 19,800 Call, Sell 2×20,000 Calls, Buy 20,200 Call.
Payoff: Max profit if expiry near middle strike (20,000).
Pros: Low risk, good for low-volatility outlook.
Cons: Limited reward, needs precise prediction.
5.9 Collar Strategy (Hedged Investment)
How it works: Own stock + Buy Put + Sell Call.
Purpose: Locks range of returns.
Example: Own stock at ₹1,000. Buy 950 Put, Sell 1,050 Call.
Pros: Protects downside at low cost.
Cons: Caps upside.
5.10 Calendar Spread (Time-based Play)
How it works: Sell near-term option + Buy long-term option of same strike.
Profit: From time decay of short option while holding longer-term exposure.
Best used: In low-volatility environments.
6. Risk-Reward Analysis
Limited Risk Strategies: Spreads, Condors, Butterflies.
Unlimited Profit Potential: Long Calls, Long Puts, Straddles.
Income-Oriented: Covered Calls, Iron Condor, Credit Spreads.
Hedging-Oriented: Protective Puts, Collars.
7. How to Choose the Right Strategy
Factors to consider:
Market View (Bullish, Bearish, Neutral).
Volatility Outlook (High, Low, Expected to rise/fall).
Risk Appetite (Aggressive vs Conservative).
Capital Availability (Some require margin).
8. Common Mistakes in Option Strategies
Over-leveraging (buying too many contracts).
Ignoring time decay (theta).
Trading only naked options without strategy.
Not adjusting positions when market moves.
Misjudging volatility.
9. Advanced Insights
Option Greeks: Delta, Gamma, Theta, Vega, Rho – help measure sensitivity to price, time, and volatility.
Implied Volatility (IV): Crucial in pricing; high IV inflates premiums, low IV reduces them.
Adjustments: Rolling options, converting spreads to condors, hedging with futures.
10. Conclusion
Options trading strategies are powerful tools. They allow traders to make money in bullish, bearish, sideways, or volatile markets – but only if used with discipline. A successful trader doesn’t just guess direction; they analyze market conditions, volatility, risk tolerance, and then select the appropriate strategy.
The beauty of options lies in flexibility: you can limit risk, enhance returns, or even profit from time and volatility itself. But the danger lies in misuse – options should be treated as structured financial instruments, not lottery tickets.

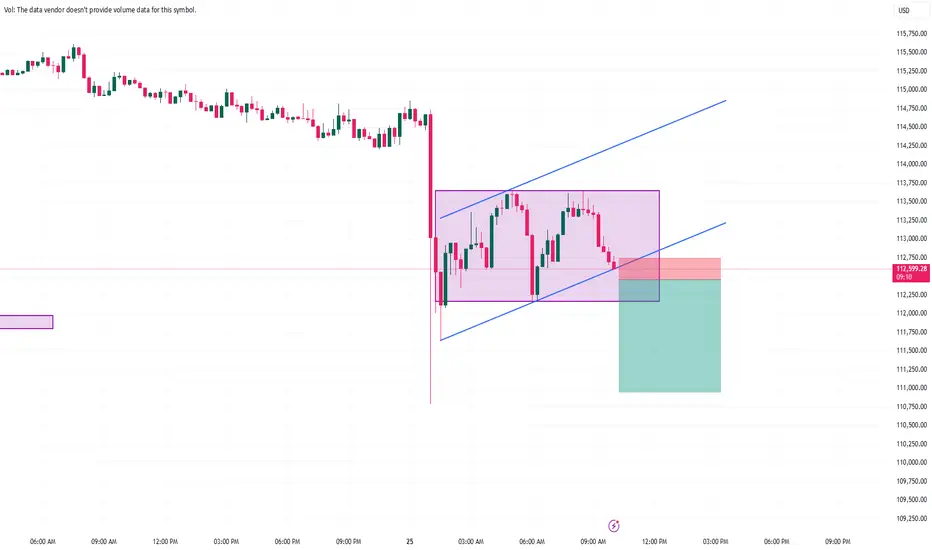
Trade Idea: BTCUSD – Rising Channel Breakdown Setup
🔍 Market Context
BTCUSD recently formed a rising channel (marked in purple) after a sharp sell-off. This is typically a corrective structure within a larger downtrend. Price action shows multiple rejections near the upper boundary of the channel, suggesting weakening bullish momentum.
Currently, the price is testing the lower channel support. A break below this level would confirm bearish continuation.
📊 Trade Setup
Type: Short (Sell)
Entry: Breakdown of channel support (~112,750 region)
Stop Loss: Above the recent minor swing high (~113,050)
Target: 111,360 (first target), extended towards 110,950 (second target)
Risk/Reward Ratio: ~5.28 (favorable)
✅ Why This Setup Looks Attractive (Pros)
Clear Structure: Price is respecting the channel, and breakdown setups often trigger sharp moves.
Strong Risk/Reward: Small stop-loss compared to potential downside.
Trend Continuation: Aligns with the broader bearish pressure seen earlier.
Volume Confirmation (if checked): Breakdowns with increasing volume add conviction.
⚠️ Risks To Consider (Cons)
False Breakouts: BTC is known for liquidity hunts; price may dip below the channel only to bounce back.
Support Zones Below: Strong demand around 111,000–110,750 may cause choppiness.
Macro Factors: News or sudden volatility can invalidate technical setups.
Risk Management Needed: Without discipline, tight stops can get hit quickly in crypto.
📌 Trade Management
Stop Loss Discipline: Never move stop away from risk.
Trailing Stop: Can be applied once price moves in favor by 1R to lock partial profits.
Scaling Out: Take partial profits at 111,360 and hold remainder to 110,950.
📈 Probability Outlook
Bearish Continuation Probability: ~65%
False Breakout / Pullback Probability: ~25%
Channel Hold & Reversal Probability: ~10%