Bearish Harami Pattern: Spotting Reversals with Discipline🔻Bearish Harami Pattern: Spotting Reversals with Discipline
Intro / Overview
The Bearish Harami is a candlestick reversal pattern that often appears at the end of an uptrend.
It signals a possible shift where bullish momentum weakens and sellers begin to step in.
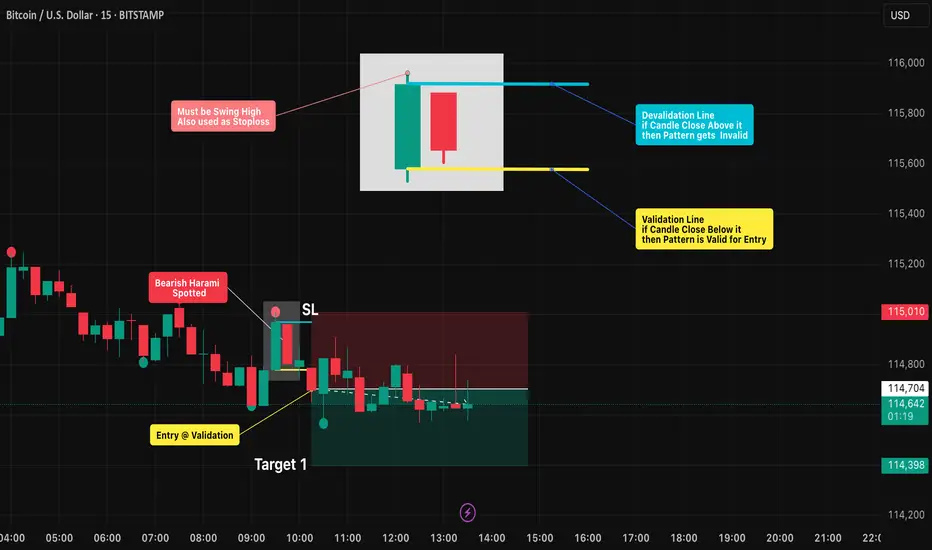
The first candle’s high must be a swing high , and this level can also be used as a stop-loss reference.
To trade it effectively, spotting the formation is not enough — strict validation and invalidation rules are key to avoid false signals.
✨ Concept
A Bearish Harami is a two-candle pattern:
- First candle (Green🟢): A strong bullish candle showing buyer dominance.(Swing high)
- Second candle (Red🔴): A smaller bearish candle whose body is fully inside the prior green candle’s body (wicks ideally inside).
This forms the “harami” structure, where the red candle looks like it is “inside the green candle,” suggesting a pause in bullish pressure and potential reversal.
📖 How to Use
1️⃣ Identify the pattern: Look for a large green candle followed by a smaller red candle contained within it.
2️⃣ Validation Point: The setup is validated if price closes below the open of the green candle within the next few candles.
3️⃣ Invalidation Point: The setup is invalidated if price closes above the close of the green candle before validation occurs.
4️⃣ Stop-Loss & Targets:
- Stop-loss (SL): Place at or just above the swing high (first green candle high).
- Target (TP): 1x, 2x, or more times the distance between entry and stoploss.
5️⃣ Enhance Reliability: Combine with resistance levels, trendlines, moving averages, or other candlestick signals to filter out weak setups.
📊 Chart Explanation – Step by Step
✔ The Bearish Harami pattern was spotted after a clear uptrend.
✔ The following candle closed below the green candle’s open → Validation confirmed ✅.
✔ A short entry was taken on the same candle.
✔ A Bearish Harami pattern has also been drawn and highlighted on the chart.
🔍 Observation
- If Target 1 is achieved → book 2 lots , and trail the remaining position with a stop-loss.
- Harami is only a potential reversal → confirmation is necessary.
- Breakdown below the green candle’s open = sellers in control 🔻.
- Breakout above the green candle’s close = setup failure ❌.
- Patience is key — wait for confirmation before entering.
📌 Why It Matters?
The Bearish Harami helps traders by:
- Reducing false reversal trades with strict rules.
- Providing clear entry/exit levels with discipline.
- Enforcing risk management via pre-defined SL & TP.
✅ Conclusion
The Bearish Harami becomes powerful when traded with discipline.
By marking the open and close of the green candle, traders can clearly separate a valid short trade from a failed setup.
With a stop-loss at the swing high and take-profits at 1x, 2x, or more, while trailing further lots, the Harami offers a structured, rule-based strategy.
⚠️ Always remember: the pattern shows possibility → price confirmation makes it probability .
⚠️ Disclaimer
For educational purposes only · Not SEBI registered · Not a buy/sell recommendation · No investment advice — purely a learning resource
BTCUSD.PI trade ideas
BTCUSD Key Zones: Supply/Demand Analysis & Breakout ScenariosThis chart highlights critical supply and demand zones for BTCUSD, mapping out possible bullish and bearish scenarios. If the price breaks above the supply zone, a sharp move towards 120,000+ is possible. Conversely, if the demand zone fails, BTCUSD could retest 108,000 or lower. Monitor these areas for effective risk management and potential intraday trades. Let me know your views on breakout or reversal setups in the comments!

Bitcoin – Medium-Term OutlookBitcoin – Medium-Term Outlook
Hello traders,
BTC recently made a strong breakout move, reacting precisely at the 117k level as expected. Currently, price is in a corrective phase, clearing the liquidity from last Friday’s bullish candle. The sharp rejection at 117k suggests we need to reassess the medium-term outlook.
The primary scenario remains bullish. The 113.4k zone is a key area to look for long entries, as buyers dominated this level earlier and liquidity from short traders still sits here. From a psychological perspective, we could see shorts exiting the market, fuelling a rally towards 115.7k. A confirmed break above 117k would strengthen the long-term bullish trend, opening the door for further long opportunities.
On the flip side, a reaction lower from 115.7k could present a short entry for the medium term. If support at 111.7k breaks, BTC may extend down to 110k, where strong historical rejections suggest a solid zone for fresh long positions in both medium and long-term outlooks.
This outlook is based on key support/resistance levels and major liquidity zones. Always trade with discipline and manage risk carefully to protect your account.
What’s your view on BTC here? Share your thoughts in the comments so we can trade smarter together.

#BITCOIN what next!!!as you can till now chart have worked till now, but now bitcoin can go in time correction or price correction between range (120000-80000)
with having triple divergence on weakly. Interesting time ahead. Upside not favorable

Bitcoin – Bullish Setup Forming After FVG Retest!Hello Traders!
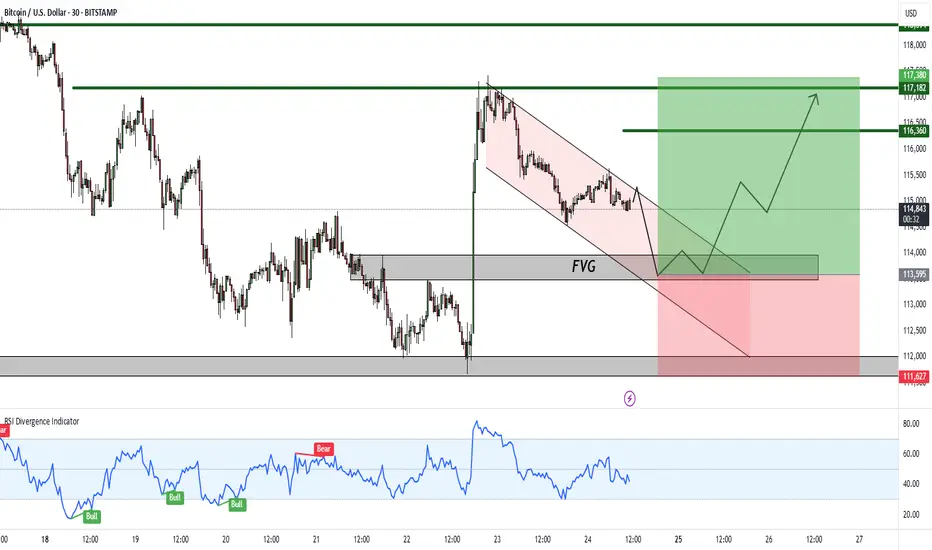
Bitcoin is currently showing signs of forming a bullish setup after rejecting lower levels. The price has created a clean FVG (Fair Value Gap) zone and is moving within a falling channel, suggesting a possible accumulation before the next leg up.
Key Observations:
FVG Support: Price is likely to retest the FVG zone before a strong upward move.
Falling Channel: The structure indicates potential breakout to the upside.
RSI Divergence: Momentum indicators are showing signs of strength, supporting a bullish reversal case.
Targets: The upside targets are marked at 116,360 – 117,380 – 118,394 levels.
Invalidation: A breakdown below 111,627 would negate this bullish setup.
Rahul’s Tip:
Always wait for confirmation around the FVG zone. Entering too early may expose you to false breakouts. Risk management is crucial, especially in volatile assets like Bitcoin.
Disclaimer:
This analysis is for educational purposes only and not financial advice. Please do your own research before making any trading decisions.
BTCUSD 4 Hours View Support Zones & Turning Points
** ~$115,000 Pivot Zone**
A consolidation area around $115,000 (± $600) acts as a short-term support base and momentum gauge.
~$117,430 (4H MA50)
The 50-period moving average on the 4H chart sits near $117,430, serving as a dynamic support level.
Previous ATH zones ($110K–$112K)
These levels have historically flipped as support after bullish retreats.
Resistance & Overhead Supply
$120,000 Psychological Barrier
A major round-number resistance that needs to be overcome for sustained bullish momentum.
$121K–$123K (Current and Previous ATH Range)
These levels remain formidable obstacles, marking the highest recent peaks.
$124,500 Zone
The recent all-time high, now under challenging supply and selling pressure.
Elliott Wave & Retracement Support
~$118,657 (38.2% Fibonacci retracement)
This level aligns with the corrective wave (Wave IV) in the Elliott Wave count, suggesting a solid bounce zone for potential Wave V continuation.

BUY SETUP The market is showing signs of strength as demand builds up after recent consolidation.
Price action reflects buyers defending key zones, with rejection wicks and momentum candles confirming interest.
This structure suggests that bullish sentiment is increasing, with the potential for a continuation move to the upside.
A long bias is favored as long as the current market structure holds, supported by higher lows and sustained momentum.
Monitoring follow-through strength, volume confirmation, and the ability of buyers to push through near-term barriers.

BTC/USDThe BTC/USD trade with an entry price of 114,895, stop-loss at 115,259, and exit price at 114,176 is a short-term sell trade setup focused on capturing a downward move in Bitcoin. The potential profit from this trade is around 719 points, while the risk is limited to roughly 364 points, offering a favorable risk-to-reward ratio of about 1:2.
The entry price at 114,895 suggests the trade was initiated near a resistance zone where price showed weakness or bearish rejection. Traders often look for confirmation signals such as candlestick patterns, RSI overbought levels, or MACD crossovers before entering a sell position at such levels.
The stop-loss at 115,259 is placed just above resistance, ensuring that if the market moves upward unexpectedly, losses are capped.
The exit price at 114,176 serves as the take-profit target, positioned near a support level to secure gains before any reversal.
This setup reflects disciplined BTC/USD trading by combining technical signals, strict risk control, and a well-defined profit objective.

BTCUSD – Short Opportunity Building 30m Chart1. Price rejected from the supply zone near 115,700–115,800, showing resistance.
2. Current structure has shifted bearish with lower highs after rejection.
3. Key intraday support stands at 115,100–115,000; a sustained break below could accelerate downside.
4. Next demand levels to watch: 114,280 and 114,116, aligning with liquidity zones.
📉 Plan:
Short entries remain valid below 115,300.
First target: 114,280
Extended target: 114,116
Invalidation above 115,800.
Recommendation: Monitor for clean bearish continuation; keep risk tight due to BTC volatility.

sell The market is displaying weakness as supply pressure dominates after repeated rejections.
Price action reflects sellers defending resistance areas, with exhaustion signs and momentum shifts pointing lower.
This structure suggests that bearish sentiment is gaining traction, with the potential for a continuation move to the downside.
A short bias is favored as long as the current market structure remains intact, supported by lower highs and persistent selling momentum.
Monitoring follow-through strength, volume confirmation, and the ability of sellers to break through near-term supports.

sell Market is showing weakness after repeated resistance tests.
Sellers are stepping in with momentum, signaling potential continuation to the downside.
The setup favors a short position as long as the current structure remains intact.
Watching for sustained selling pressure and follow-through toward lower levels.

"Bitcoin Eyes $100K Re-Entry: Retest, Support Zone, Then Push ?Chart Analysis
1. Price Structure & Trendlines
The chart displays a former upward trendline that has been broken, leading to a corrective pullback.
Following that, price is perched within a “retest zone” (the red-shaded rectangle), which aligns with both historical horizontal resistance—now turning into support—and an area of previous consolidation. This is a classic setup: price often retests key breakout levels before resuming its move.
2. Support Levels
The main support is clearly drawn around the $100K zone, highlighted by a grey bar below the retest zone. This is a psychological and structural area to watch for potential strong buying.
Immediate support appears near $110K–$112K, as noted by the lower edge of the red retest area—this zone has shown to catch corrections before in technical analysis and news reports
AInvest
Mudrex
Barron's
.
3. Resistance & Upside Targets
If the retest holds, the chart charts a potential bounce toward the upper rising trendline and beyond, potentially aiming for the $126K–$130K region, as marked by Fibonacci retracement levels.
This aligns with several external forecasts suggesting resistance or target zones in that range
AInvest
Mudrex
Barron's
.
4. Potential Price Path & Scenarios (Denoted by Red Arrows)
Bearish Scenario: Price may dip down into the retest zone, test support, and—if the breakdown occurs—continue lower toward $100K—a key area of interest.
Bullish Scenario: The support holds, leading to a V-shaped recovery that propels price back above $115K, potentially triggering a rally toward $122K–$130K.
Summary Table
Key Zone / Level Significance & Note
$110K–$112K Critical near-term support; breakdown risks move toward $100K
AInvest
Mudrex
Retest Zone (~$114K–$115K) Area combining horizontal support and trendline; serves as pivot for next move
Mudrex
AInvest
$120K–$123K Major resistance where a breakout could fuel continuation toward $127K–$130K
Mudrex
Barron's
Broader Context & Market Sentiment
Bitcoin is currently consolidating after setting new highs near $124K
MarketWatch
The Economic Times
Barron's
Cointribune
.
Analysts observe that sustaining above the $110K–$112K band is essential to the bullish case; falling below it could invite deeper downside
Barron's
Cointribune
AInvest
.
Conversely, a decisive move above $120K–$123K could validate continuation toward $127K–$130K, and even higher—some forecasts extend to $135K and beyond
Mudrex
Indiatimes
Barron's
CoinCodex
.
Final Thoughts
Your chart beautifully illustrates the classic “retest after breakout” dynamic:
Hold above the retest zone? Look for a rebound toward $120K+, with the potential for a full bullish revival aiming for $130K.
Break below $110K–$112K? Watch for a possible move toward $100K—a critical support level.
Stay alert to macro catalysts too—like Federal Reserve interest rate signals, institutional inflows (ETFs), and regulatory developments—which could steer the next leg substantially

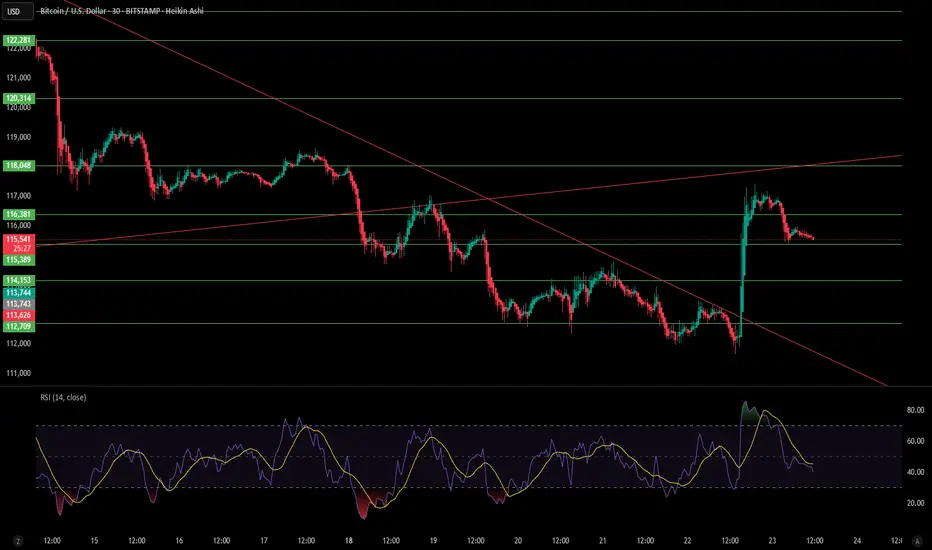
Bitcoin (BTC/USD) – 4H Chart AnalysisBTC is currently trading at $115,669 after a recovery bounce from the $112,700 support zone. Price recently broke above the descending trendline (red), signaling a potential shift in short-term momentum.
Key levels to watch:
🔴 Immediate Resistance: $116,000 – $116,380
🟢 Supports: $115,389 / $114,153 / $112,709
📈 Higher Resistance Zones: $118,048 / $120,314 / $123,273
The RSI (14) is currently at 55.96, slightly above neutral, suggesting BTC has room to move either direction without being overbought or oversold.
📌 Bullish Scenario: A break above $116,380 could open the way to retest $118,000 and possibly $120,000.
📌 Bearish Scenario: Rejection from current resistance may lead to a pullback toward $114,000 – $113,700, with deeper downside risk if $112,700 fails.
⚖️ Outlook: BTC is trying to regain bullish momentum after a recent downtrend. A decisive move above $116K will be crucial for further upside.
BTCUSDIdea 1- Pullback to retest the H1 supply zone.
Idea 2- Rejection of the level and retracement to the H4 demand zone, coinciding with the fib kill zone. (Enter based on confirmation only).
Idea 3- Bullish continuation on the higher timeframe. (Enter based on confirmation only).
Sharing idea for educational purposes only.

High Probable down side trade in BTCwe see a good high probability downside trade in BTC at 30 minute.
MB, FVG and OTE all three are forming cluster at that zone which may lead to a good sell trade

Bitcoin Trend – Breakout from the Downward ChannelBitcoin Trend – Breakout from the Downward Channel
Hello traders,
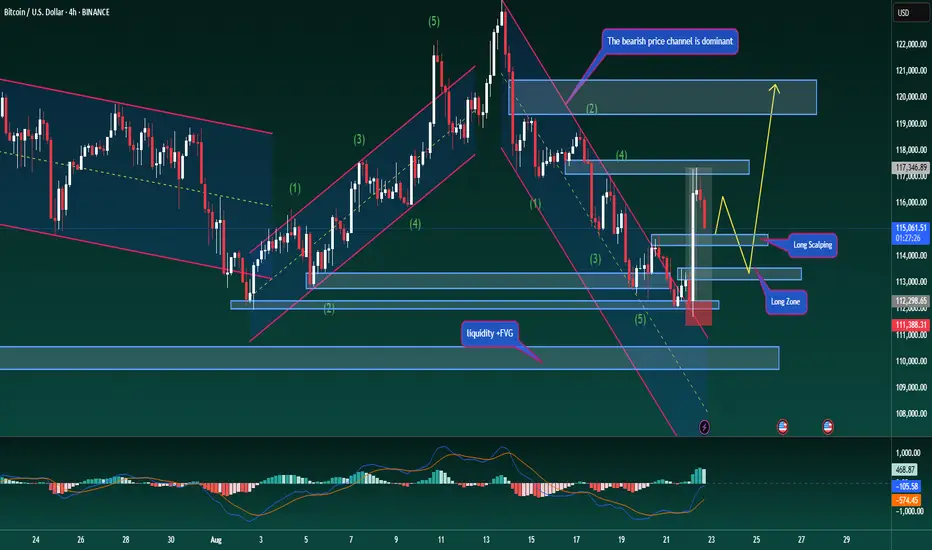
BTC has broken out of its descending channel with a very strong candle, moving exactly as expected in the corrective rally. At present, price is reacting around 117k, which confirms a shift in structure. For the medium term, the primary trend should now be considered bullish. Traders can look for pullbacks around 114.5k – 113k to add fresh long positions.
From an Elliott Wave perspective, BTC is moving within the final ABC structure. The current move is wave B, and we will be looking to position long once wave C completes.
Target for this long scenario: 120k – 121k, where a mild correction may occur as liquidity is taken.
This is my personal outlook on Bitcoin. Always follow price closely and manage your account carefully to stay safe.
What’s your view on BTC’s breakout? Share your thoughts in the comments so we can trade better together.
Bitcoin – Medium-Term Outlook for Long/Short TradersBitcoin – Medium-Term Outlook for Long/Short Traders
Hello traders,
BTC continues to move within the descending channel – something we can all clearly see. Recently, price bounced strongly after touching the solid support zone near 112k, and now it is only about 2k away from the target level for a potential swing long entry.
If BTC manages to break above the 114.8k resistance, it could signal a short-term reversal, pushing towards 117.5k before resuming the broader downtrend. This scenario could act as a potential trap for those holding long-term short positions.
We also see early signs of structure changing: the trendline has already shown signs of breaking, with price trading above the descending channel. At the same time, MACD is showing rising volume and its averages are starting to curve upward. Together, these factors support the case for a short-term corrective rally.
Strategy: Consider long entries near the current zone, with the option to DCA if price breaks above 114.8k.
Please note this is my personal view — always manage risk and follow your own plan.
What’s your take on this setup? Share your thoughts in the comments so we can discuss further.
BTC entering Wave DBitcoin has likely ended Wave C in a diametric formation.
It could now entered Wave D, which itself would be a corrective rise.

BTC update....“BTC has taken strong support at the 112,000 level and has now formed a bullish Cup and Handle pattern. The current structure looks bullish; however, if BTC attempts to form a new low, it is likely to test the external kill zone, which will also serve as our downside target.”

BTCUSD IS NOW AT REVERSALWhat i am saying will depend on YELLOW HORRIZONTAL line which is previous resistance and support as well.
you can see blue trend lines which is on work .
One more thing is here that one out side reversal is visible which is forming a pattern drawn in white thick & thin line togather.
If you see closely there is a ratio 1:1
wher pattern is drawn if i say more clearly then see recent swing high and low then you find that both swings are almost same not exactly but probably it is same so what i am saying that there may be possiblity of reversal .One can look for that.
this is not my buy/sell call.

Bitcoin 1 Day view Support Levels:
$112,000 — a critical short-timeframe level; a sweep below this could trigger opportunities according to @CryptoMichNL.
$113,000–$114,000 — active support zone where traders are positioning, as noted by Greeks.Live.
$111,200–$112,700 — a daily + 4-hour Fair Value Gap (FVG) support area. Holding this region may prevent further downside.
Resistance Levels:
$115,000 — identified as a pressure zone by crypto observers; its breach could lead to renewed momentum.
$115,700–$116,100 — Fibonacci-style resistance tiers from Barchart’s pivot-point analysis.
What to Watch Next
If BTC holds above $112,700–$113,000: Could attract buyers looking for a bounce, possibly aiming toward $115K+.
If BTC breaks below $112K: Risk of deeper correction; next meaningful stop near $111K.
If BTC clears $115K: Likely opens the path toward the $115.7–$116.1 zone and beyond.

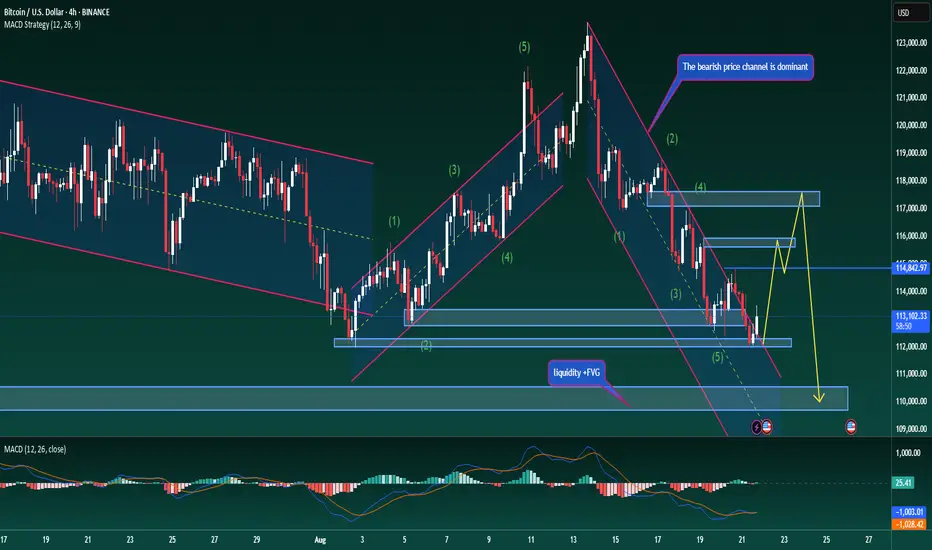
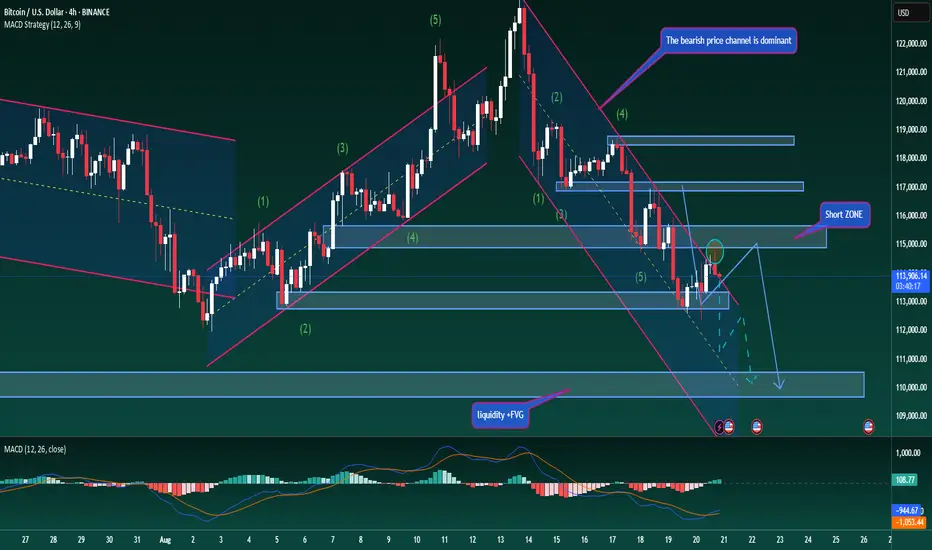
Bitcoin – Continuing to Follow the Bearish StructureBitcoin – Continuing to Follow the Bearish Structure
BTC has continued to follow the earlier analysis, with price moving back towards the 115,000 zone and resuming its downward waves. The descending channel remains intact and is guiding price action, with the next target area expected near 110,000.
To reach this level, BTC may form another Dow-style downward leg, closely tracking the trendline within the channel. That said, traders should be cautious — MACD is showing rising volume and the moving average is beginning to turn upward, which could be an early warning sign against aggressive short positions.
In trading, following the main trend is always the priority. Going against the market should only be considered when there is clear evidence of large liquidity zones or strong trader sentiment at key levels. Otherwise, trading in line with the prevailing trend remains the safer approach.
For BTC, the strategy is to keep following the descending channel and look for entries at trendline touches. Short-term scalping opportunities may arise around 112,600 and 111,800. The medium-term short entered near 115,000 remains active, with targets set towards 110,000. This zone will also be watched closely as a potential buying area, and decisions can then be made on whether to hold positions for the longer term.
This is my trading outlook for BTC. I hope the scenarios are useful, and I’d love to hear your views in the comments.
#BTCUSD #Bitcoin #CryptoAnalysis #TechnicalAnalysis #PriceAction #Trendline #DowTheory #MACD #CryptoTrading #SwingTrading
btc trade --paper tradingBitcoin is currently trading in a sell zone, indicating potential downward pressure. Technical indicators suggest overbought conditions or resistance near key levels. Traders may consider tightening stop-losses or booking partial profits. Stay sharp and monitor price action closely—volatility could spike.
