BTC TRADE IDEA how btc chart works in Coming some time but BTC Bulish in consolidated zone. monday btc revesre in bullish trend
BTCUSD.PM trade ideas

BTC ew updateBTC USD completed THE WXY PATTERN, and now forming a pattern with 5 wave upside on first leg, which opens up more than one opportunity, like ABC- zigzag, LD first wave 1-3 have formed under this, it can be LD as well, it can 1-1-1 ew combination as well, it will interesting to see what folds out.
Now the sturcture based on counts looks like DIANGONAL
1- LD- first wave complete,third is also complete, 1st wave is long, 3rd wave is less than 161,
4th is done and 5th is going,
Structurewise it fits in LD, it has not broken any trendlines.
Fib wise it also fits in this criteria and 5th wave is also reached 61.8 which complete another criteria.
3- 1-2,1-2,1-2 sequence of bullish pattern can also be possible, first sequence is done, 2nd is also done, 3rd impulse in underway.
structure looks ok
lines looks ok
fibs looks ok.
Lets see how it turnsout.

Bitcoin buy active from 99300 ,still no sell signal buy dipHow to take trades using Harmonic pattern projection Trade setup is explained below :-
To take Fresh trade : EARLY etry willl be above/ below 13.5% level . Safe traders can enter above or below 27.3% level
Targets :
Target T1 is 27.3% if you are taken entry from 13.5% if taken entry from 27.3 then Target T1: 38.2 % level is our 1st Target
( 38.2% if also a reversal zone so if price reverse then we can make fresh entry also).
T2: 50% level is our 2nd Target
T3: 61.8% to 65 % is our 3rd Target
( This is also reversal zone so we have to book profit at this area and if break then take fresh entry with SL of 2nd Target 50% .)
Next Targets are 78.6 % , 88.9 % 100% , 113.5 % , 127.2% , 141.5% and 161.8% to 165%.
161.8 to 165% if profit booking area so book full profit and wait for reversal.
How to take reversal trade :
If price going upside/ downside then then buy or sell levels appear on Chart ( Automatically show when price reach any reversal zone of harmonic projection pattern based .
After showing reversal levels wait for confirmation until 13.5 % or 27 .6 % level not break if break then exit from current buy / sell trade and take fresh reverse trade buy/ sell .
Trailing SL:
After reach 1st Target trail SL to just above or below cost ( for example we are holding sell trade from 100 1st Target 110 hit then move trailing sl to 104-105 and move SL as price move upside or Downside)
Blue Line is 1st support/ Resistance
Green line is 2nd support/ resistance
Red line is 3rd Support/ resistance

BTCUSD 15 MIN ANALYSIS As we can see BTCUSD is trading in sideways in 15 min tf recently it gives break down breaking the downside range here according to my analysis short position is better with more than 1:2 RR set up. This is my own analysis I reserve the right to be wrong. This is just for education purpose only.

(Lunar New Year Special) Bitcoin Bybit chart analysis january 24Hello
It's a Bitcoinguide.
If you have a "follower"
You can receive comment notifications on real-time travel routes and major sections.
If my analysis is helpful,
Please would like one booster button at the bottom.
Bitcoin 4-hour chart
This is the main drawing section.
It seems to have taken about 2 and a half hours just to draw it.
The section where the flag is marked is the section where the daily chart is created,
and the last flag is January 31st, when the holiday ends.
This week, there has been absurd and bizarre repetition of
unasked rises and unasked falls.
The reason is that after the report was updated,
as I explained in detail in the last video,
it is right before the bitcoin price skyrockets.
Based on the Bollinger Band weekly chart, it is important to see whether the resistance line is touched first
(a major rise)
and whether the MACD dead cross on the weekly chart
will occur first,
and adjustments and sideways movements will occur.
Based on that, if you look at the high and low points on the right,
I have indicated the prices.
At the very top, 117,182 dollars touches the weekly chart resistance line,
moving towards a mid-term upward trend
If 99,703 dollars at the bottom is broken first,
it will be the place where the weekly candle low is broken.
It would be bad if the two light-colored sky-blue support lines I drew were broken.
Because it is the place where the sideways movement and support line are broken,
I calculated the main section, so
I think it would be good to refer to it.
This is a 30-minute chart of Tether Dominance moving in the opposite direction of the beat.
Today, in terms of the pattern,
it touched the 5-minute and 15-minute resistance lines,
and the 30-minute chart resistance line section order.
I carried out a short position strategy in the sky blue finger section/strong downward section.
In the case of Tether Dominance,
the 6-hour chart and 12-hour chart MACD dead cross are currently in progress.
I applied it to Bitcoin as is.
Here is the Bitcoin 30-minute chart.
There is a Nasdaq indicator announcement at 12 o'clock tonight.
The Nasdaq is in the process of a 6-hour MACD dead cross,
and I judged that this section is not very dangerous.
The short-term pattern is still alive,
and the MACD golden cross is imprinted on the weekly chart,
and even if there is a strong adjustment in Nasdaq,
since the 1+4 rising pattern is waiting,
I focused on the rise and proceeded with the strategy.
*One-way long position strategy when the red finger moves
1. $104,740 long position entry section / stop loss price when the green support line is broken
2. $109,231.5 long position 1st target -> target price in order from the top
Based on the Tether dominance movement and the Bitcoin pattern,
I focused on the rebound from the 30+1 pattern.
Up to the first section, it is a sideways movement, and from the top section, it is a new record, and if it reaches this point, it will continue to rise significantly.
In preparation for a strong adjustment in Nasdaq,
I maintained the stop loss price for the 30-minute support + 1-hour support of the second section, which is marked as the final long position waiting section.
If it touches the bottom section today,
It is not good because the daily chart low is broken.
If it falls to 101.4K at the very bottom,
Pay attention to the 6+12 pattern that was not recovered yesterday.
Basically, if it comes down to this section,
It is not good because the center line of the 12-hour Bollinger Band chart has been touched several times,
and the support line of the 6-hour chart is also open.
Please refer to the final support line explained at the mid-term point at the top.
Today, I explained it in detail for the first time in a while,
and I did my best to analyze a week's worth,
I hope it was helpful for your actual trading.
Up to this point, I ask that you simply use my analysis for reference and use only
and I hope that you operate safely with principle trading and stop loss prices.
Since it's a long holiday,
don't just look at the charts,
and I hope all my followers have a good time with their families next week on Lunar New Year.
Happy New Year.
Thank you always.

BTC EW updateBTC USD COMPLETED THE WXY PATTERN, and now forming a pattern with 5 wave upside on first leg, which opens up more than one opportunity, like ABC- zigzag, LD first wave 1-3 have formed under this, it can be LD as well, it can 1-1-1 ew combination as well, it will interesting to see what folds out.
Options are
1- Abc pattern SZZ-- structure wise ok, fib ext. Was ok.
2- LD- first wave complete,third in under going, 1st wave is long, 3rd wave is less than 161,
3- 1-2,1-2,1-2 sequence of bullish pattern can also be possible, 1-2,1-2,1-2 is also possible, first sequence is done, 2nd is underway.
Price did complete 3rd wave with 100% and retraced forming another, WXY pattern. Now probability of SZZ is complete but no big fall hints that is could be other two patterns, so long the position .

BTCUSD TRADING POINT UPDATE > READ THE CHAPTIANBuddy'S dear friend 👋
SMC Trading Signals Update 🗺🗾 Cryptocurrency Traders SMC-Trading Point update you on BTC USD Trading Signals BTC USD still holding it down trand 107k 3 Time rejected oderbolk ) 105k) rejected again Short Trade now 3H Time Frame 🖼️ target point 99k)
Key resistance level 107k) 109k)
Kye support level 102k) 101k ) 99k)
Mr SMC Trading point
Support💫 My hard analysis Setup like and following me 🤝 that star ✨ game 🎮

Bitcoin Outlook: Bullish Momentum with the New YearWith Donald Trump now back as President in America, the success of initiatives like Trump Coin serves as an example of what’s possible. Similarly, Bitcoin appears poised to attempt a new high as we enter the new year.
However, before that, we’re seeing some bearish retests and market pullbacks. These corrections are part of the process before Bitcoin pushes toward a new high.
I’ve explained the analysis in detail on the chart for better understanding.
Don’t forget to like, comment, and follow for more updates!

BTCUSDBitcoin is currently trading below the neckline of a bearish Head & Shoulders pattern. The resistance level is at 99,600, while key support levels are at 96,000, 95,000, and 92,000.

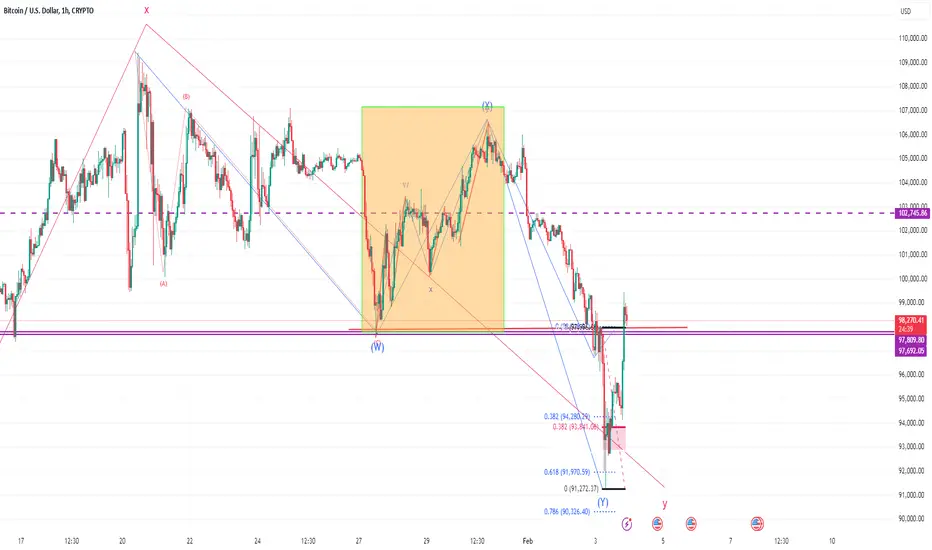
Bitcoin UpdateAs explained earlier, structure in shade was looking like, LD but it turnout to be WXY and broke below the low of entire LD. Over all pattern turned Higher degree WXY and an inregular correction in 4h Time frame. It looks more complex .
In WXY pattern Y usually is Simple zig zag means two moves to the downside.
1 is complete and it may take some time and make intermediate high and turn lower for another lower low.
Now it has completed the move down and broken the 38% of last move and provided an implusive move which we were expecting case of LD.
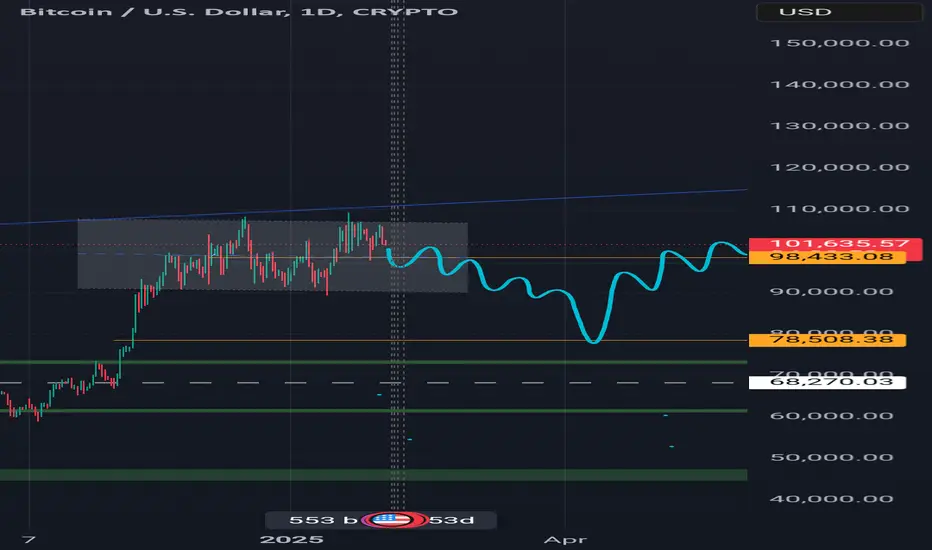
Btc q1 of 2025 outlook and forecast by lokendra Bitcoin Q1 2025 Outlook: Potential Dip Before a Strong Rally
Bitcoin is currently trading at $101,500, but a significant correction may be on the horizon. Based on market trends and technical analysis, Q1 2025 could see a bearish phase before a strong recovery.
One of the key factors influencing this prediction is the CME gap around $78,000, which remains unfilled from previous price movements. Additionally, trendline support sits around $74,000, making it a critical level to watch. Given the prevailing sell-side pressure, Bitcoin could gradually bleed downward, testing these levels before a meaningful recovery.
However, after reaching these support zones, a strong rebound could follow. If the U.S. markets remain strong and macroeconomic conditions support risk assets, Bitcoin could potentially rally to $180,000 later in the year. The price action is likely to be volatile, with short-term recoveries occurring amid the broader downtrend.
Overall, Q1 2025 may present an opportunity for long-term investors looking to accumulate at lower levels before Bitcoin resumes its upward trajectory. Traders should remain cautious, as sharp moves in both directions are expected. Monitoring market trends and key support levels will be crucial in navigating this volatile period.
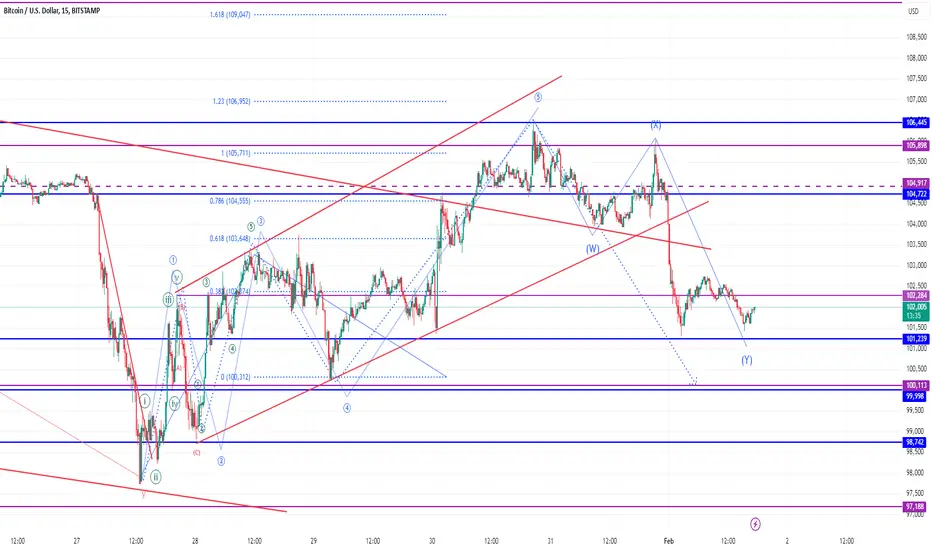
BTC EW Update 01-febIn reference to my earlier post,
As I mentioned in my analysis it Can be a Leading diagonal structure.
It has turn out almost the same. Under the rules of LD wave 4 is overlapping wave 1 and and wave 3 is not extended and wave 5 is more than 61.8% hence extended and move from wave 5 to downside as 3-3-3 WXY correction has broken the trendline as normally happens with the LD and now we are looking for completion of wave Y and than break out 38.2% of last fall and long for next upside. Invalidation point is break of low of 1.
Than this structure will turn out in Triple Zigzag.
Btc pattern Btc first hit target 104878 then next target try 106855 and next 10334 again soo keep eyes on chart

btcBitcoin is an innovative payment network and a new kind of money. Find all you need to know and get started with Bitcoin on bitcoin.org.

BTCBitcoin is an innovative payment network and a new kind of money. Find all you need to know and get started with Bitcoin on bitcoin.org.

Breakout and Breakdown Strategy in 3D Time FrameTrend-Based Fibonacci Extension Levels (3-Day):
CRYPTO:BTCUSD
COINBASE:BTCUSD BINANCE:BTCUSD OANDA:BTCUSD MARKETSCOM:BITCOIN FOREXCOM:BTCUSD BITFINEX:BTCUSD OKX:BTCUSD BITMEX:BTCUSDF2025 KRAKEN:BTCUSD EASYMARKETS:BTCUSD OKCOIN:BTCUSD VANTAGE:BTCUSD BYBIT:BTCUSDT WEBULLPAY:BTCUSD WEBULLPAY:BTCUSD CRYPTOCOM:BTCUSD MEXC:BTCUSDT HTX:BTCUSDT UPBIT:BTCUSDT BYBIT:BTCUSDC UPBIT:BTCUSDT
1. Breakout Strategy
This strategy is for when the price breaks out above the 400% level or breaks down below the 361.80% level.
Bullish Breakout (Above 400%):
Trigger: A strong close above the 400% level, ideally with increased volume. Look for confirmation from indicators like the MACD (crossing bullish) or the Daily CMO moving higher from its low value.
Entry: Enter a long position just above the breakout candle high to avoid false breakouts.
Stop-Loss: Below the 400% level or the nearest support level, such as the 391% region.
Targets:
First Target (T1): 423.60% (next major resistance).
Second Target (T2): 450% if bullish momentum strengthens.
Bearish Breakdown (Below 361.80%):
Trigger: A strong close below the 361.80% level with confirmation (e.g., bearish MACD continuation or CMO dipping further negative on both Daily and 3-Day).
Entry: Enter a short position just below the breakdown candle low.
Stop-Loss: Above the 361.80% level or the last significant swing high.
Targets:
First Target (T1): 330% (midway support).
Second Target (T2): 261.80% (strong pullback level).
2. Range Trading Strategy
If the price continues to trade between the 361.80% and 400% levels, this strategy involves buying at support and selling at resistance.
Key Steps:
Entry:
Long near the 361.80% level if price shows signs of reversal (e.g., bullish candlestick patterns like hammers or engulfing candles).
Short near the 400% level if price shows rejection or reversal (e.g., shooting stars or bearish engulfing candles).
Stop-Loss:
For longs: Just below the 361.80% support level.
For shorts: Just above the 400% resistance level.
Targets:
For longs: Exit at 400%.
For shorts: Exit at 361.80%.
Indicators to Monitor in the Range:
Look for divergence between the CMO (Daily) and price at the support/resistance zones.
Use RSI: Enter positions when RSI approaches oversold (near 40) at support or overbought (near 70) at resistance.
3. Pullback Strategy
This strategy works if the price breaks a key level (either 400% or 361.80%) but pulls back to retest the level before continuing in the breakout direction.
Entry:
Bullish Pullback:
Wait for a breakout above 400%, then enter long when the price retests 400% and holds as support.
Bearish Pullback:
Wait for a breakdown below 361.80%, then enter short when the price retests 361.80% and confirms as resistance.
Stop-Loss:
Place the stop just below (bullish) or above (bearish) the retest level to manage risk.
Targets:
Bullish Target: First 423.60%, then higher extensions if momentum aligns.
Bearish Target: First 330%, then 261.80%.
Risk Management Tips
Position Sizing: Risk no more than 1-2% of your capital per trade to protect against unexpected moves.
False Breakouts: Be cautious of false breakouts—wait for confirmation (e.g., a retest or increased volume) before entering.
Multi-Time Frame Confirmation: Always confirm setups on both the Daily and 3-Day time frames, especially for breakout trades.
Final Thoughts
If you’re unsure about the direction, focus on range trading until a breakout occurs.
Watch for divergence between the Daily CMO (short-term momentum) and price. For example:
If CMO rises while price struggles at 400%, it could signal a breakout.
If CMO drops sharply as the price approaches 361.80%, a breakdown becomes likely.
Scenario Breakdown:
The price is consolidating between 361.80% (support) and 400% (resistance).
The pullback to 261.80% reflects a prior correction, indicating that this level might act as a significant support zone in the event of further downside.
The repeated rejection at the 400% level, coupled with resistance at 423.60%, confirms strong selling pressure in the current zone, preventing a bullish breakout.
MACD (3-Day):
The MACD line below the trend line with a previous bearish crossover suggests that bearish momentum dominates the 3-Day time frame. This adds to the challenges for a sustained breakout above 400%.
RSI (3-Day):
The RSI at 61 indicates moderate bullish strength but not strong enough to push the price past key resistance levels yet. The current level hints at consolidation or fading bullish momentum, depending on further price action.
CMO (Chande Momentum Oscillator):
3-Day time frame (CMO at 33): The asset still holds moderate bullish momentum on the higher time frame, although it isn’t in an overbought zone.
Daily time frame (CMO at 4.71): This much lower value indicates almost no momentum or very weak bullish sentiment in the shorter term. This divergence between time frames highlights a lack of alignment between the shorter and longer-term trends.
Interpretation of Multi-Time Frame Analysis:
3-Day Time Frame:
The asset is struggling to build momentum, as indicated by the bearish MACD crossover, rejection at 400%, and moderate CMO levels. The RSI suggests that the price is not completely bearish, but the indecision between 361.80% and 400% signals potential consolidation unless a breakout occurs.
Daily Time Frame:
The CMO at 4.71 in the Daily time frame shows that short-term momentum is almost flat. This could mean:
Bulls are losing strength, and the price could revisit the 361.80% level as support.
If there’s no significant bullish catalyst, a move lower to 261.80% might occur.
The Daily time frame momentum lagging behind the 3-Day time frame suggests that the shorter-term market activity does not yet support an imminent breakout to the upside.
Potential Scenarios:
Bearish Scenario:
The lack of momentum on the Daily time frame (low CMO and bearish MACD) suggests that the price may retest the 361.80% support level.
If this support breaks, the price could drop toward the 261.80% level, which has been a significant pullback level in the past.
Bullish Scenario:
If the price can reclaim the 400% level with volume and bullish momentum, a test of the 423.60% resistance level is likely.
A break above 423.60% could trigger further bullish continuation, but this requires alignment of both Daily and 3-Day indicators.
Neutral/Rangebound Scenario:
The asset might continue consolidating between the 361.80% and 400% levels until there’s a clear catalyst to break out of this range.
Key Insights:
Watch the Daily time frame CMO closely: The low value indicates weak short-term momentum, so any significant moves will need improvement in this indicator.
Pay attention to the 400% level: A clean breakout and daily close above this level could signal bullish strength returning.
Monitor the 361.80% level for breakdowns: If this support fails, a deeper correction becomes likely.

BTCUSD-shortprice if facing rejection from pivot level
100-50 MACD shows window of oppurtunity
10 % profit oppurtunity
low risk setup

BTC 25 JAN 2025We can observe that price has executed a significant major and internal liquidity sweep. Currently, price is positioned within a key order block or demand zone. btc has undergone a healthy retracement within the context of our prevailing uptrend. Given that liquidity has been effectively absorbed, our strategy is to wait for a break and a confirmed close above the recent highs.
Additionally, we anticipate that a candle may fill the fair value gap (FVG), which could provide further confirmation of bullish momentum. The optimal entry point will be after a clear break of structure (BOS), ensuring that we align with the direction of the prevailing trend.

Btc chart Btc 4 hours candle above 104855 close btc try 106285 target re try agin same target many time try but reject

BTC Update: for upside BTC needs to close above 104,700BTC Update: for upside BTC needs to close above 104,700. Then the next target is 114,700. Until it closes above 104706 please don't trade in upside. Any short trade should have SL around 104700 on candle closing basis. On the downside of 104706 we should see 102068

BTCUSD UpdateThe Inverse H&S pattern has played out well until now. The most like target stands at 125k for now.

BTC/USD 1H TF Analysis The BITSTAMP:BTCUSD created imbalances while declining in the 1-hour time frame.
Currently, it is resting or possibly finding support at the 100 EMA.
If the candle closes below the 100 EMA and breaks the low of the previous candle, the price may find support at 103K, and it could then move up or down based on the price action that develops.
HOPE THIS WOULD EASE UR ANALYSIS!

BTCUSD BITCOIN WEEKLY GANN ANALYSIS UPDATE 25 JAN 2025BTCUSD has broken out in 04 Nov 2024 week and therafter achieved a 6 figure high at 16 Dec 2024. We have seen consolidation between 92957 and 105351 for weeks together. Last week we made a new ATH at 109356. Gann has used many system to track the price vibrations. We can see both the highs on time coordinates on chart. Next important weeks for BTCUSD on charts are 17 Feb 2025 and 03 Mar 2025. Price staying above 105351 is positive and can be considered a new price cycle start.Note that we are yet to close above this after two ATH's. I will be watching where it goes till April 14 2025 which is the time to be vigilant in short term cycle.Above 105351 next major price hurdle is 115678. Bears can be active below 99154 so caution below this level.
Happy Trading !!!
N.B. Not a financial advice to buy or sell.With usual disclaimers as applicable within the reach of this beautiful trading analysis platform. Thanks to the developers of the program for this opportunity to use it freely to express our ideas to the community of traders.
