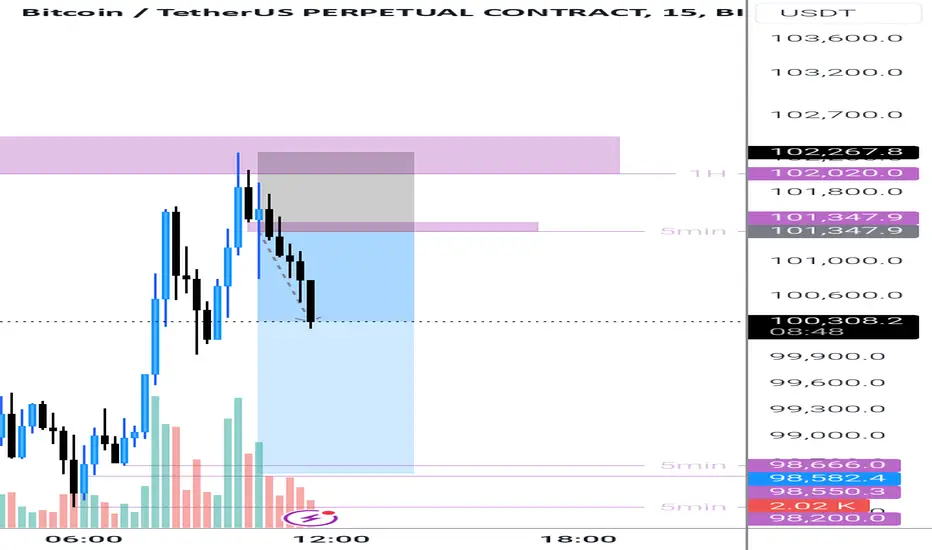
BTC SHORT 5 Min tIME FRAMEPlanning Btc Short on 5 min time frame
reason to take this trade is very simple - proper inducement and healthy pull back to FVG with aligned IFVG , with 1:2 RR this is my first trade of the day.
BTCUSDT trade ideas

Bitcoin sell on rise near 101k to 102k Target 91500,89000How to take trades using Harmonic pattern projection Trade setup is explained below :-
1st D point : 0% is recent top or bottom.
2nd D Point : 13.5% is work as trailing SL of buy or sell trade if hit then we have to book profit
.If price goes below 13.5% then early or risky traders can reversal trade ,
Safe traders can wait for 27% levels break
Targets :
Target T1 is 27.3% if you are taken entry from 13.5% if taken entry from 27.3 then Target T1: 38.2 % level is our 1st Target
( 38.2% if also a reversal zone so if price reverse then we can make fresh entry also).
T2: 50% level is our 2nd Target
T3: 61.8% to 65 % is our 3rd Target
( This is also reversal zone so we have to book profit at this area and if break then take fresh entry with SL of 2nd Target 50% .)
Next Targets are 78.6 % , 88.9 % 100% , 113.5 % , 127.2% , 141.5% and 161.8% to 165%.
161.8 to 165% if profit booking area so book full profit and wait for reversal.
How to take reversal trade :
If price going upside/ downside then then buy or sell levels appear on Chart ( Automatically show when price reach any reversal zone of harmonic projection pattern based .
After showing reversal levels wait for confirmation until 13.5 % or 27 .6 % level not break if break then exit from current buy / sell trade and take fresh reverse trade buy/ sell .
Trailing SL:
After reach 1st Target trail SL to just above or below cost ( for example we are holding sell trade from 100 1st Target 110 hit then move trailing sl to 104-105 and move SL as price move upside or Downside)
Blue Line is 1st support/ Resistance
Green line is 2nd support/ resistance
Red line is 3rd Support/ resistance

Bitcoin in range buy on dip and sell on rise both working Last week premium members booked huge profit
Gold 2150 points profit
Silver 2500 points profit
Copper 28 points profit
Natural gas 12 points.
Zinc 2 points.
Crude 150 points
How to take trades using Harmonic pattern projection Trade setup is explained below :-
1st D point : 0% is recent top or bottom.
2nd D Point : 13.5% is work as trailing SL of buy or sell trade if hit then we have to book profit
.If price goes below 13.5% then early or risky traders can reversal trade ,
Safe traders can wait for 27% levels break
Targets :
Target T1 is 27.3% if you are taken entry from 13.5% if taken entry from 27.3 then Target T1: 38.2 % level is our 1st Target
( 38.2% if also a reversal zone so if price reverse then we can make fresh entry also).
T2: 50% level is our 2nd Target
T3: 61.8% to 65 % is our 3rd Target
( This is also reversal zone so we have to book profit at this area and if break then take fresh entry with SL of 2nd Target 50% .)
Next Targets are 78.6 % , 88.9 % 100% , 113.5 % , 127.2% , 141.5% and 161.8% to 165%.
161.8 to 165% if profit booking area so book full profit and wait for reversal.
How to take reversal trade :
If price going upside/ downside then then buy or sell levels appear on Chart ( Automatically show when price reach any reversal zone of harmonic projection pattern based .
After showing reversal levels wait for confirmation until 13.5 % or 27 .6 % level not break if break then exit from current buy / sell trade and take fresh reverse trade buy/ sell .
Trailing SL:
After reach 1st Target trail SL to just above or below cost ( for example we are holding sell trade from 100 1st Target 110 hit then move trailing sl to 104-105 and move SL as price move upside or Downside)
Blue Line is 1st support/ Resistance
Green line is 2nd support/ resistance
Red line is 3rd Support/ resistance

BTC in clear down TrendBTC making lower highs and lower lows shows in clear down trend for last few days

Bitcoin (BTC): technical and fundamental analysis.📈 Technical analysis BTC/USDT
The price of Bitcoin dropped sharply following Donald Trump’s announcement of tariffs on imports from certain countries. The decline was halted by a major support block at the 91,000 level. Currently, BTC is holding below the 200 EMA line and is positioned at the point of control of the value area. If buyers fail to establish a new support level in the 95,000–97,000 zone, we expect further downside and a retest of the 90,000 level. Should Bitcoin consolidate below this level, a full correction to the 0.61 and 0.78 Fibonacci levels is likely. These levels coincide with the 4H and 1D Imbalance zones, where significant gaps in horizontal trading volumes need to be filled through consolidations.
For Bitcoin to resume its upward trend, it must reclaim the 200 EMA dynamic resistance and hold above the psychological level of 100,000. In this case, we would expect further growth, with a retest of the 108,000–110,000 resistance block and a potential new all-time high.
📉 Bitcoin market global analysis.
On the daily logarithmic chart, a reversal pattern—Double Top—is forming. However, it will only be confirmed upon breaking its support line at the 90,000 level and consolidating below it. A divergence on the RSI indicator also suggests a high probability of a continued correction. During Bitcoin’s rapid growth in November 2024, an Imbalance 1D zone formed in the 77,000–85,000 range, featuring significant gaps at horizontal trading volume levels that need to be filled through consolidations.
Once the correction is complete, Bitcoin’s next price target could be the global trendline, drawn based on the two peaks of the previous growth cycle. This trendline may be tested around the 120,000 level, as confirmed by the analysis of large order blocks in exchange order books.
💠 Analysis of liquidity zones and levels
The Fear and Greed Index is in the neutral zone at 49.
The total cryptocurrency market capitalization has fallen to $3.08 billion, while the Bitcoin Dominance Index has risen to 61.82.
According to the analysis of the accumulation of large order blocks in the exchange order books, the supply and demand zones are located at the following levels:
🟢 Demand zone: 85,000 - 90,000
🔴 Supply zone: 100,000 - 120,000
Levels for long positions:
90,000 - 92,000 - large support block
87,000 - 88,000 - large support block
80,000 - large support block
77,000 - large support block
Levels for short positions:
105,000 - large resistance block
110,000 - largest resistance block
120,000 - ascending resistance trend line
📊 Fundamental analysis
After Donald Trump announced tariffs on imports from Mexico, Canada, and China, the crypto market experienced a sharp crash. Bitcoin's (BTC) price dropped to levels near $90,000, leading to the largest liquidations in history, totaling $2.2 billion. On the same day, news emerged that the leaders of Canada and Mexico had reached an agreement with the U.S. president to delay the implementation of the tariffs. This contributed to a partial recovery in cryptocurrencies, but the market has yet to stabilize. The number of large investors (holding more than 1,000 BTC) has not fully recovered, and large-scale accumulation has not resumed completely. It may take up to two months for the market to recover.
However, Trump’s recent executive order to establish a national Bitcoin reserve could alter Bitcoin’s market cycle. The current Bitcoin cycle is more stable than previous ones, with realized losses remaining relatively small during pullbacks. This can be attributed to a more informed investor base and the growing role of institutional players in BTC. Net capital inflows into BTC have already exceeded $850 billion, while the average daily trading volume is around $9 billion. The market capitalization of the leading cryptocurrency is currently estimated at $2 trillion, making it the seventh-largest asset in the world—surpassing silver and companies like Saudi Aramco and Meta.
Bitcoin’s future growth depends on the Federal Reserve’s monetary policy and U.S. regulatory actions. If the government adopts a crypto-friendly stance, the price could rise. Otherwise, resistance from regulators could trigger a correction.
🌐 Upcoming Events in the Global Economy
We expect increased volatility in both stock and cryptocurrency markets on the following dates:
➤ 07.02, 16:30 - U.S. Unemployment Rate (Jan)
➤ 12.02, 16:30 - U.S. Core Consumer Price Index (CPI).
➤ 27.02, 16:30 - U.S. GDP (QoQ) (Q4).
➤ 19.03, 22:00 - New Fed Interest Rate Decision.
🚀 Statistics of signals from our AI trading indicator:
📈 In January 2025, the Bitcoin price again updated its historical maximum, then a correction began. Our trading indicator gave 6 signals with the most profitable entry points and minimal risk. Thanks to the latest updates, all signals became profitable, and the built-in protection against flat prevented losses from manipulative market movements.
- Total price movement for all signals for the month: + 38.21%
- Maximum price movement for one signal: + 13.31%
- Average price movement for signals: + 6.36%
In addition, I would like to share the forecast of the latest Bitcoin price action by our AI, which not only indicates the direction, but also builds the trajectory of further price movement:


BTC/USD LONGWe are trying to follow the 4hour order flow, waiting for the EQLs to be sweept and if there is a comfirmation we take a buy.

BTC#12: Gathering signs from the price line
💎 💎 💎 Is plan #11 helping you make a profit?💎 💎 💎
🔥 As we analyzed the possibilities of BINANCE:BTCUSDT in the previous article, BTC temporarily entered the SW process. And here is the next plan for BINANCE:BTCUSD 🔥
1️⃣ **Fundamental analysis:**
📊 The Trump administration has taken the first step in loosening cryptocurrency regulations. The US SEC plans to reduce the cryptocurrency enforcement team
"eliminate excessive regulations" on digital assets.
🚀US senators from the state of Ohio have proposed a bill to establish a Bitcoin reserve fund and accept it as a form of payment.
📌The US sovereign wealth fund plan is expected to be implemented within 90 days
2️⃣ **Technical analysis:**
🔹 **D frame**: Looking at D frame, we can see that the downtrend is not over yet. If today's price surpasses yesterday's candle wick, we will see a more optimistic market situation.
🔹 **H4 frame**: The bearish price structure is not over yet. Currently, if the support zone of 96~97K is still waiting for evaluation
🔹 **H1 frame**: You can see that the price is close to the trendline. However, we are in a bearish price structure -> Don't rush to decide on this area.
3️⃣ **Trading plan:**
⛔As you can see on the chart, the downtrend has not been broken yet. We still need to wait for confirmation of the 96~97K area by the price structure. Be patient to wait for a better buying position and less risk
✅ Currently, finding a SELL position is in accordance with the price structure, but this price zone is not suitable for establishing a position. You can wait for the price to touch the larger trendline zone and consider the price reaction in that area to establish a position
💪 **Wish you successful trading!**

BTC#11: Will BTC rise or fall?. Market structure perspective
💎 💎 💎 Did you make a profit in post #10? Please share and comment your thoughts 💎 💎 💎
🔥After the Monday morning dump, we witnessed an amazing recovery of BINANCE:BTCUSD . Market sentiment has improved significantly. We continue to plan for BINANCE:BTCUSDT as follows:🔥
1️⃣ **Fundamental analysis:**
📊Data: Stablecoin on-chain trading volume decreased by 10.5% in January and legal CEX spot trading volume decreased by 18.2%
🔴According to Bybit CEO Ben Zhou, the total value of actual crypto liquidations is higher than $2 billion, he estimates this figure at around $8-10 billion.
🚀Donald Trump signed an executive order to establish a US national investment fund.
📌 In general, market liquidity is falling sharply, the loss after the recent correction has brought a cautious mentality to the majority of investors in the cryptocurrency market.
2️⃣ **Technical analysis:**
🔹 **D Frame**: Yesterday's D candle marked the amazing recovery of BTC. Currently, the price structure of frame D is still maintained as an increasing price structure.
🔹 **H4 Frame**: Gives us a different perspective. Although BTC has recovered, the price structure of frame H4 has not been broken. We will have to wait a while before seeing a more positive signal
🔹 **H1 Frame**: As you can see, BTC is still running in the downtrend channel. The KEY 977xx zone will play an important role in predicting the next direction
3️⃣ **Trading plan:**
⛔At the present time. Although the D candle is a positive sign, in the smaller time frame we still do not have a price structure confirming the recovery of the main trend. Whether placing a BUY or SELL order in this area is very dangerous because there is no confirmed price structure. You should wait to get the best trading position
✅ Based on my personal experience, I will wait for the price reaction in this 97K area. If a supportive price structure appears, we can have a good position following the main trend in the D frame.
💪 **Wish you successful trading!**
📌 For any questions, please contact us directly. I am ready to answer you for free

Bearish February ?The trendline intersacttion shows next bounce on the daily which will break the downward trandline on 4H.
Liquidations over 1B around 109K let's think to a recovery before the next beaarish phase.
A pullback to the psychological levl of 100K is imminent. The bounce of the lower band this range can change the bullish trend and push the price to the last short-term target area.
There's a possibility of stronger drawdown once there. The price may return to the range kept from December, with millions ready to be liquidated and new orders at 96K.
A breakout of the 96K level can be positive for the seller since it will indicate a recover of inefficiency areas at 92K and 86K.
The long term analysis keeps a bullish trend, with monthly target over 120K. I expect a great 2025 in the whole crypto world.
The next week bearish phase will attract more investor and so, liquidity and inflate the price for this upward phase.

Bitcoin entering Support Zone - Time to Buywe need to thank all the news caused crypto to give a correction. In chart BTC is entering Support Zone. I do not buy any negative news now like tax war or new BRICS currency which are not a good reason which will stop big players from buying BTC at support levels. BTC is the biggest crypto in this world and irrespective of US new reserve comes or not. Trump is words first Crypto Leader now and in 2025 all crypto going to see new high levels due to wide acceptance of various countries and US state government start dealing in crypto which we never seen in any country history.

BTC/USDT 4H Analysis: Bearish Breakdown or Rebound?📉 Bitcoin (BTC/USDT) 4H Chart Analysis
🔴 Overview:
Bitcoin is trading at $101,847 (-0.22%) on the 4-hour timeframe.
The price is moving within a descending wedge/pennant pattern.
Key EMA (200): Currently at $100,781, acting as dynamic support.
📌 Key Levels & Analysis:
Resistance Zone (~$102,000 - $103,000): Price is struggling to break above this level.
Support Zone (~$97,500 - $98,500): A key demand zone where buyers may step in.
⚠️ Potential Scenarios:
Bearish Breakdown ⬇️
If BTC loses the $100,800 EMA support, a drop towards $98,000-$97,500 is likely.
The marked arrow suggests this bearish move.
Bullish Rebound ⬆️
If BTC holds above EMA 200 and reclaims $102,000, a breakout towards $104,000-$106,000 could follow.
🧐 Final Thoughts:
Short-term trend: Bearish bias unless price reclaims resistance.
Watch for a break below $100,800 for further downside.
RSI & Volume Confirmation Needed for stronger signals.

BTC#9: BTC is likely to have a correction and here's why
💎 💎 💎 Did you make a profit in the previous post #8? Like and follow the channel to follow the earliest trading plan. 💎 💎 💎
🔥 Let's plan for the next BINANCE:BTCUSDT BINANCE:BTCUSD 🔥
1️⃣ **Fundamental analysis:**
📊US consumer price inflation accelerated late last year, supporting the Fed's decision to pause interest rate cuts
🔴 Trump announces 25% tariffs on Canada and Mexico, "Trade war" begins again
🔴Trump threatens that tariffs will take effect on February 1! Influenced by Trump's tariff policy, the market's risk-off sentiment has increased significantly.
🚀 15 US states are pushing for strategic Bitcoin reserves, with Arizona and Utah temporarily leading
📌 In the past hours, the entire network has liquidated $204 million, mostly buy orders
2️⃣ **Technical analysis:**
🔹 **D Frame**: Although the price structure is still increasing, the reaction of the resistance area shows that we will have a correction.
🔹 **H4 Frame**: So the resistance area has been confirmed. The price continues to SW this area without a breakthrough, we will have an official correction. The price will find the support area below
🔹 **H1 Frame**: As you can see, the current price structure is bearish. Currently, I do not see any signs of price reversal.
3️⃣ **Trading plan:**
⛔In the previous article, you can see that this scenario was predicted. The current price reaction is very weak for the BUY side. We will have to wait at the support zone below.
✅If anyone has a good position at the resistance zone of 104k~105K, there is a basis to wait for a better profit. If anyone does not have a position, they can wait for the price structure if there is a slight recovery to the resistance zone above. Both the fundamental information and the price line support the option that there will be a deeper correction for BTC
💪 **Wish you successful trading!**
📌 For any questions, please contact directly. I am ready to answer you for free

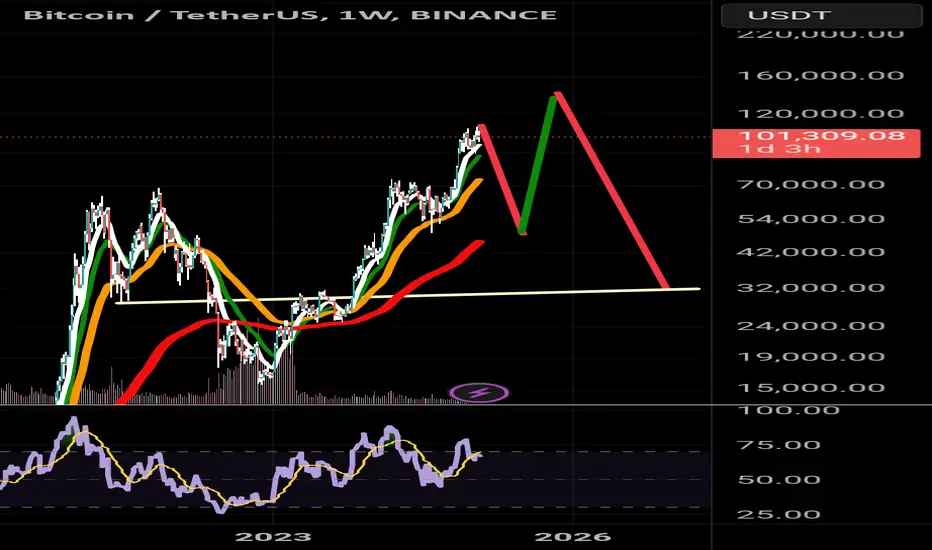
BTC W and D1 are still in a downward correction phase (82k)BTC W and D1 are still in a downward correction phase before starting a new W cycle.
Bitcoin is experiencing short-term upward movements on D1 and H4, followed by a gradual move toward the $77,000–$82,000 range within the next 1–2 weeks. This correction is essential for shifting from USDT to accumulating BTC and Altcoins.
If you believe Bitcoin will continue its upward move directly from the $97,000 mark, it might indicate a strategic misunderstanding.
Current Strategy:
1. Wait for the next correction phase:
Allow BTC to consolidate, and then start buying again as it begins its new W cycle. (Projected entry: around 4–5 weeks from now).
2. Focus on Altcoins with strong upward structures on W and M:
Buy Altcoins that are in strong uptrends, capitalize on short-term gains during this phase, and exit after the W correction completes to accumulate again.
3. Short-term trades on H4 and D1:
Target quick rotations in Altcoins to maximize fast, short-term profits while waiting for broader market alignment.
Adapting these strategies will help align with the market’s current behavior and ensure optimal returns.

Is BTC not able to break new ATH and No Alt Season SADIf BTC not able to break New ATH with good volume and No Alt Season. Then this Scenario will be happen. I hope I am wrong. This Bull season has too pain
Bitcoin (BTC/USDT) Symmetrical Triangle Analysis: Next Move?Bitcoin (BTC/USDT) 4H Chart Analysis
Key Observations:
1. Symmetrical Triangle Pattern:
The chart shows a symmetrical triangle formation, characterized by converging trendlines.
This pattern typically signals a breakout, but the direction (up or down) depends on market momentum.
2. Current Price Action:
BTC is trading around $102,979.98 at the time of the chart.
It is above the 200 EMA ($100,003.64), indicating bullish strength.
The price recently bounced off support and is moving towards resistance.
3. Support and Resistance Levels:
Support: Around $97,785.55 (blue line).
Resistance: Around $109,636.60 (blue line).
4. Potential Scenarios:
Bullish Breakout:
If BTC breaks above the upper trendline, it may rally towards $109,636.60 or higher.
A confirmed breakout could push BTC to $112,500+.
Bearish Breakdown:
If BTC rejects at resistance and breaks downward, it could retest the $100,000 level or lower.
A breakdown could target $97,785.55 or even $95,000.
Final Thoughts:
Watch for a breakout or breakdown from the triangle pattern.
Volume is crucial—a high-volume breakout confirms strength, while low volume can indicate a fakeout.
If BTC stays above $100,000 (200 EMA support), the bullish bias remains intact.

BTC#8: Read BTC price line and trading plan
💎 💎 💎 Did you make a profit in the previous post #7? Like and follow the channel to follow the earliest trading plan. 💎 💎 💎
🔥 Let's plan for the next BINANCE:BTCUSD BINANCE:BTCUSDT 🔥
1️⃣ **Fundamental analysis:**
📊The Federal Reserve keeps interest rates unchanged
🚀Today is the expiration date of BTC futures
📌 US Senator Cynthia Lummis: will hold a public hearing on strategic Bitcoin reserves. This is important information. If BTC is accepted as a reserve asset. The cash flow into BTC will be huge in the near future.
2️⃣ **Technical analysis:**
🔹 **Frame D**: Once again, the price reacted in the 106xxx area. This test gives a weaker price reaction than the previous one.
🔹 **H4 frame**: The price has not surpassed 107xxx so it is not certain that BTC will break the peak.
🔹 **H1 frame**: The short-term price structure is still increasing. It is highly likely that the price will find the support zone below.
3️⃣ **Trading plan:**
⛔The price line has not completely escaped the SW zone, so if you participate in trading in this area, you must stick to the price structure.
✅ In my personal opinion, BTC will likely have another correction before it can break through the old peak. For the time being, we will wait for the price reaction at important support zones.
💪 **Wish you successful trading!**
📌 For any questions, please contact us directly. I am ready to answer you for free

A wise person will stop CRYPTO Soon after the oath of the so good person Mr Trump...crypto has gone out of control. Stay away from CRYPTO. Not only every person,every institution but even every country. Stay away. It is a scam. Save ur money. Listen to me. These bastards playing unfairly will be taken down someday,but till then stay away and use ur money for u

BTC#7: Will the price continue to break the peak? Trading plan💎 💎 💎 Did you make a profit in the previous post #6? Leave a comment and tag your friends to share. 💎 💎 💎
🔥Let's plan for the next BTC 🔥
1️⃣ **Fundamental analysis:**
📊 The US CFTC Chairman has launched a series of public roundtables, including topics such as digital assets. This predicts unforeseen fluctuations in the future.
🚀The BTC futures contract expiration date is approaching, plus the market's increasing demand to buy more BTC since Trump took office is the main driving force for the current uptrend
📌 The market is currently very sensitive to information related to BTC and government policies.
2️⃣ **Technical analysis:**
🔹 **D frame**: Yesterday ended with a pinbar that brought excitement to the market sentiment
🔹 **H4 frame**: Keylever has been broken, showing signs of a correction, but we still need confirmation at the resistance area above
🔹 **H1 frame**: The price has broken out of the triangle and is currently looking for important resistance zones. However, the current price structure is bullish.
3️⃣ **Trading plan:**
⛔As you can see, the main trend is important, even though the price has decreased, it still recovers quickly. At this time, absolutely do not FOMO when the price breaks the top and bottom because the price line needs confirmation. Wrong orders not only erode capital but also distort trading psychology, leading to wrong judgments
✅ In my personal opinion, the structural breakdown in the H4 frame shows signs that the market is likely to have a correction. In addition, because the price line has been increasing for a long time, adjustments to gain momentum to move to a higher price range are common
💪 **Wish you successful trading!**
📌 For any questions, please contact us directly. I am ready to answer you for free
👉 Follow to be updated with the earliest plans.

DeepSeek DUMP on BTC. A VIEW FROM THE PERSPECTIVE OF VOLUMEBINANCE:BTCUSDT
1. At point 1 on the price chart, we see a shooting star pattern during the formation of a range - a bearish signal
2. At point 2, we see the same pattern, which means a full-fledged bearish engulfment by sellers - a confirmation of the upcoming price drop.
3. At point 3, we can see the buyer's reaction, which causes the price to rebound from 97.778 to 102.112.
In terms of volume, there was a non-equivalent amount of sellers' volume - a bullish divergence.
EXPECTATIONS :
Scenario 1 (priority) - price rise from 99,000 to 102,000 with a range tightening and then a move to the upside
Scenario 2 - in the event of unfavourable news, 92,660 could be tested and a range formation possible

Bitcoin will fall back to $83,000 soon!Bitcoin has brocken out from the symmetrical triangle and took retest successfully and now moving down slowly. Hopefully we can see more dump on bitcoin and other alt coins soon 😊

BTC @ 99+ K Buying is visibleconsidering the last low and high then now price around 99+ K is between FIB buying levels of 50 and 61.8 levels where price seems to be holding for now which indicating some buying has been done. If price rise from here then it becomes wave 3 and price could easily move above 108K and making new ATH. one may consult your adviser or take your own decision for buying long positions in BTC at and below 99K. Below 100K is sure buying and no panic to sell considering all US and EU activities going on around crypto and BTC.