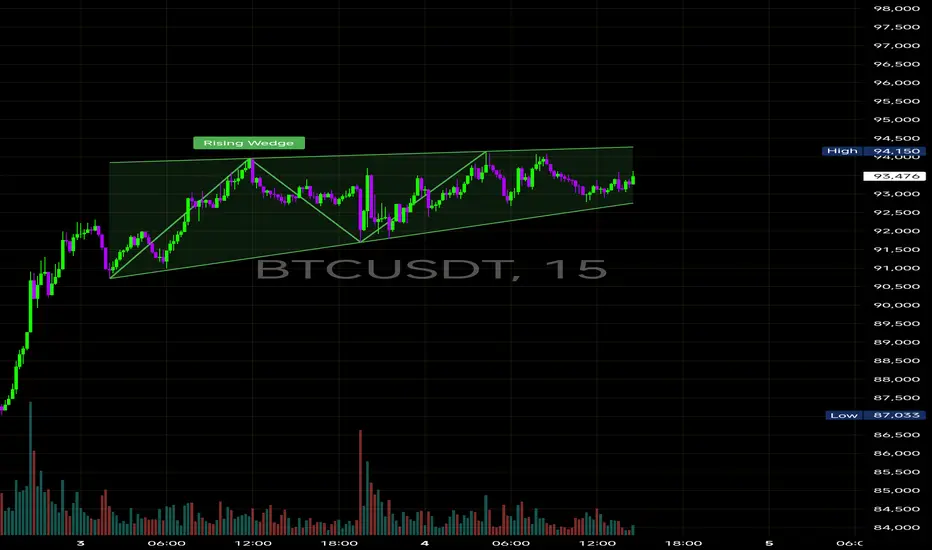
$BTC — Rising Wedge Forming on 15mins Chart#BITCOIN is moving inside a clear rising wedge, a pattern that typically signals buyer exhaustion on lower timeframes.
Price is making higher highs, but the momentum is slowing.
A clean break below the wedge support opens downside targets toward: 92,200 → 91,400 → 90,800
IF #BTC breaks above 94,150 with strong volume.
That would invalidate the wedge and push momentum toward:
95,200 → 96,000 → 98,000
Trade ideas
BTC AND ETH. WHAT TO DO NOW?Let's figure it out, overall the market looks long right now, as I wrote here, the highs have been updated, I expect trading on SETH and CRYPTOCAP:BTC (sideways), the main thing is to maintain the current values for confirming longs.
Invalidation of setups:
1) SETH fixed below 2.950
2) CRYPTOCAP:BTC consolidated below 89,000
However, it is worth considering the grandfather’s departure from the FED post and what will happen on December 10.

Part 2 Trading Master ClassHow Option Sellers Earn Profit
Option sellers (writers) make money very differently from buyers.
Sellers earn through:
Premium collection
Time decay (Theta) working in their favor
Market staying within a defined range
Selling gives higher probability of profit but unlimited risk if the market moves aggressively.
Example:
You sell Bank Nifty 49,000 CE at ₹220
Market stays sideways or falls
Premium collapses to ₹30
Your Profit = (220 – 30) × Lot Size
This profit results from the sold option expiring worthless.

Part 1 Trading Master ClassHow Put Options Generate Profit
A Put Option gives you the right to sell an asset at a fixed strike price.
You profit from a put when:
Underlying price moves below strike
Premium increases because market falls
Example:
Nifty at 22,000
You buy Put 22,000 PE for ₹100
Market falls to 21,700
Premium rises to ₹210
Your Profit = (210 – 100) × Lot Size
Put buyers make money when markets fall, similar to short selling but with limited risk.

$BTC 4Hr Chart Outlook On the 4Hr chart, #BTC is still moving inside a clean bearish flag, and price is now pressing into the upper trendline — a zone where rallies typically slow down. This makes it a spot where long positions should stay alert, because rejection here can send price right back toward the lower boundary of the channel.
Yesterday’s strong push likely came after the Vanguard-related excitement, injecting momentum right when price tapped the lower trendline. That liquidity sweep gave bulls enough fuel to drive #Bitcoin toward 93,000, where we sit now.
From here, two scenarios matter:
• If price breaks and holds above the upper trendline, the bearish flag loses strength and a broader shift toward bullish continuation opens up.
• If price gets rejected, expect a rotation back to the lower trendline, and alts would cool off quickly.
Maintain a cautious stance — good trades come from patience, not chasing.

AI Predicts Market Moves1. Why AI Is Ideal for Market Prediction
Financial markets are driven by:
Millions of daily transactions
Global macroeconomic events
News sentiment
Social media trends
Investor psychology
Seasonality and liquidity changes
Traditional statistical models struggle with non-linear and high-frequency patterns, but AI excels here. AI can detect:
Hidden correlations
Rapid trend reversals
Micro-patterns in high-frequency price action
Behavioral biases reflected in order flows
Because AI systems continuously learn and adapt, they perform well in dynamic environments where patterns evolve rapidly.
2. Types of AI Models Used for Predicting Market Moves
a) Machine Learning Models
Machine learning (ML) is widely used in quantitative trading.
1. Linear and logistic regression models
Used for probability-based predictions such as:
Will price go up/down next day?
Will volatility rise?
Is a breakout likely?
2. Random Forest and Gradient Boosting Models
These ensemble models help in:
Multi-factor trend prediction
Classifying bullish/bearish phases
Predicting price momentum
They combine multiple decision trees, improving accuracy and reducing noise.
b) Deep Learning Models
Deep learning can detect highly complex patterns.
1. LSTM (Long Short-Term Memory) Networks
Ideal for sequential data such as:
Price history
Volume patterns
Volatility cycles
LSTM models capture long-term dependencies—useful for swing or positional trading prediction.
2. CNN (Convolutional Neural Networks)
Surprisingly effective in market prediction because they treat charts like images.
Applications:
Pattern recognition (head-and-shoulders, flags, ranges)
Candlestick image classification
3. Transformer Models
Transformers—same architecture behind ChatGPT—are now used for:
Sentiment analysis
News interpretation
Multi-input data prediction
They can handle huge datasets and understand context more effectively than older models.
c) Reinforcement Learning (RL)
Reinforcement learning models learn by:
Trying different strategies
Receiving reward/punishment
Optimizing decision sequences
RL is used for:
High-frequency trading
Algorithmic trade execution
Portfolio balancing
Market making strategies
Firms like DeepMind, JPMorgan, Citadel, and Goldman Sachs use RL at scale.
3. Data Used by AI to Predict Markets
AI needs massive, multi-dimensional datasets. Common inputs include:
a) Price & Technical Data
OHLC (Open, High, Low, Close)
Volume
Moving averages
RSI, MACD, Bollinger Bands
Momentum indicators
Order book depth
VWAP and liquidity metrics
b) Fundamental Data
Earnings
Valuations (PE, PB, PEG ratios)
Revenue growth
Debt levels
Management commentary
c) Macro Data
GDP, inflation, interest rates
Commodity prices
Currency fluctuations
Geopolitical events
d) Sentiment Data
AI analyzes sentiment using:
News headlines
Social media posts
Analyst reports
Global event interpretations
Natural language processing (NLP) models convert text into sentiment scores.
e) Alternative Data
Modern AI uses unconventional datasets:
Satellite imagery
Foot traffic data
E-commerce checkout volume
Weather patterns
Shipping/tracking data
These unique insights give hedge funds a competitive advantage.
4. How AI Actually Predicts Market Moves
Step 1: Feature Extraction
AI transforms raw data (price, news, sentiment) into meaningful signals.
Step 2: Pattern Detection
AI searches for repetitive patterns such as:
Trend continuation setups
Volume–price divergence
Mean-reversion behavior
Market reaction to news events
Step 3: Probability Prediction
Instead of “predicting exact price,” AI predicts probabilities:
70% chance price goes up next hour
60% probability of volatility expansion
High likelihood of trend reversal
Step 4: Decision-Making
For prediction-based trading:
Buy signals
Sell signals
Risk management instructions
For automated trading:
Optimal entry/exit
Position sizing
Stop-loss levels
Execution speed adjustments
Step 5: Continuous Learning
AI models retrain themselves using new data, improving accuracy automatically.
5. Benefits of AI in Market Prediction
✔ Speed
AI analyzes millions of data points in milliseconds.
✔ Accuracy
Through learning from massive datasets, AI detects subtle trends humans miss.
✔ Emotion-Free Trading
AI eliminates biases such as fear, greed, overconfidence, or panic selling.
✔ Adaptability
AI quickly adapts to:
New market conditions
Volatility spikes
Regime shifts (bull to bear, consolidation to breakout)
✔ Scalability
AI models can trade multiple markets simultaneously:
Stocks
Commodities
Forex
Crypto
Indices
6. Limitations and Risks of AI Market Prediction
Despite its power, AI is not perfect.
a) Market Behavior Can Change Abruptly
Sudden events like:
War
Natural disasters
Flash crashes
Black swan events
…can disrupt any model.
b) Overfitting
AI sometimes memorizes data instead of learning patterns, leading to poor real-time performance.
c) Garbage In, Garbage Out
If input data is noisy, biased, or incomplete, predictions fail.
d) Lack of Explainability
Deep learning models often act as “black boxes”—hard to interpret decisions.
e) Competition
If many traders use similar AI models, predictive edge may disappear.
7. Real-World Use of AI in Markets
a) Hedge Funds
Top funds like Renaissance Technologies and Two Sigma use AI for:
Predicting price movements
Modeling volatility
High-frequency trades
b) Banks
Banks use AI to:
Optimize market-making
Manage trading risk
Detect anomalies
c) Retail Traders
Modern platforms provide:
AI scanners
Auto-chart patterns
Sentiment analyzers
Prediction dashboards
d) Exchanges
AI helps detect:
Unusual order flow
Spoofing or manipulative trades
Liquidity risks
8. The Future of AI in Market Prediction
Next-generation AI trading will include:
Fully autonomous trading bots
Agent-based market intelligence
AI models analyzing global macro in real time
AI risk engines predicting systemic failures
Predictive accuracy will rise as:
Data becomes richer
Computing becomes faster
Reinforcement learning evolves
AI will not perfectly predict markets, but it will continue to dramatically improve decision-making and risk management.
Conclusion
AI has become a powerful tool for predicting market moves by combining massive data, advanced models, and real-time learning capabilities. Although not perfect, AI enhances accuracy, reduces emotional biases, and identifies patterns humans cannot see. As technology continues to evolve, AI will only grow more central in shaping financial markets and trading systems worldwide.

Part 9 Trading Master ClassBull Call Spread – Best for Mild Uptrend with Low Risk
This is a defined-risk bullish strategy.
How it works
Buy a lower strike call.
Sell a higher strike call to reduce cost.
When to use
You expect a moderate rise, not a major rally.
Premiums are expensive and you want to reduce cost.
Risk and reward
Risk: Limited to net premium paid.
Reward: Limited (difference between strikes – cost).
Example
Buy Nifty 22,000 CE at ₹120
Sell Nifty 22,200 CE at ₹50
Net cost = ₹70
Max profit = ₹200 – 70 = ₹130

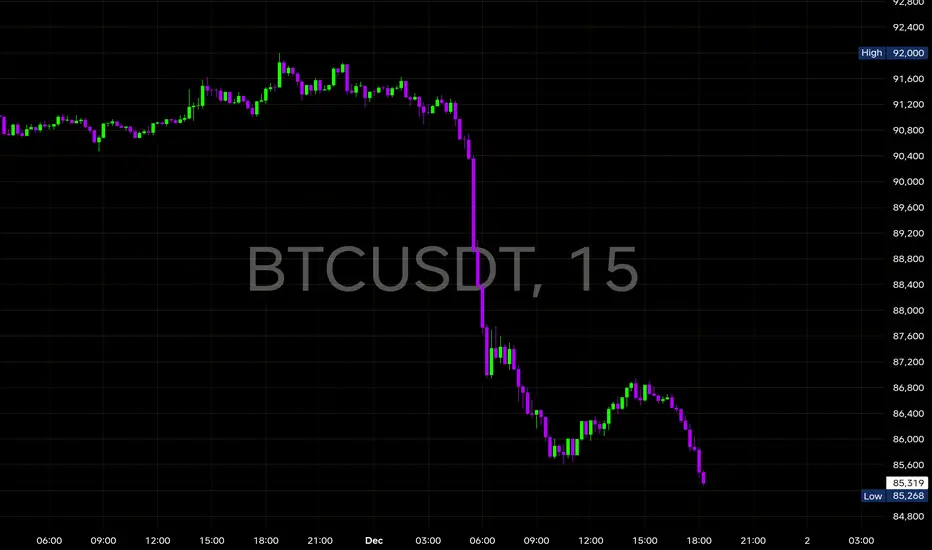
$BTC just printed a clean double-bottom structure on the 15mins CRYPTOCAP:BTC just printed a clean double-bottom structure on the 15mins chart at 85.6K, matching the first reaction low from earlier today. This is the first sign of intraday exhaustion after that heavy sell-off from 91.8K.
The pattern is forming inside a tight descending wedge, and price is now sitting right at the breakout zone. This is where #BTC usually makes its next decisive move.
Key Observations
🔹 Bottom 1 → 85.6K
🔹 Bottom 2 → 85.6K (perfect retest)
🔹 Lower-timeframe wedge compression completed
🔹 Buyers defended the same level twice — strength showing
If #BITCOIN holds this zone, we can see a momentum pop toward:
➡️ 86.7K
➡️ 87.3K
➡️ 88K (major intraday unlock)
But… A clean break below 85.5K invalidates the structure and opens the door toward:
⚠️ 84.2K → 83.0K
Right now, all eyes are on this double-bottom confirmation — momentum can flip quickly if buyers step in.
Bitcoin to slip more ...#BTCUSD at 91325
to continue Bear 🐨 trend🎢
Expected to hit:
TP 1: 91000
TP 2: 90900
TP 3: 90700
SL : 91525

PCR Trading Strategies Option Premium
The option premium is the cost of buying an option contract. It is influenced by several factors:
Underlying Price – higher underlying prices increase call premiums and decrease put premiums.
Strike Price – closer the strike price is to current market price, costlier the option.
Time to Expiry – more time means higher premium.
Volatility – higher volatility increases premium as uncertainty rises.
Interest Rates and Dividends – have minor impacts but still contribute.
These factors are modeled using the Black-Scholes model and other pricing techniques.

Option Chain Analysis1. Understanding the Structure of an Option Chain
An option chain typically has two halves:
Left side → Call Options (CE)
Right side → Put Options (PE)
Each row corresponds to a strike price, and each strike shows several key data points:
Common Columns in CE & PE:
OI (Open Interest) – Total active contracts that are not yet closed.
Change in OI – Shows whether new positions are being built (addition) or squared off (reduction).
Volume – Number of contracts traded during the day.
LTP (Last Traded Price) – Price of the option premium.
Bid/Ask Prices – Best current buy and sell prices.
Implied Volatility (IV) – Market expectation of volatility.
The strike price sits in the center of the table, dividing Call and Put data.
2. Why Option Chain Matters
Option chain analysis allows a trader to:
✓ Identify trend direction
Increasing call writing may suggest bearish sentiment, while heavy put writing may suggest bullish sentiment.
✓ Spot support and resistance
High Put OI indicates strong support.
High Call OI indicates strong resistance.
✓ Understand market liquidity
Higher OI and volume mean more active participation and better entry/exit execution.
✓ Track institutional activity
Big spikes in OI usually represent large participants (FII, proprietary desks).
✓ Predict short-term price movements
Based on the balance between CE and PE data.
3. Key Components of Option Chain Analysis
A. Open Interest (OI)
(Open Interest is the heart of option chain analysis.)
Rising OI + rising price → Long Build-Up
Rising OI + falling price → Short Build-Up
Falling OI + rising price → Short Covering
Falling OI + falling price → Long Unwinding
These combinations provide clues about ongoing market activity.
B. Change in Open Interest
This tells you what is happening today.
Example:
If Put OI is rising fast, traders expect the market to stay above that strike → support.
If Call OI is rising sharply, traders expect resistance at that strike.
C. Option Premium and LTP Movement
Premiums often rise due to:
Trend strength
Increased volatility (IV)
Time remaining to expiry
Premiums collapse due to:
Trend reversal
Drop in IV
Time decay (theta)
D. Implied Volatility (IV)
IV reflects expected movement.
High IV → high uncertainty → expensive options
Low IV → low uncertainty → cheaper options
IV also jumps ahead of major events such as RBI policy, budget, US Fed meetings, elections, etc.
4. Identifying Support & Resistance from Option Chain
This is one of the most practical uses of option chain.
A. Finding Support Levels
Support is identified by:
Highest Put OI
Sharp increase in Put OI
Put writers actively defending a strike
Put writers (sellers) are usually strong hands, so they provide floor/ support.
For example:
If 22,000 PE has the highest OI, then 22,000 becomes strong support.
B. Finding Resistance Levels
Resistance is identified by:
Highest Call OI
Big Call OI additions
CE writers defending a strike
If 22,300 CE has the highest OI, then 22,300 becomes strong resistance.
5. PCR (Put-Call Ratio) Analysis
PCR is a sentiment indicator extracted from the option chain:
PCR = Total Put OI / Total Call OI
Interpretation:
PCR > 1 → bullish sentiment (more puts written)
PCR < 1 → bearish sentiment (more calls written)
PCR around 0.8–1.2 → neutral market
PCR extremes:
Around 1.5–1.8 → overbought (possibility of downtrend soon)
Around 0.5 or lower → oversold (possibility of uptrend)
6. OI and Price Action Combination
Combining price action with OI gives the highest accuracy.
Bullish Signs
Increasing Put OI at lower strikes
Decreasing Call OI
Price closing above major CE writing zones
PCR rising
Bearish Signs
Increasing Call OI at higher strikes
Heavy CE writing above spot
Price closing below major PE supports
PCR declining
Sideways Signals
Both CE and PE addition at surrounding strikes
Narrow PCR near 1.0
Option premiums decaying fast
7. Option Chain Traps and Short Squeezes
Option chain also reveals squeeze situations:
Short Squeeze (Bullish Explosion)
Heavy Call OI begins to unwind
Price breaks above resistance
CE writers forced to exit → premiums rise sharply
Long Liquidation (Bearish Slide)
Heavy Put OI unwinds
Price breaks below support
PE premiums shoot up
These moves are usually fast and violent.
8. How to Use Option Chain for Intraday Trading
Intraday traders use:
A. Change in OI (minute-by-minute)
This reveals immediate momentum.
B. Straddle & Strangle Levels
High combined premium = expected movement range.
C. ATM (At-the-Money) Behavior
If ATM call OI rises → bearish
If ATM put OI rises → bullish
D. Premium Breakout Zones
Sharp change in CE or PE premium suggests a trending move starting.
9. Expiry Day Option Chain Analysis
Expiry days are different because:
Time decay is extreme
OI changes rapidly
Range-bound behavior is common
On expiry:
Highest CE + PE OI combination often predicts the max pain level (where sellers profit the most)
Prices tend to gravitate around this level
10. Max Pain Theory
Max Pain = Strike price where option buyers lose maximum money.
It is calculated from the option chain.
On expiry day, price often moves toward max pain.
11. Option Chain for Swing and Positional Trading
Positional traders use:
Total OI across all strikes
IV trends
Monthly expiry data
Support/resistance based on long-term OI
If Put OI is high for next month → bullish for swing trades.
If Call OI dominates → bearish.
12. Mistakes Traders Make in Option Chain Reading
Only checking OI without price action
Ignoring IV changes
Misinterpreting unwinding phases
Trading without considering broader market events
Following high OI blindly without confirming by price behavior
Option chain should be combined with technical analysis for best results.
13. Practical Example Summary (How a Trader Should Use the Chain)
Identify highest PE OI → support
Identify highest CE OI → resistance
Analyze Change in OI → fresh positions being created
Check PCR → market sentiment
Observe IV → volatility expectations
Track premium movement → strength of buyers or sellers
Combine with price action to confirm trend
Final Thoughts
Option Chain Analysis is a vital skill for traders in index and stock derivatives. It reveals the psychology of option writers, helps identify crucial levels, indicates short-term momentum, and offers insights into market direction. When used properly along with charting tools, it significantly enhances accuracy in intraday, swing, and expiry trading.
Part 4 Learn Institutional TradingParties Involved in an Options Contract
There are two sides to every options contract:
Option Buyer
Pays the premium.
Has limited risk (only the premium paid).
Has unlimited profit potential in call options and significant potential in puts.
Option Seller (Writer)
Receives the premium.
Has limited profit (only the premium collected).
Faces potentially unlimited risk in calls and large risk in puts.
Option sellers generally need higher margin because they take the greater risk.

Option Trading Advantages of Option Trading
✔ Low capital needed
✔ Limited risk (for buyers)
✔ High reward potential
✔ Many strategies
✔ Ability to trade volatility
✔ Perfect hedging tool
✔ Flexibility to create customised views

Part 10 Trade Like InstitutionsStrike Price, Premium, and Expiry
To understand any option, three elements are critical:
(A) Strike Price
The fixed price at which you can buy (call) or sell (put) the asset.
Example:
Nifty at 22,000
Call option strike: 22,200 CE
Put option strike: 21,800 PE
(B) Premium
The cost of buying the option.
Premium reflects what traders believe about future movement, volatility, and time value.
Higher volatility → higher premium.
(C) Expiry
Options have a limited lifespan. In India, index options expire weekly, and stock options expire monthly.
At expiry, out-of-money options lose all value.

FVG Retracement With EMA, RSI & Fib Confluence📈 Bitcoin Chart – FVG Retracement With EMA, RSI & Fib Confluence in a Bearish Market Structure
This chart showcases a sustained bearish sequence on BTC, defined by a clean continuation of Lower Highs (LH) and Lower Lows (LL). Throughout this decline, multiple Fair Value Gaps (FVGs) have formed both locally and at higher levels — each created by strong institutional sell-side displacement.
As price trends downward, these unmitigated FVGs above the market consistently act as magnet zones:price retraces into previous inefficiencies, rebalances them, and resumes the dominant bearish trend.
In the current setup, the integration of FVGs + Fibonacci Retracement(Point A to B) + EMA Levels + RSI Momentum provides a highly structured roadmap for anticipating retracements and continuation points.
The most significant imbalance sits near the major Fib retracement zone and under key EMAs — making it the highest-probability reaction area. Secondary FVGs below it may still induce a bounce, but carry lower structural relevance.
⸻⸻⸻⸻⸻⸻⸻⸻⸻⸻
📊 Key Observations
1️⃣ Prior FVG Mitigation
A previously formed FVG under the EMA was cleanly filled, followed by immediate downside continuation.
This confirms bearish order-flow control and validates the role of FVGs as efficient retracement targets in a downtrend.
2️⃣ High-Priority FVG (Primary Zone)
The upper FVG holds the strongest confluence:
Created by strong displacement
Sits below the EMA50
Aligns with the 38.2%–61.8% Fib retracement zone
This cluster makes it the most likely zone for a meaningful bearish rejection if price retraces into it.
3️⃣ Secondary FVG Reaction Zone
A lower FVG also exists beneath the main zone.
Although it can cause a minor corrective bounce, it formed during a smaller move and does not align with the key trend or Fib levels — giving it lower probability.
4️⃣ RSI Momentum Context
RSI remains below 50, confirming bearish momentum.
When RSI stays under mid-line, bearish FVG reactions tend to be more reliable and continuation setups form cleanly.
5️⃣ Structural Context
The broader structure remains decisively bearish as long as price trades below the EMAs and below the major upper FVG.
Retracements into these zones are more likely to serve as rebalancing moves rather than genuine reversal attempts.
⸻⸻⸻⸻⸻⸻⸻⸻⸻⸻
📊 Chart Explanation
Symbol → BTCUSDT
Timeframe → 1D
This visualization illustrates how Smart Money Concepts apply cleanly during strong trending conditions:
A clear LH–LL downtrend
Several historical FVGs acting as retracement magnets
A previously mitigated FVG confirming bearish control
A high-confluence FVG aligned with EMAs and Fib levels
A secondary imbalance that can still induce short-term reactions
RSI showing momentum remains bearish
Together, these elements outline a textbook sequence:
displacement → inefficiency → retracement → rebalancing → continuation.
Price remains under firm bearish control unless it breaks above the upper FVG with conviction.
⸻⸻⸻⸻⸻⸻⸻⸻⸻⸻
📘 Using Fib Retracement, EMA50, and RSI With FVGs (Bullish + Bearish)
🔹 1. Fibonacci Retracement + FVG
In a downtrend, draw Fib from swing high → low; in an uptrend, draw low → high
The 38.2%–61.8% zone is the prime retracement area in both directions.
If an FVG forms or sits inside this Fib zone, it becomes a high-probability reaction point (bearish rejection in downtrend, bullish bounce in uptrend).
🔹 2. EMA50 + FVG
In a bearish trend, price and FVGs forming below EMA50 act as stronger bearish retracement zones.
In a bullish trend, price and FVGs forming above EMA50 act as stronger bullish retracement zones.
EMA50 acts as a mean reversion point where price often returns to rebalance before continuation.
🔹 3. RSI + FVG
RSI below 50 → bearish momentum → bearish FVG reactions are more reliable.
RSI above 50 → bullish momentum → bullish FVG reactions are more reliable.
If RSI rises from oversold (or falls from overbought), it often signals a retracement phase toward nearby FVGs.
🔹 4. Combined Logic (Works for Bullish and Bearish)
Displacement creates an FVG (inefficiency).
Price retraces into the 38–61% Fib zone.
Retracement taps EMA50 or stays on the correct side of EMA50 (below for bearish, above for bullish).
RSI confirms momentum (below 50 for bearish continuation, above 50 for bullish continuation).
Price rejects from the FVG and continues the trend.
⸻⸻⸻⸻⸻⸻⸻⸻⸻⸻
✅ Summary
Market structure remains bearish with consistent LHs and LLs.
A previously filled FVG under the EMA validated the continuation move.
The upper FVG is the highest-strength level due to EMA + Fib + displacement confluence.
A lower FVG exists but carries reduced importance.
RSI below 50 reinforces bearish momentum and reliability of bearish FVG reactions.
⸻⸻⸻⸻⸻⸻⸻⸻⸻⸻
⚠️ Disclaimer
📘 For educational purposes only.
🙅 Not SEBI registered.
❌ Not investment advice.
🧠 Smart-Money-Concepts explanation only.

Part 3 Learn Institutional Trading Put Option Simplified
A put option is useful when you expect the market to go down.
When you buy a put, you are paying a premium for the right to sell.
If the underlying falls below your strike, your put gains value.
Example:
BANK NIFTY at 48,000. You buy a 48,000 PE.
If it falls to 47,500, your put becomes profitable.
Again, your maximum loss is limited to the premium.

Bitcoin Ready to hit New Low?BITCOIN QUICK UPDATE: LEVELS PLAYING OUT EXACTLY AS EXPECTED
As we mentioned earlier, the $88,600 FVG has now been fully filled, and CRYPTOCAP:BTC is currently trading below that zone.
Here’s what matters next:
🔹 If $85,000 holds as support → BTC likely pushes toward the next major Bearish Order Block at ~$93,000.
High probability this zone gets tapped.
🔹 If BTC fails to reclaim and break above $88,000 → expect a deeper leg down toward ~$75,000.
Stay sharp. NFA.

Bitcoin Monthly Support Test — Next Target $58,419 ?Key support sits at $81,933. A clean break and close below this zone could expose Bitcoin to a deeper retracement toward the next major support around $58,419.
However, $81,933 is also a strong monthly support level, so the market’s reaction here is critical.
Keep an eye on whether this level holds or fails — it will likely dictate the next major move.
Share your view in the comments: Do you think BTC will defend this monthly support, or are we heading lower?

BtcBtc i am going long here even higher than this swing high. Will look best place to sell on upper side

Part 12 Trading Master ClassOption Premium and Its Components
The premium is the price you pay to buy an option. Premium has two parts:
A. Intrinsic Value
The real value of the option.
Example:
If Nifty is at 22,000 and you have a Call option of 21,800
Intrinsic value = 22,000 – 21,800 = 200 points
B. Time Value
The extra value due to remaining time to expiry.
As expiry nears, time value decays, and premium falls. This is called Theta Decay.

Possible short in btc One retrasment is needed for upside
We are looking hear a short a scalp trade in btc

Why Candlestick Patterns Matter in Trading🔸 Types of Candlestick Patterns
Candlestick patterns can be broadly classified into:
A. Single-Candle Patterns
Hammer
Hanging Man
Inverted Hammer
Shooting Star
Doji
Spinning Top
Marubozu
B. Double-Candle Patterns
Bullish Engulfing
Bearish Engulfing
Piercing Pattern
Dark Cloud Cover
Tweezer Top
Tweezer Bottom
Harami
Harami Cross
C. Triple-Candle Patterns
Morning Star
Evening Star
Three White Soldiers
Three Black Crows
Three Inside Up
Three Inside Down

