bitcoin pattern,16.03.2023publishing herewith my idea about bitcoin using day time frame and yearly tf
BTCUST trade ideas


Time to go short on BTC ?With Bitcoin trading around a key resistance level and facing rejection from it on the daily timeframe, now might be a good time to consider shorting the popular cryptocurrency. While Bitcoin has experienced some significant price increases over the past year, there are indications that this momentum may be slowing down. With Bitcoin showing signs of lower excitement from investors, it may be wise to consider shorting it for the medium term.
One strategy for shorting Bitcoin would be to maintain a stop loss on the long side, which would help to limit potential losses in the event that Bitcoin rebounds and continues to climb. Additionally, it's important to carefully monitor the market and look for any potential signs of a trend reversal, as this could signal a shift in the direction of Bitcoin's price movement.
Furthermore, the recent rejection of Bitcoin from the key resistance level has resulted in the formation of a potential double top pattern on the daily timeframe. This pattern is often considered a bearish signal and could indicate that Bitcoin's upward momentum may be coming to an end. As a result, shorting Bitcoin at this time may offer an attractive opportunity for traders looking to capitalize on the potential price decrease.
It's worth noting, however, that shorting Bitcoin does come with inherent risks, as the cryptocurrency market can be notoriously volatile. As such, it's essential to carefully manage risk by maintaining strict stop losses and monitoring the market for any potential shifts in Bitcoin's price movement. By doing so, traders can position themselves to potentially profit from Bitcoin's current market conditions, while also minimising their exposure to potential losses.
Overall, while there is always a degree of risk involved in any investment strategy, shorting Bitcoin at this time could potentially provide a solid return for traders who are willing to take on the risk. By keeping a close eye on the market and staying vigilant in the face of any potential changes, investors can position themselves to take advantage of this exciting opportunity.

bitcoin running sideways in briefI hope all of you guys have made the profit through my long published idea of btc while it was accumulating around 20500$
it jumped around 6000$ from there almost
now talking about the current predicament of the market the mother bitcoin is consolidating if it stays around 23900 zone below this distribution will start
it is advisable for you to not to take any trade cause anytime it can move in any direction
institutions are fearless beware of any stupid analysis of people
take your time then dive into trades directly
it will be good for your PnL
follow for regular feeds
find me anywhere
i will provide you the best information and updates of the market
best of luck
stay tuned for further!
@Cryptoxcountry

Will Bitcoin reach $28K level in March?BTC has already gained more than 11% in the month of March. The question is will the rally continue and if we will see the price reaching $28K.
With the coming of CPI data, we saw BTC price reaching high of $26386 (at the time of writing).
Currently, the price is above 21-EMA and 50-EMA on a daily as well as 2- hourly timeframe.
The next target price is $28300 with stop loss at 21-EMA.
Please do not take overleverage trade in the current scenario.
Note: Studies are for educational purposes only.
We will not be responsible for any of your Profits & Losses.
Please trade with a proper risk management strategy to avoid huge capital loss.

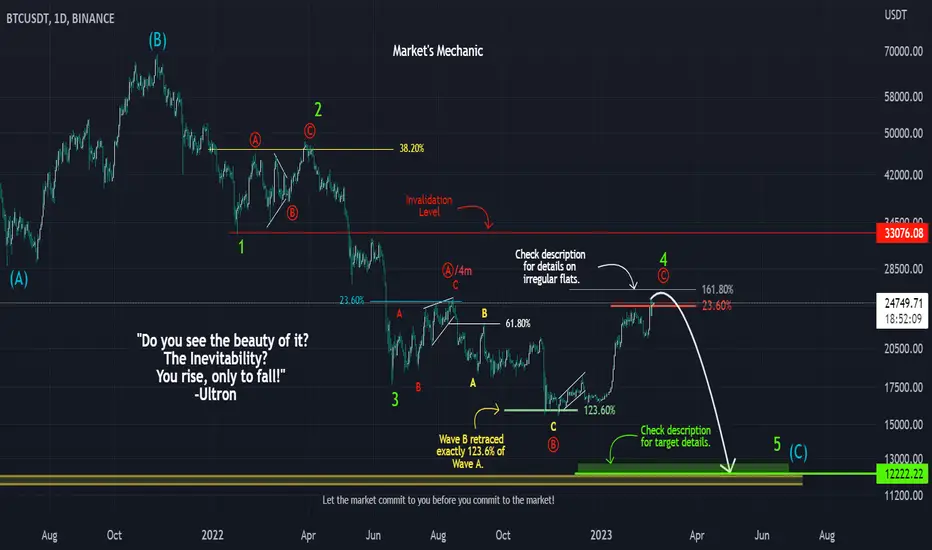
'You Rise, Only to Fall!' Elliotical Approach to BTCUSDT.Hello Traders!
"Do you see the beauty of it? The Inevitability? You rise, only to fall!"
As Ultron has pointed out, at times, markets rise, only to fall, what we traders call a 'retracement'. The bullish retracement of BTC is almost at its fag end.
1. We'll begin from the All-Time-High of about $69000. From there, we see the first 5-wave impulse down and then an ABC correction. That means, we have clear Waves 1 and 2.
2. Again, we see a 5-wave impulse in the form of Wave 3 and then again an ABC correction forming what we thought was Wave 4 (called Wave 4m from now on) .
3. There is a wonderful Rule of Alternation given in Elliot Wave theory. Wave 2 and Wave 4 will differ in at least one of the following ways if not all; PRICE, INTERNAL STRUCTURE, and/or TIME . There are a couple of other things as well but these 3 remain prominent.
4. Now, Wave 2 and Wave 4m took almost the same time and also had the same price value. Of course, the internal structures were different and that would have done it, but we didn't see the next 5-wave impulse down as the final fifth wave after 4 clear waves.
5. In such scenarios, we give the market time to unfold. Time is a very important key to market movement. We stay away until we understand what's really going on.
6. The market went further down and made a new low of around 15500 in 3 waves (marked with yellow ABC) . The move up breaking the high formed by 4m, confirmed that the correction was still going on. Wave 4m was just Wave A of actual Wave 4.
7. The 3 yellow ABC waves, were Wave B of Wave 4. They also happened to retrace exactly 123.6% of Wave A (4m) . This gave us the hint that an irregular flat correction was taking place.
8. What is an Irregular Flat Correction? The image has been attached. Please refer.
9. Wave C, ideally, should not cross 161.8% of Wave A. There can be a scenario of an extra elongation of Wave C but that is very very rare.
10. Coming to the Target Zone now. Wave 5 can be equal to Wave 1 through wave equality. That gives us a target of around 12222. We also have an important support for BTC at that price level. Once Wave 4 is finally complete, a parallel channel drawn through Waves 2, 3, and 4 should give us an approximate target of Wave 5.
11. The invalidation level for this analysis has been shown on the chart. Wave 4 should not enter the price territory of Wave 1. If it does, we'll have to re-analyze. Although, since it's a large C wave, the possibility of a diagonal exists (where Waves 1 and 4 can coincide), it doesn't seem to be in the picture yet.
12. It is expected that the market will break its current high on 25250 once before beginning the impulse down.
Do use proper risk management.
Happy Trading!
Profits,
Market's Mechanic.
BITCOIN ROCKING ‼️Bitcoin Price Enter Again In Rising Channel. So It Is A Good Move By BTC...It Seems Bullish Seems Bullish. Now BTC Will Try To Break Out The Channel. So Keep AN Eye On It.

IF BTC LOSE 20K in any situation then, March 2020 ?If BTC lose his 20k support then ready for huge dump, is BTC planning as March 2020 again, so be alert, above 20k is normal and claimable for 48k


Great Short Swing Opportunity of BTCBTC is rejecting from Important level with very good volume.
You can place your order at the current price up $24000 level.


Bitcoin and sudden breakout and curve patternpublishing here with my idea about bitcoin using 2 hr chart

btc trading around 20700$ here what is repeated againbtc trading same as 14th feb its time do not think once or without blinking your eyes here will be a bull run for altcoin as the sideways will start over again for short time of period advice tight stop loss and fill up your trading bags
convert an offer into an opportunity
#chartanalysis
#btc
#crypto
#tradingcops


BTCUSDT LongOn observing chart pattern, from 19500 level, step up pattern is found. It is bullish pattern. We should maintain our bullish view till BTC breaks 20200 level.
If, BTC crosses level of 20600, we will see a good bullish momentum.
It is basically chart pattern analysis without using any indicators.
It is only for the education purpose.

btcusdt shortbtcusdt has make doubel top ion 4h tf and 1hr time frame
it is consloding in chaanel in 15 mintue timeframe
and had make double top on 5 min timeframe
if 15min candel closes bwlow the red line we will get two entry opppurtunity got trade
slected your entry and hold it till target thank you


Bitcoin Massive UpmoveExpecting Bitcoin Massive Upmove from 20100 Levels to 21400/22200 Levels as per Chart pattern formed

Bitcoin Strong Bearish Reach 18000$Bitcoin makes proper Double Top Pattern formation and Last week's price break the 20400 Nike line
So, According to the Technical, it will go 18000$ in the upcoming week's

BTC LONG POSITION sustaining on strong support, about to break down trendline,
sl and target are given ,
HAPPY TRADING AND GOOD LUCK

BTC chartAs you can see, the mid-channel trendline acted as a support for BTC.
If it Breaks this line we may see BTC at 20000$.
Currently, BTC is making a bullish flag pattern but for that $BTC has to break out from the channel towards the 22500-22700 Level.
The Zone from where BTC went short.

Btc analysis bearish divergence on its daily TF with sup & resisIf we compare BTC's current ascending chart pattern to past patterns, we can see that for an upward trend, we would need a powerful rally to break the upper trend line. However, when we look at the RSI indicator, we see a bearish divergence, as the graph is going down while the price is going up.
Therefore, it is important to keep an eye on the RSI as well. If the breakout goes down, I have already marked some areas where you can enter the spot if you choose to do so. I am also attaching a chart to show the reason.
Bearish divergence
A bearish divergence occurs when prices continue to form higher highs (typical in a bull market) while your oscillator (in this case an RSI) is forming significantly lower highs (indicating weakness in the trend.)
Please let me know if you would like me to clarify anything further
