Dollar seems Bearish for Long termDollar index(DXY) seems to entering the bearish setup for an Target of 94.500.
As per wave analysis one can go for shorting the Dollar for the above target.
Trade ideas

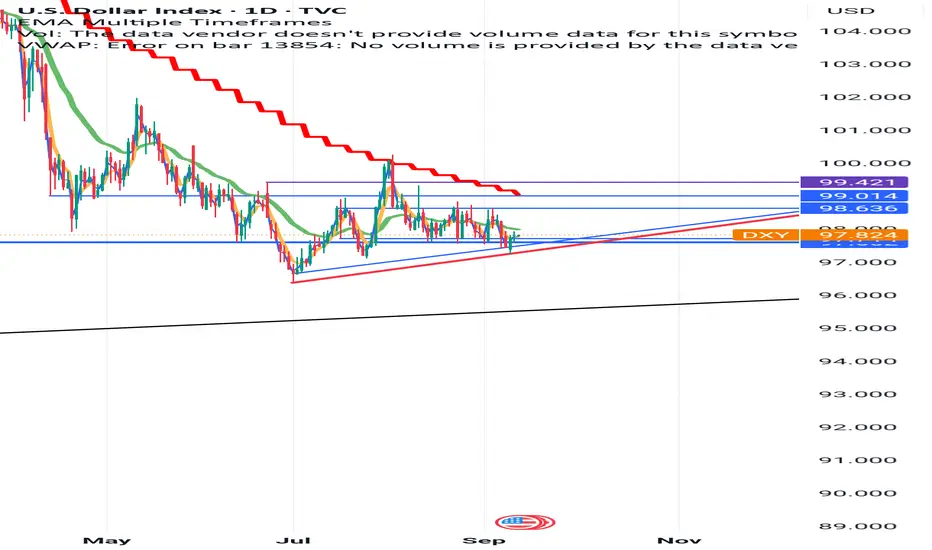
DXY MULTI TIMEFRAME ANALYSIS Hello traders , here is the full multi time frame analysis for this pair, let me know in the comment section below if you have any questions , the entry will be taken only if all rules of the strategies will be satisfied. wait for more price action to develop before taking any position. I suggest you keep this pair on your watchlist and see if the rules of your strategy are satisfied.

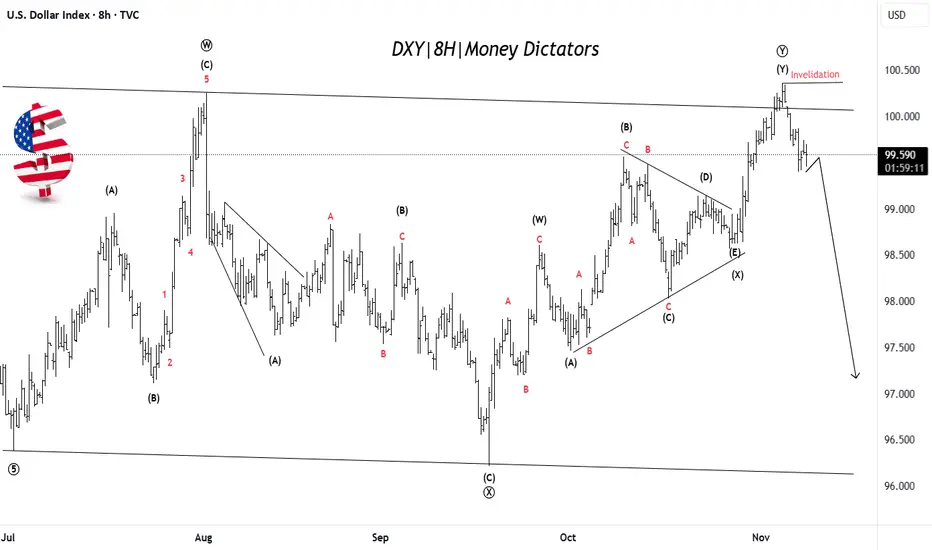
US Dollar Weakness Likely After Final Push UpDXY has completed a complex corrective W–X–Y pattern, with the final leg (Y) recently topping near the 100.50 zone. Price has failed to break above the invalidation level, suggesting the uptrend is losing strength. This signals that the dollar may have finished its corrective phase and could now start a fresh bearish wave targeting lower zones near 97–98. The overall structure indicates that momentum is shifting from bullish to bearish. In simple terms: rally is likely over → downside move toward new lows expected next.
Stay tuned!
@Money_Dictators
Thank you :)
DXY Weekly Outlook 10/11/2025 - 14/11/2025Wassup Lads!
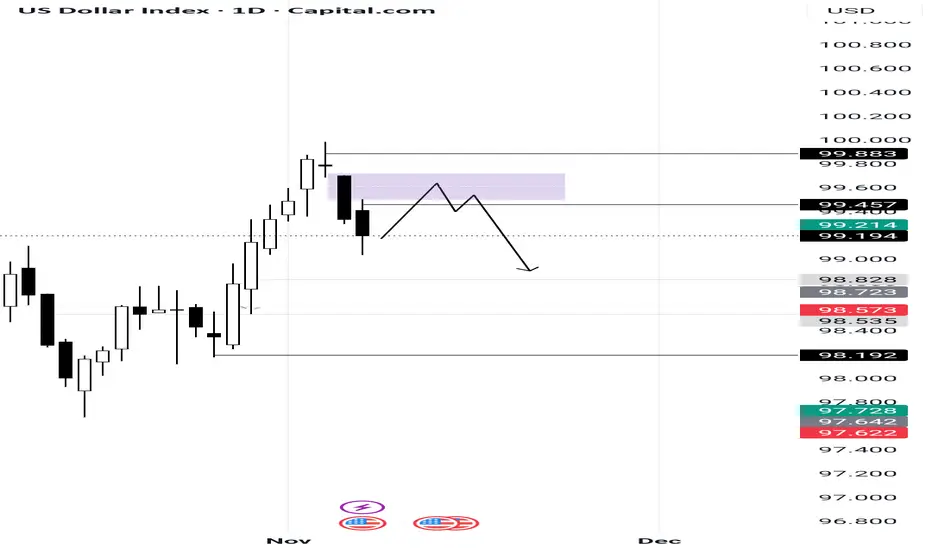
The dollar index has closed sharply into the weekly range and has formed a daily swing point and a strong rejection candle on the weekly time frame. I am expecting dollar to retrace to the bearish daily fair value gap and continue lower.
I recommend you to -
1. Maintain your risk
2. Stay disciplined
3. Do your own research
Let's win the week
DOLLAR INDEX MAY PUSH DOWN GOLDDollar Index looks strong
1 -- Strong on 1D and 12H.
2 -- A Big Rounding Bottom under manufacturing.
3 -- Buy on Dips type setup .
4 -- RSI and MACD also supportive .
If Dollar index rise then Gold may give corrective move. Gold also in consolidation after
correction. but gold can give further down move. So its good to keep eye on Dollar Index
for Shorts Seller and profit Booker in Gold.

technical analysis of the chart you shared (U.S. Dollar IndexCurrent Price: 100.112
Bias: Bullish short-term
Timeframe: 15-min
The chart shows a clear bullish structure with higher highs and higher lows forming. The price recently bounced from a minor support zone around the 100.00 level and is showing momentum to the upside.
📊 Key Levels
Support Level: 99.750 – 99.850 (major zone from previous lows)
Buy Zone: 100.000 – 100.050 (minor support/entry zone)
Target Point: 100.460
⚙️ Analysis Summary
Price has broken above short-term resistance and is now retesting the buy zone, suggesting a possible continuation higher.
The ascending trendline (dotted white line) supports this bullish bias.
The yellow zigzag projection indicates expected consolidation before a push upward.
🎯 Trading Plan (Based on Chart Setup)
Entry Zone: Around 100.000 – 100.050
Stop Loss: Below 99.900 (below structure support) EURONEXT:AEX TVC:AEX INDEX:AMX EURONEXT:A12LE EURONEXT:AAX EURONEXT:AAXG EURONEXT:AE10S EURONEXT:AE12S EURONEXT:AESGG EURONEXT:AESGN EURONEXT:AESGP EURONEXT:AEX4S EURONEXT:AEX6L EURONEXT:AMXGR EURONEXT:AEXGR TVC:AEX
Take Profit: 100.460 (target zone)
Risk/Reward Ratio: Approximately 1:3
🔍 Conclusion
The chart suggests a short-term bullish scenario for DXY (U.S. Dollar Index). A successful bounce from the 100.00 zone could lead to a move toward the 100.46 target point. However, a break below 99.90 would invalidate the setup and shift bias to neutral or bearish.

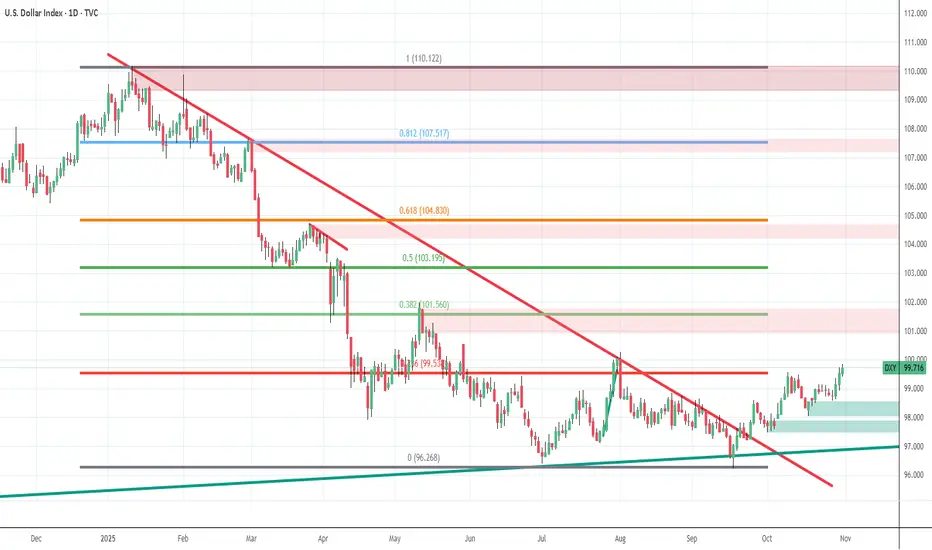
$ Index - view and analysis$ Indec has clearly taken monthly month trend line support and slowly moving up.
Its could be just technical move and i am not aware of any reason for US dollar and this index to move up. Only solution for US Govt to stop shut down is only lifting limit and print more fiat currency. After the news flow mostly it will coincide with fib level and US will announce printing of more fiat currency. I still think its long time bearish view only and short term could be bullish till it reaches the point to fall down again.

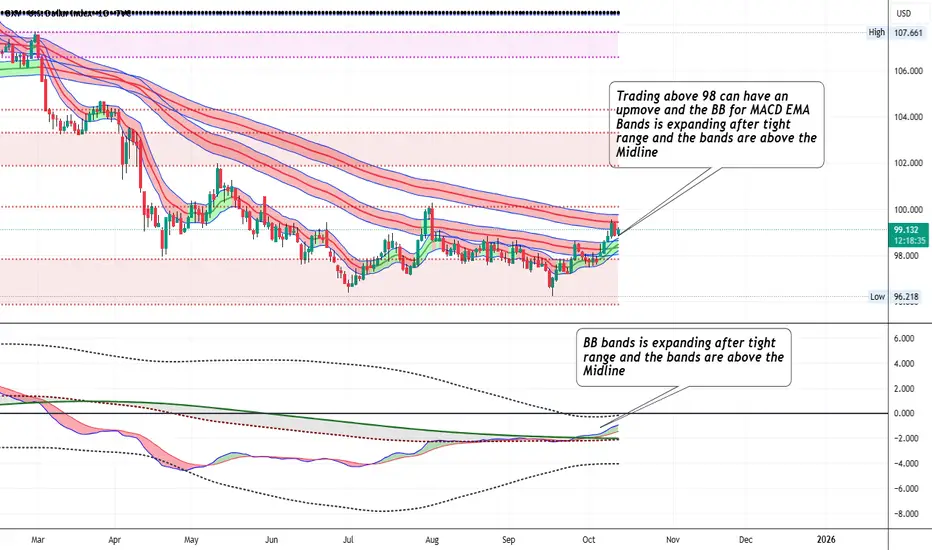
DXY - Trading above 98 can have an upmoveTrading above 98 can have an upmove and the BB for MACD EMA Bands is expanding after tight range and the bands are above the Midline
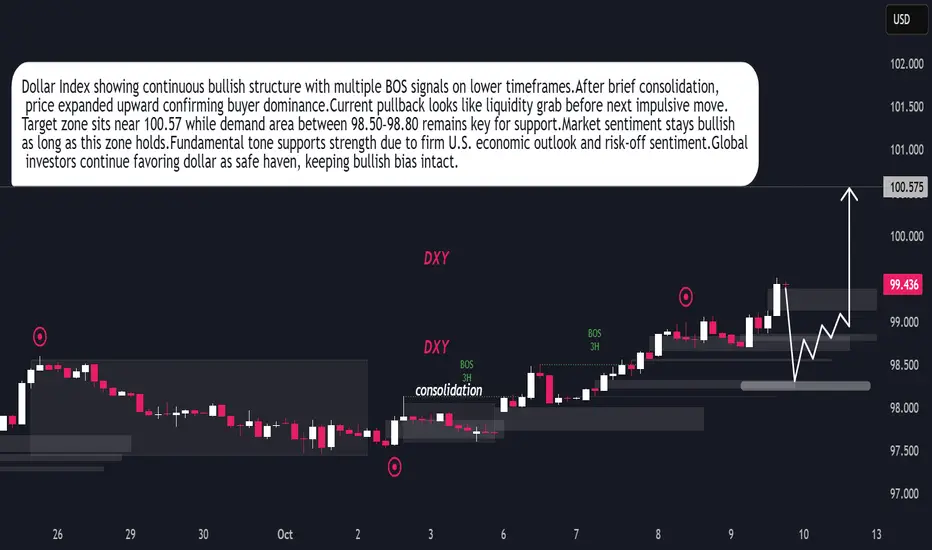
DXY Ready for Next Bullish Leg After Liquidity SweepDollar Index maintaining bullish structure after recent BOS on 3H timeframe.Market formed consolidation phase early October before expansion.Buyers showing control pushing price towards 100.57 objective.Current retracement indicates liquidity grab before next bullish impulse.Demand zone 98.50–98.80 remains key area for continuation.Technical sentiment stays positive as long as price holds above 98.50.Fundamentally, dollar supported by strong U.S. data and cautious global tone favoring safe-haven demand.Momentum outlook remains bullish with potential continuation toward 100.50+ zone.
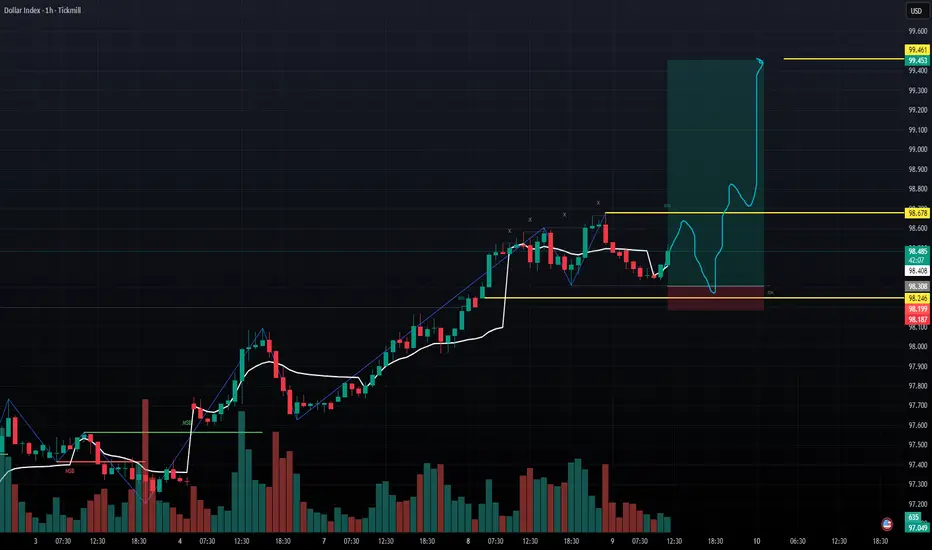
dollar index is showing strengthif go with dollar as seen in chart it is taking support from its bullish order block of the structure and liquidity sweep is pending if it takes liquidity and sweep the early buyers it has potential to hit the target with in 24 hours .
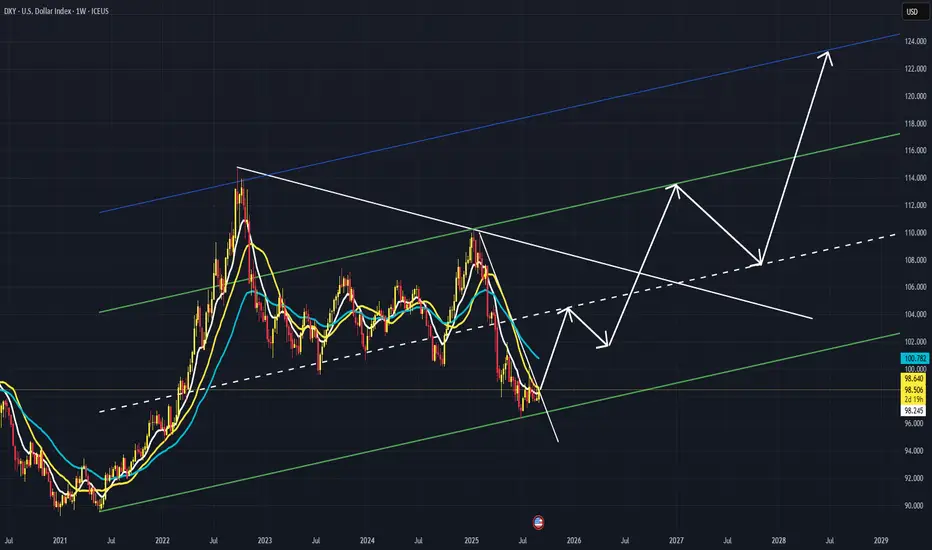
The Dollar’s Journey💵 The Dollar’s Journey – From Blastoff to Pause, and Maybe… Another Run?
Back in May 2021 , the Dollar Index (DXY) quietly started climbing. At first, nobody gave it much thought. But then 🚀 it took off—running from 89 to 114 in just over a year. That’s what traders call a parabolic move —fast, powerful, and impossible to ignore.
Then came September 2022 . The rally cooled off. The dollar stopped sprinting and instead moved sideways. For the next three years , it was all about patience. The index slipped as low as 95.5 , testing everyone’s nerves. Was the bull run dead, or just taking a breather? ⏸️
Here’s the twist: that low wasn’t random. It actually landed right on a major long-term trendline —a line that connects the tops of 2001, 2016, and 2020 . In other words, the dollar was pulling back to recharge at home base . 📉➡️📈
Now the picture gets exciting again. The correction looks done. The index is knocking on the door of 100 —and this number isn’t just psychological, it’s technical too. If DXY sustains above 100 ✅ , it could light the fuse for the next bull run 🐂💵 .
And remember, when the dollar moves, the world feels it:
* 📉 Global equities, especially emerging markets, often struggle.
* 🛢️ Commodities like gold and oil usually come under pressure.
* 💱 Other currencies—the euro, yen, pound—tend to weaken.
So here we are, three years after the peak. The dollar looks ready to decide its next chapter. Will it stay stuck in consolidation… or break out into a brand-new bull cycle? Traders, investors, and even governments are watching closely. 👀
The story of the dollar isn’t over—it might just be about to get interesting again. 📊✨

DXY/GOLD RATIO ANALYSIS The DXY/Gold ratio has been in a persistent downtrend, now testing deep lows. Momentum shows early signs of stabilizing, with RSI near oversold and MACD flattening.
⚖️ A rebound here could mean relative strength shifting back toward the Dollar over Gold. Keep an eye on follow-through.

U.S DOLLAR INDEX ANALYSIS Today fed meeting I hope ( $ 95’28 ) break this support and gona down . Let see how to market react in all trader 🤔.

Bullish This chart is clear cut described dxy movement is ready for reversal
If this structure continue,we can see sharp fall in bullion
This chart is only for learning purpose
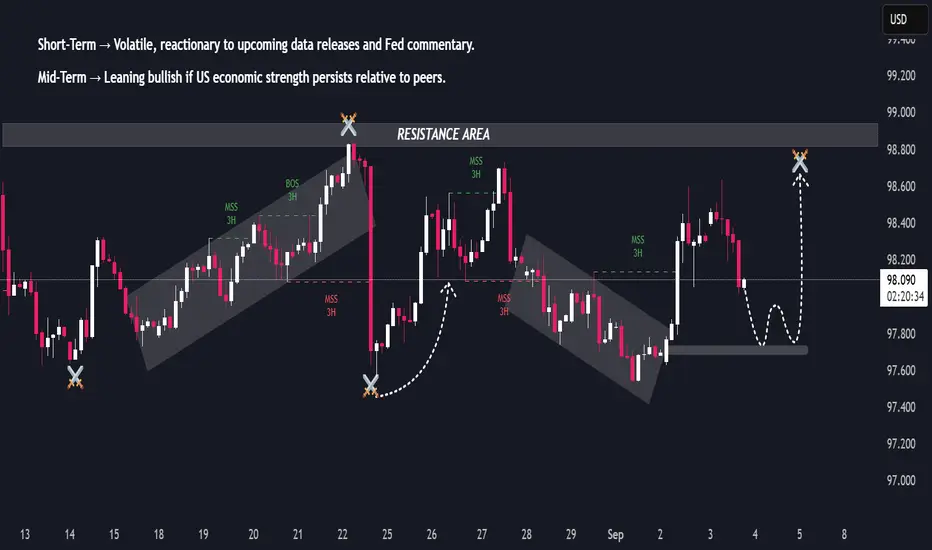
DXY Outlook: Volatility Dominates as Fed Uncertainty PersistsDXY Outlook: Volatility Dominates as Fed Uncertainty Persists
DXY (US Dollar Index) Analysis Report
🔎 Technical Outlook
The index recently moved in a clear upward cycle, followed by a sharp rejection, highlighting the market’s sensitivity to macro shifts.
Price action has transitioned into volatile swings, with both bullish and bearish impulses shaping short-term structure.
Current momentum shows cyclical corrections within a broader attempt to sustain bullish rhythm, but intraday moves remain reactive to news flows.
Market behavior suggests traders are seeking liquidity both sides before choosing a decisive directional move.
🌍 Fundamental Outlook
Federal Reserve Policy: Speculation around rate adjustments remains the dominant driver. Softer inflation data has kept expectations for gradual easing alive, while labor market resilience adds uncertainty.
Global Risk Sentiment: Dollar demand fluctuates with equity market flows — stronger equities reduce safe-haven demand, while risk-off tones boost USD.
Geopolitical Factors: Ongoing tensions in trade and global supply chain disruptions support occasional flight-to-safety flows into the dollar.
Comparative Growth: While the US economy shows relative resilience versus peers, diverging central bank policies (ECB, BOJ, BOE) also influence dollar positioning.
Investor Behavior: Large funds are rebalancing exposure — maintaining a neutral to cautiously bullish stance on USD until clearer macro signals emerge.
Can DXY make it to 125?Interesting thought as geopolitical forces gather and discuss the fate of USA ... Can DXY make it to 125 in a 5 wave rise in next 3 years or so?
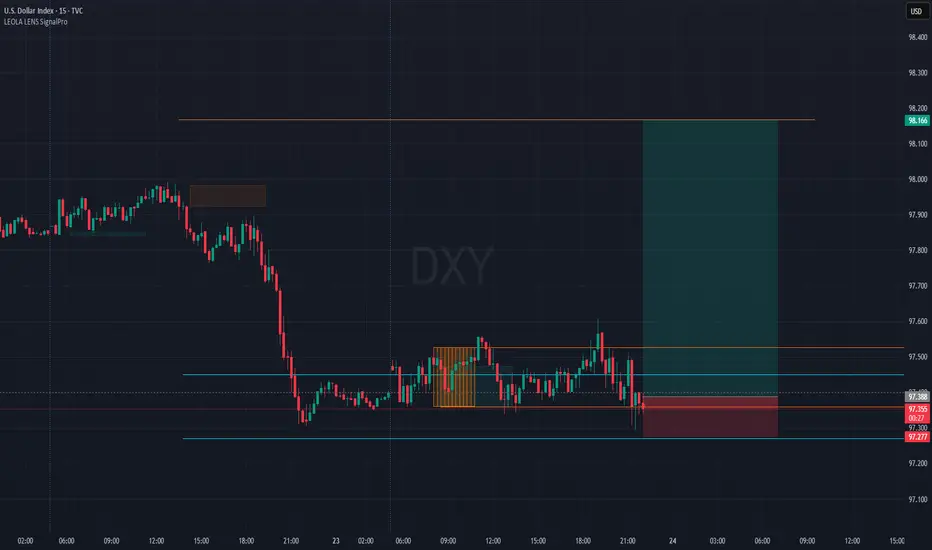
DXY Range Break Attempt- Can the Dollar Regain Control?DXY showing signs of life after an extended sideways compression near key structure lows.
Price reacting from SignalPro’s Liquidity Control Zone, hinting at possible bullish shift.
📈 Long setup framed with:
Retest of lower zone holding above 97.28
Targeting upper imbalance toward 98.166
🟧 Previous caution label reflected indecision phase – now resolving with fresh push attempt.
Key Technical View:
🔹 Tight range breakdown rejected, forming potential bear trap
🔹 SignalPro highlights entry zone clarity and risk-defined setup
🔹 Bullish continuation scenario valid above demand zone hold
🧠 Chart for learning purposes only.
📊 Tool: Leola Lens SignalPro | ⏱ Timeframe: 15m
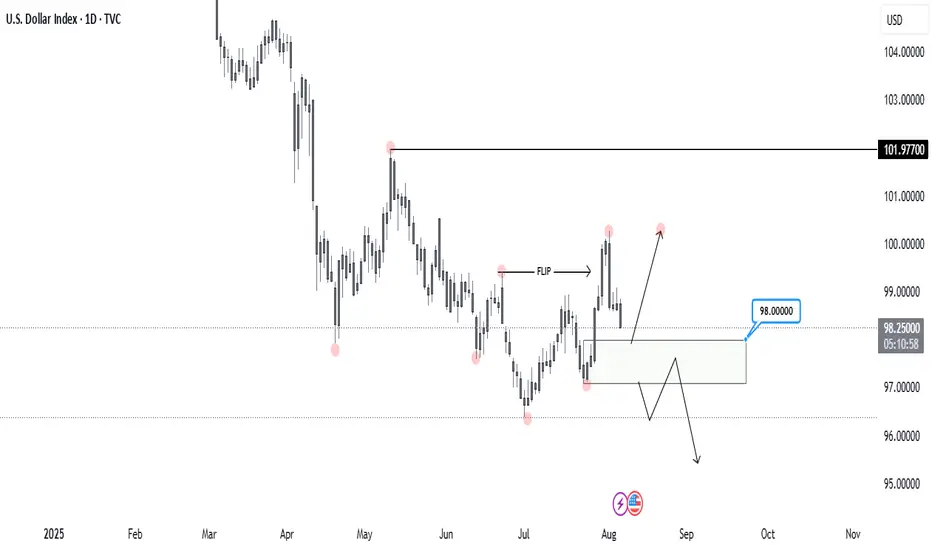
DXY, DAILYLet’s take a look at DXY on the Daily timeframe.
Price recently broke the previous Higher Low, flipping the structure to the downside. This marks a significant shift in momentum.
Now, I'm watching the 98.000 level, which I’ve identified as a Daily Demand Zone. It’s the origin of the move that broke the previous bearish structure, making it a key area of interest.
I’ll be waiting for a reaction from this zone to see if buyers step in again ( most likely ) or if the bearish momentum continues.
That would be my confirmation for xxx/usd shorts.
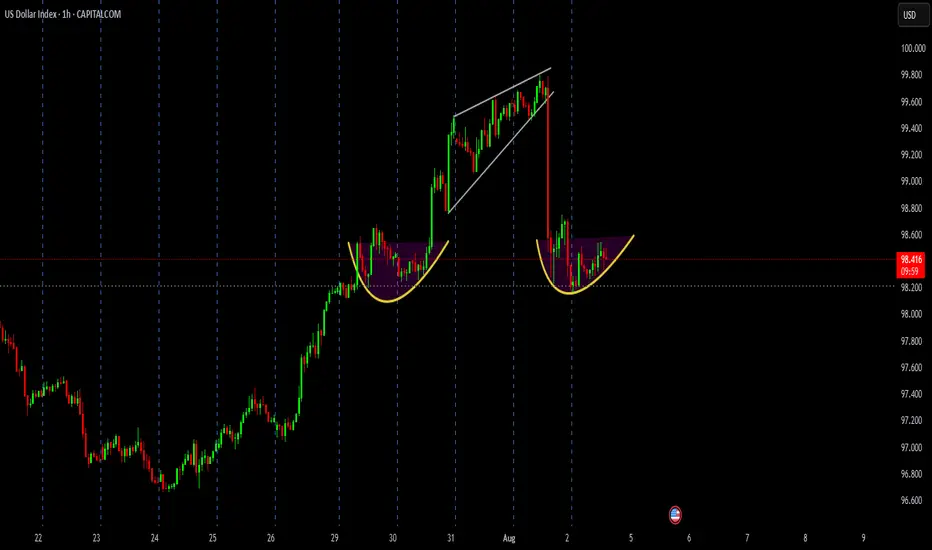
US Dollar Index (DXY) Analysis – 1H Chart📌 Chart Patterns in Focus:
1️⃣ Cup & Handle Formation (29–31 July):
Bullish reversal pattern spotted
Price broke out sharply upwards after the handle consolidation
2️⃣ Rising Wedge Breakdown (31 July – 1 Aug):
Bearish pattern triggered heavy selling
Sharp red candle confirms strong bearish pressure
3️⃣ New Cup Base Forming (2 Aug – Present):
Price consolidating after drop
Another Cup & Handle formation in progress
Break above neckline near 98.60 could trigger next bullish wave
💡 What to Watch Next:
Breakout above 98.60 = Possible upside continuation
Failure to breakout = Range-bound or bearish retest of 98.00
📍Current Price: 98.425
⏱️ Timeframe: 1 Hour
📈 Bias: Cautiously Bullish (if neckline breaks)
📉 Risk: Another rejection may lead to 97.80 zone retest
🔔 Stay tuned for breakout confirmation before positioning!
#DXY #USDIndex #TechnicalAnalysis #ChartPatterns #ForexTrading #PriceAction #CupAndHandle #RisingWedge #SmartTrading
DXYAs you can see, this is the US Dollar Index (DXY) on the 15-minute chart. Coming down from the higher timeframes, the macro bias on DXY remains bearish. While fundamentals will, of course, play a key role, technically speaking, after a strong move to the upside, it's natural for price to retrace lower—whether as a correction before continuing higher or potentially beginning a deeper move down.
📉 What I'm Watching:
If price reacts from the current zone and starts dropping, this could serve as extra confirmation for potential XXX/USD buys.
If that setup doesn't play out here, I'm still expecting a similar scenario—just slightly higher, possibly from within the daily supply zone.
Either way, I'm remaining patient and letting price show its hand.
Have a great week ahead!
Blessings! 🙏

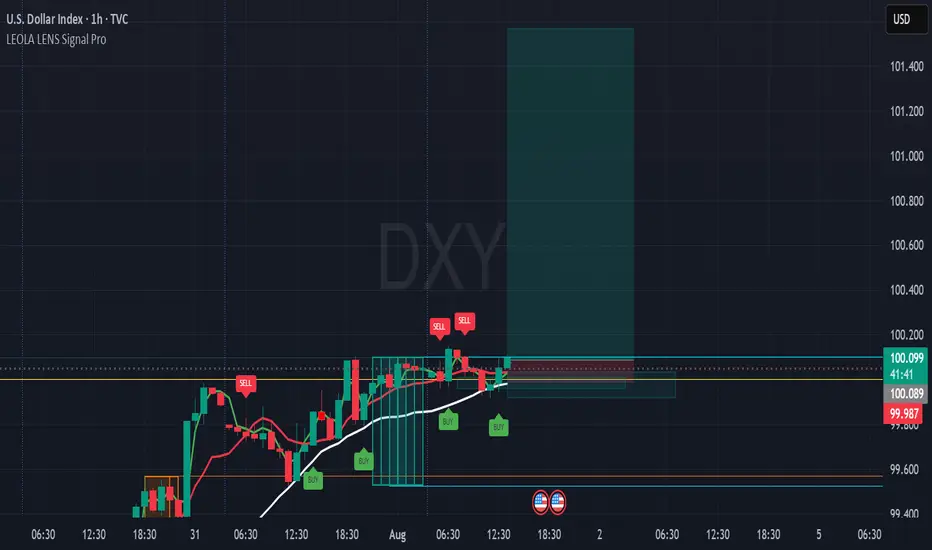
DXY Long Setup Forming After Structure Reclaim-101.567This intraday chart on DXY (U.S. Dollar Index) showcases a structure-aware long setup using Leola Lens SignalPro on the 1H timeframe.
⚙️ Key Technical Highlights:
🟢 Multiple BUY signals appeared near 99.98–100.00 zone after reclaiming short-term structure.
⚪ Price holds above the white adaptive base trendline — suggesting support strength.
🟥 Liquidity Control Box defines a clear invalidation zone under 99.98.
🔁 Prior SELL signals failed to follow through, indicating weakening bearish momentum.
📊 Target projection: 101.567 (based on structural extension and signal alignment).
📌 What to Monitor:
🔎 A decisive candle close above 100.10–100.15 can confirm bullish intent.
🎯 Reward-to-risk favored on clean setups post-breakout, aligning with momentum model.
📉 Invalid if structure re-breaks below base zone with volume.
⚠️ Educational use only. Not financial advice. Structure zones visualize behavior — not prediction.
🔐 Invite-only tool — access details in author bio.
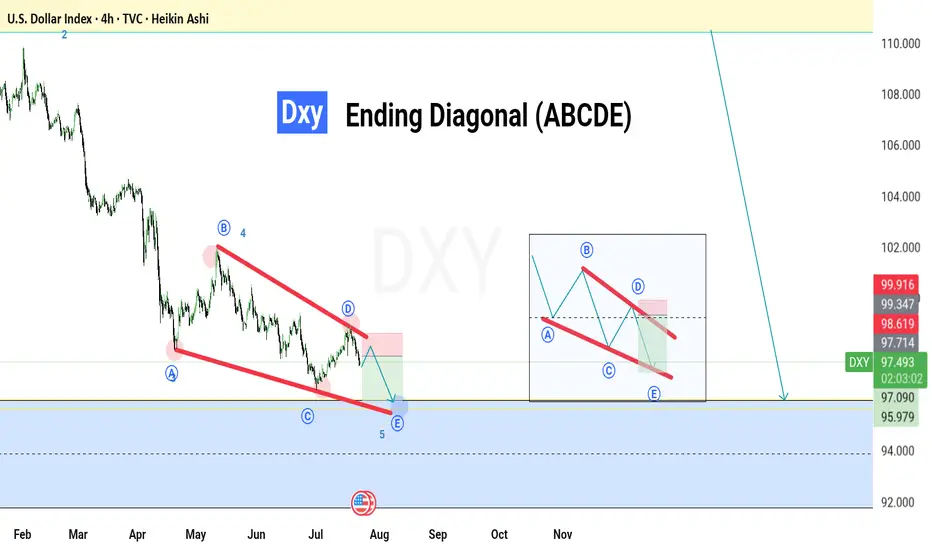
DXY – Elliott Wave Ending Diagonal In Play (4H Chart)
Price is moving within a well-defined falling wedge structure, forming an Ending Diagonal (ABCDE).
🔹 Currently in Wave D → E, expecting final leg down toward the 95.97–97.00 zone.
🔹 Previous resistance at 98.60–99.30 acted as a key rejection area.
🔹 If the wedge holds, we could see a potential bullish reversal from the blue support zone.
Key Outlook:
📍 Short-term bearish pressure
📍 Medium-term reversal expected if Wave E completes
📍 Eyes on confirmation from price action + volume near the wedge base
💡 Trade smart. Respect structure. Wait for confirmation.
🔔 Follow for more real-time wave-based analysis.
#DXY #ElliottWave #TechnicalAnalysis #Forex #PriceAction #TradingView #DollarIndex #WaveTheory