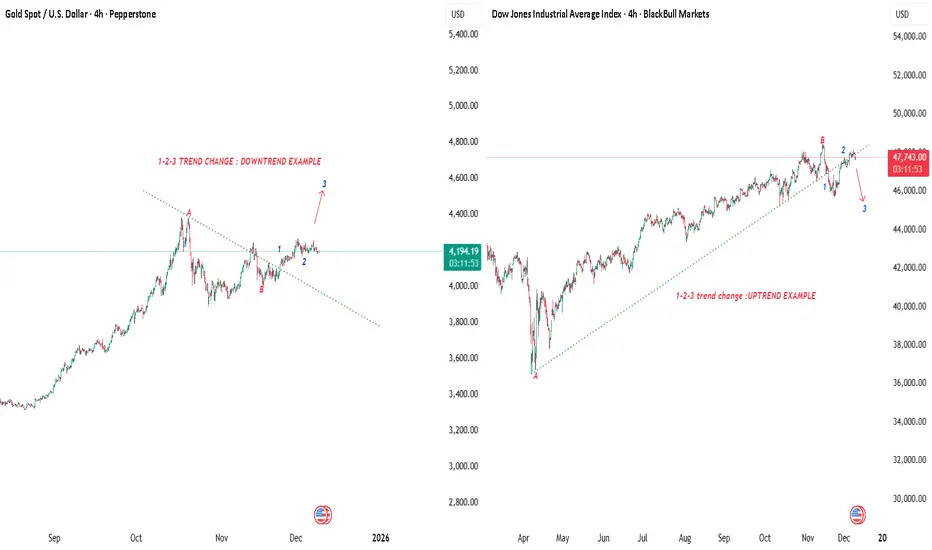
Price Action Pattern Series- 1-2-3 Trend Change Method !Starting this series with a very reliable structure-based reversal technique. The 1-2-3 method helps identify when a trend has actually changed instead of guessing bottoms or tops.
In simple terms, the trend shifts only after three structural events complete:
Sharing a simple but powerful reversal
Related indices
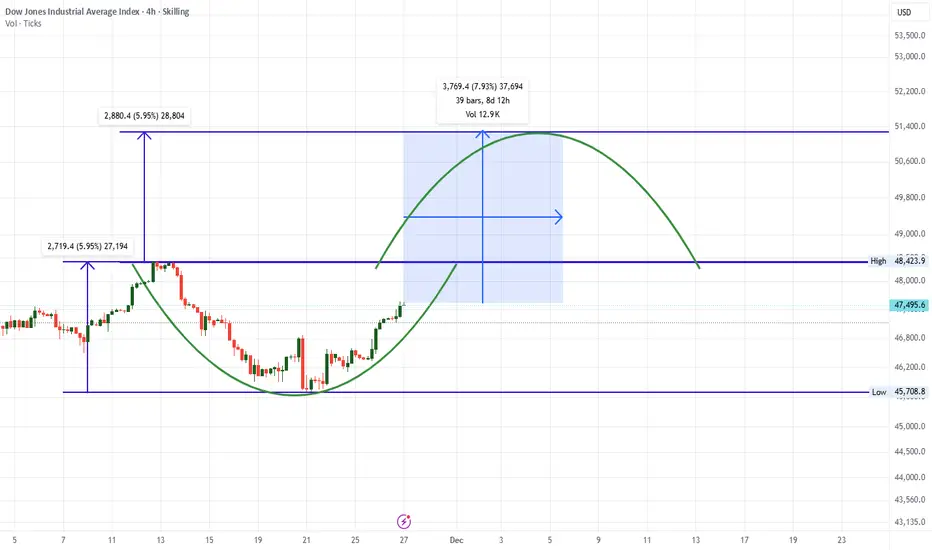
DOW Jones is having rounding bottom formation - 8% upside targetDOW Jones is having rounding bottom formation - 8% upside target Possible.
LTP - 47500
Targets - 51300+
Timeframe - Dec-25 End.
Charts are suggesting Bull market run of 8% in next few weeks on Dow Jones - Possibility of some Positive news flows across world to take markets on big upmove in Dec M
US30 High Volatility ExpectedBy looking into the US30, lot of $liquidity$ are seated on downside and upside with an Target mentioned in the Chart.
Based on the Event ADP and Federal Fund rate , both the liquidities will be hunted in the market. Keep Looking happy Trading

Higher highs and below SMA( Weekly high > 1 week ago high AND ( Latest Close < SMA(Latest Close, 50) OR Latest Close < SMA(Latest Close, 200) ) )


Dow Jones at resistance, should expect some down sideAs we see Dow is moving in a trend , breaking the trend on upper side is unlikely , expect some correction .
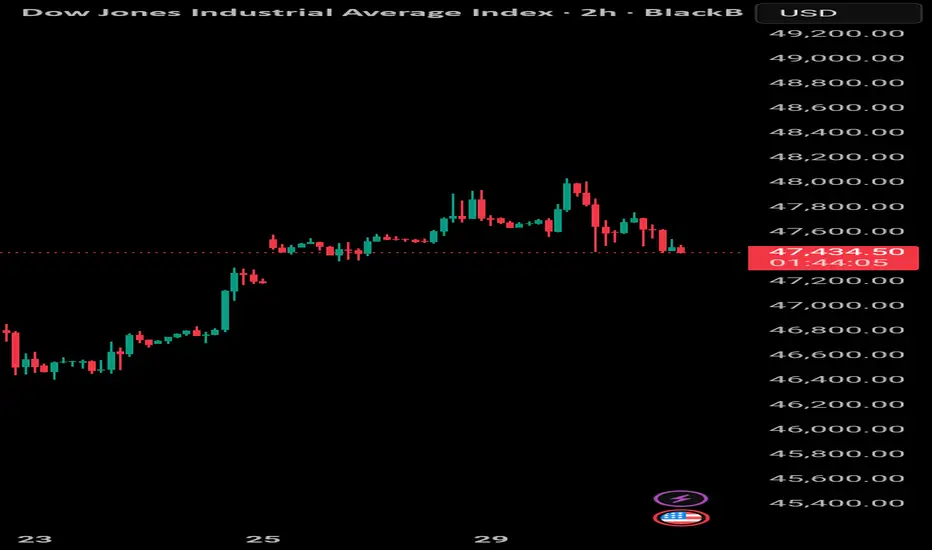
DJI 1HRSWING TRADE
- EARN WITH ME DAILY 10K-20K –
DJI Looking good for upside..
When it break level 47451 and sustain.. it will go upside...
BUY@ 47451
Target
1st 47700
2nd 48036
Enjoy trading traders.. Keep add this STOCK in your watch list..
Big Investor are welcome to join the ride ..
Like this Po

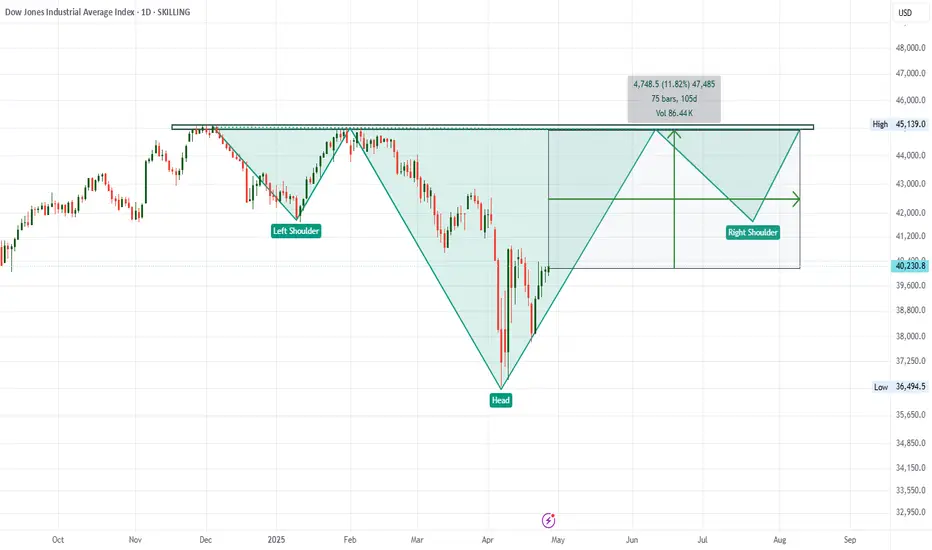
Dow Jones shows Inverse H&S Pattern getting developed.11% upsideDow Jones shows Inverse H&S Pattern getting developed.
11% upside possible in next 4-5 Months.
Happy Investing.
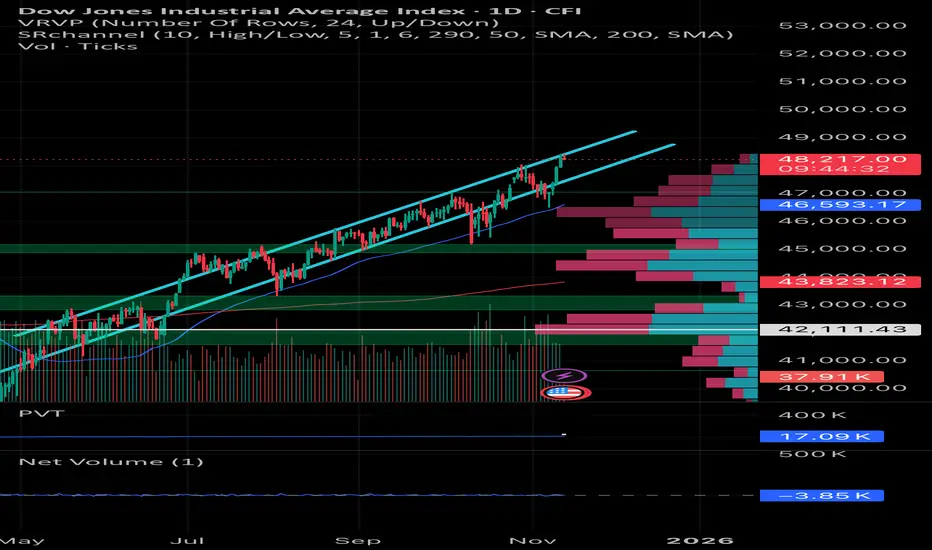
DOW JONES 30 on Weekly ATH Breakout ... Next 1 Year is BullishDOW JONES 30 on Weekly ATH Breakout ... Next 1 Year is going to be super Bullish.
All Good news will start flowing - Interests rate cuts / End of long ongoing Wars / Peace in World / GDP growth.
'Yahi samay hai, sahi samay hai...Bharat ka anmol samay hai': PM Modi recites thought-provoking poem on

See all ideas
Displays a symbol's price movements over previous years to identify recurring trends.
Frequently Asked Questions
Dow Jones Industrial Average Index reached its highest quote on Nov 12, 2025 — 48,420.3 USD. See more data on the Dow Jones Industrial Average Index chart.
The lowest ever quote of Dow Jones Industrial Average Index is 15,308.0 USD. It was reached on Aug 24, 2015. See more data on the Dow Jones Industrial Average Index chart.
Dow Jones Industrial Average Index is just a number that lets you track performance of the instruments comprising the index, so you can't invest in it directly. But you can buy Dow Jones Industrial Average Index futures or funds or invest in its components.