Dow Futures E-mini Dow Jones Industrial Average Index Futures Completed its wave 5 in 1 htf. A complex correction is expected.
Micro E-mini Dow Jones Industrial Average Index Futures
No trades
Trade ideas

Get ready for bull runDow jones is getting ready bull run. Expect it to touch 43415 - 44071 by December 2024. Bottom has already formed.

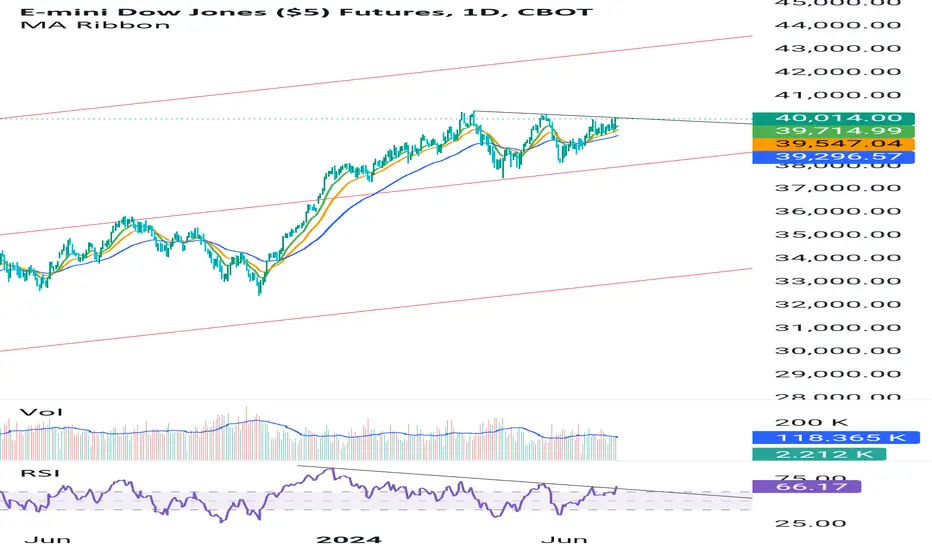
Negative divergence Negative divergence, near the top end of slope, is suggesting short term top is in near future. 38500-38750 is the zone for short term top. Close above 38800 will negate this view.

dow jones future bearish at resistance/sell zoneCBOT_MINI:MYM1! may give sharp fall from the current sell zone if sustains below 34121 and gives daily closing below it

Dow JonesHere is the LONG TERM Channel of the Dow Jones since 2007 or so with Price staying well within the Channel for all these many years. What I have spotted are the 4 SUPPORT areas since 2009 or so and simply attached all those support areas to draw a PERCEPTION LINE between the Broader Channel . In the Green color I have given an IMAGINERY path which it will take towards '' 60000''. I posted the Future chart by mistake but M sure you all understand the Logic behind it

Dow - BearishLooks Like a Good Set up of Head & Shoulders
Might just go down to Targets
Check if you Like & Agree

DJIA In as much as it is the DJIA futures chart............ just co-relate to Spot..... Have given you the CHICKEN HIDING.................... Lets see what happens..., So far Sooooooo Good


#dowjonesi am not a sebi registerd dow jones is making a negative pattern sell below the red zone if it is fall below the red zone messive selling is come
Note :- this is my early view donot sell befor the level is come

DJIA preparing for Big Breakdown As monthly chart of DJIA formed tweezer top last month, also golden retracement done from the top
Here I'm expecting a big fall in DJIA for the coming weeks/months.
Stay alert!

dow future trading inside triangle pattern CBOT_MINI:MYM1! watch out for either side of triangle to break for one directional breakout move

Dow jones Look Good for Short* All the information shared in this chart is provided for strictly educational purposes only.
* This chart is sharing information are based on the theory of technical analysis .
* This is not an offer to buy or sell stocks, futures , options, commodity, forex, interests or any other trading security.
* Back test yourself before jump into live market consult your financial adviser and use proper risk management.
------------------------------------------------------------------------------------
Mini Dow jones Level's
------------------------------------------------------------------------------------
SMC Selling area is near 34906 - 34930
And Short Area is 34906
Below this level 34765 free fall will start.
************************** Target down side ********************************
Trade : Sell between 34906 - 34930 SL will be 120-130 Points (35033)
Target will be downside : 34680/34599/34483/34400/34311/34225
____________________________________________________________
Visit Us for more details and follow us for more Education Analysis
____________________________________________________________
Trading_Cafe24
Thank you :)

Down JonesPrice has retraced back from UML. Now heading for CML at 38.2% level which can be expected by 30-Mar to 3-April, if the slope is right.
Dsic : It's not an investment advise to buy or sell

Buy - R:R of 1: 13Buy Dowjones future in dip around 33850-33650 stop loss 33200 closing basis target 41800-42300 by either mid week of Feb 2024 or mid week of April 2024.
Disc : It's not an investment advise to buy or sell.


E-mini Dow JonesThis is only my view .... as of now E-mini Dow Jones is taking resistance form 61.8%

Dow all set to see new highs.🟢After a decent correction Dow is all set to see new high.
🟢This IHNS formation if succeeds Dow can print 37800.
🟢Monthly and bi-weekly RSI trading above 55 & bullish.

dow jonesThe ONLY ALTERNATE WAVE COUNT on the DJIA which MAY arise. This last wave down will create fear and panic like no ones Business.... Be unmindful of this Last wave.... I AM INVESTING INTO PENNYS

#YM1! #DowJones - View#YM1! #DowJones - could be headed for a short pullback. In fact, seems the bull run rally is not going to stop soon.

Dow Jones don't do thisDow Jones was trading in marked channel for 2022, we had a breakout and now it looks to enter this range.
It can touch lower support in few months now and globally it will be start of Bear Rally
RIP Bulls

Dow Jones double Top, now will go down Dow Jones is at double top, it is possible to go down now as this is a strong resistance, next target may be 33600.
CE holders be careful, book 50% profit, PE Holder should add more with a SL of 20%
