Tight Bearish Signal on CHFJPYWe have a tight Bearish Signal in ICMARKETS:CHFJPY
Unfortunately we have a very tight room for our TP still we will look after it and will MOVE THE SL TO BREAK EVEN AS SOON AS THE PRICE TOUCHES THE DAILY TRENDLINE
Price may get a fullback from the Daily Trendline which is a barrier to our first TP.
However, after breaking the daily trendline and hitting our first TP, our other trade will still aim for its target with very high reward and 0 risk.
I will place a sell stop order 185.76 with my SL at the Higher High at 186.28
I will take two positions both at the breakout Higher Low at 185.76. Both position has 2% risk in total with the stop loss at 186.28
IMPORTANT: Eye on daily trendline, if the price hit the trendline then move both SLs to Breakeven and trade at 0% risk, aiming for both the trades to hit TP1 and TP2.
Position 1 with 1 % Risk
Sell Stop: 185.76
Stop Loss: 186.28
TP: 185.24
Position 1 with 1 % Risk
Sell Stop: 185.76
Stop Loss: 185.2
TP: 184.35
CHFJPY trade ideas

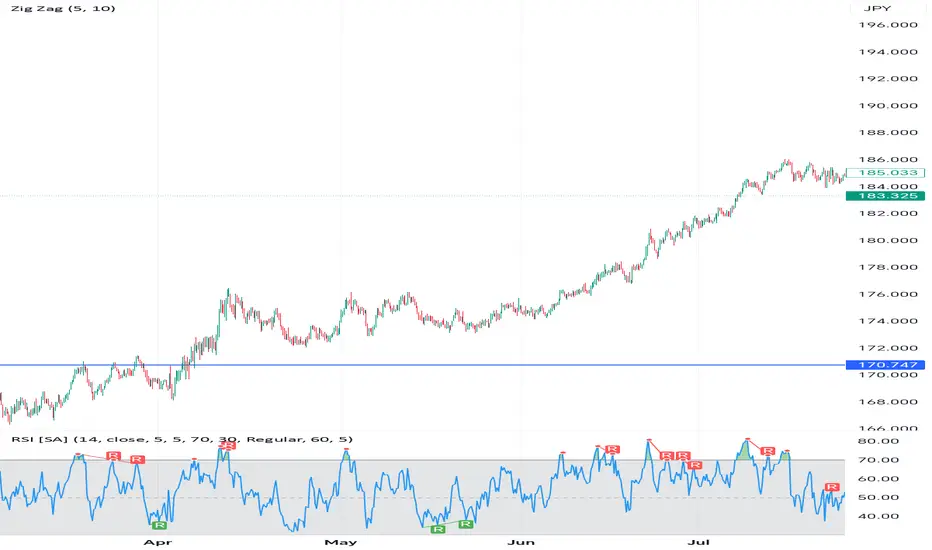
CHF/JPY 4H Technical Analysis – Bulls Still in ControlThe CHF/JPY currency pair has been on a strong bullish run since April, with price moving in a clear uptrend of higher highs and higher lows. On the 4H chart, the pair recently reached the 185.03 resistance zone before retreating slightly, which now raises the question: can the bulls sustain momentum, or is a correction due?
Trend Overview
The medium-term structure remains bullish as price continues to respect the rising trend.
Since breaking above 176.00, buyers have consistently pushed the pair higher, reflecting strong Swiss franc demand against the yen.
Current market action suggests consolidation after the latest rally, with traders carefully watching the 185.00–186.00 level.
Resistance Zones:
185.00 – 186.00: Recent swing high, potential selling pressure.
190.00: Major psychological barrier if bulls break higher.
Support Zones:
183.00 – 182.50: Short-term demand zone where buyers may re-enter.
180.00: Next key downside level if 183.00 fails.
170.75: Major structural support, unlikely to be tested unless a deep correction occurs.
Momentum Indicators
RSI (14): Currently sitting near the mid-range (50–55), suggesting neutral momentum after a strong overbought reading earlier this month.
RSI rejected several times above 70 in recent weeks, pointing to potential exhaustion at higher levels, but no confirmed bearish divergence yet.
Bullish Outlook
If price holds above 183.00, bulls could attempt another breakout above 185.00.
A successful close above 186.50 would likely open the path towards 190.00.
Bearish Outlook
A failure to hold the 183.00 – 182.50 zone may trigger deeper correction towards 180.00.
Breaking below 180.00 would shift momentum and expose 176.50 – 174.00.
Trading Plan (Educational Only – Not Financial Advice)
Bullish bias remains intact.
Consider buying on dips above 183.00 with targets at 185.00 and 186.50.
Alternatively, look for sell opportunities if price rejects strongly at 185.00–186.00 with bearish confirmation signals.
Risk management is crucial, as the pair has shown strong volatility in recent weeks.
Conclusion
The CHF/JPY pair remains in a dominant uptrend, but traders should stay cautious as price approaches the heavy resistance at 185.00–186.00. A breakout above this level could fuel a rally toward 190.00, while a rejection may bring a healthy correction back to 180.00 support.
CHFJPYHello FRIENDS!
The CHFJPY price formed an ascending channel pattern.
At the moment, The resistance line is broken !
So, I expect a bullish move

CHFJPYCHFJPY FOR LONG TODAY AFTER CONFERMATION
Risk Management Notes:
Avoid entry during high volatility news (BoJ, SNB announcements).
Use proper position sizing (e.g., 1–2% of account risk).
Monitor JPY sentiment, as it can change quickly due to risk-on/risk-off shift

CHFJPY Short Setup – Bearish Rejection from Supply Zone & Trendl📋 Description:
Pair: CHFJPY
Timeframe: 2-Hour
Bias: Bearish
Strategy Used: Supply & Demand + Break of Structure + Trendline Retest + Price Action Confirmation
🧠 Analysis & Thought Process:
CHFJPY recently broke out of a descending trendline that acted as dynamic resistance for multiple sessions. Post breakout, price aggressively rallied and is now reacting to a major supply zone between 175.400 – 176.200, which is a previous area of strong selling.
Price formed multiple rejection wicks and a bearish engulfing candle at this supply zone. This is a classic liquidity grab and fakeout setup, where price pushes into premium pricing to trap late buyers before reversing.
Additionally, the market has formed a lower high near the resistance, and is respecting an internal bearish structure on lower timeframes. The risk-to-reward setup is favorable, with a small stop and a high-probability target below.
🎯 Trade Plan:
Entry: 175.450 (after confirmation of rejection inside supply)
Stop Loss: 176.200 (above supply zone and liquidity wick)
Take Profit 1 (TP1): 174.500 (minor demand zone)
Take Profit 2 (TP2): 173.300 (major demand zone + imbalance fill)
Final Target (TP3): 171.200 (macro demand zone)
⚖️ Risk-to-Reward Ratio:
TP1: 1:2
TP2: 1:4
TP3: 1:6+
🧩 Confluences:
Rejection from key 2H supply zone
Bearish engulfing candle at zone
Trendline break retest
Market structure shift – forming lower highs
Targeting imbalance fill and demand zone below
⚠️ Risk Management Advice:
Risk 1% of your capital on this trade. Trail stops after TP1 is hit. If price breaks above 176.200 and sustains, setup is invalidated.
Disclaimer: This idea is for educational purposes only. Not financial advice.

CHFJPY triangle formed big rally ahead#CHFJPY
Sharing a perfect trade, please take a look at below Image,
As per EWT wave 4 Triangle is formed, is near a demand area
wait for price to react .
and the trade starts boom 💥🚀🚀 wave 5 - approx. 400 pips move.

CHFJPY - TIME FOR A LONG ENTRYSymbol - CHFJPY
CMP 167.28
CHFJPY is currently trading within a key support zone, which has been acting as a major support area since November 2023. This level has provided a solid foundation for price action, and its importance in maintaining the current bullish trend cannot be understated.
In my analysis, CHFJPY is presenting a good opportunity to initiate long positions at this juncture. The current price level appears to be well-positioned for upward movement, making it an ideal entry point for traders looking to capitalize on potential gains.
However, there are critical levels to monitor for the potential shift in trend. A breakdown below the 166.30 area could prompt further selling pressure, and a sustained move below 165 would confirm the transition from a bullish to a bearish trend. In such a scenario, a retest of this breakdown level would provide a viable short trade opportunity.
On the other hand, in the case of a recovery, which I am expecting, CHFJPY could see a rise toward the 169.20 and 170.30 levels. These levels represent key resistance points, and a successful breach of these zones could signal a continuation of the bullish trend.
Key Resistance levels: 169.00, 170.30
Key Support levels: 167.20, 166.30

CHFJPY Long Trade Idea!CHFJPY Long Setup 📈
- 🎯 Entry: 171.62
- 🛡️ Stop Loss: 167.60
- 🎯 Target: 178.99
This setup is based on a key support zone near the 200 EMA with a favorable risk-to-reward ratio. Price is expected to bounce from this level towards the target. Trade cautiously and manage your risk appropriately. 🚀"
Let me know if you'd like any adjustments!

CHFJPY- ORDER FLOW ANALYSIS CHFJPY BullishThis currency pair is still bullish, now bulls are ready to make new Higher high, Waiting for a buy signal on lower timeframe.

CHFJPY Long Side Trade Set-upIf the price is manipulated toward the FVG, the long side position might be favourable from the mentioned Fair Value Gap.

CHFJPY Sell @175.125 With SL 176.128USING SMC concept - Daily CHOCH clear confirmation. Need to entry on candle confirmation SCOB

CHF/JPY Analysis: Potential Double Bottom BreakoutIn this chart, I'm analyzing a potential double bottom breakout in the CHF/JPY pair after a downward trend. The price has been moving down and hit a strong demand zone between 174.125 and 174.300, where buyers seem to have stepped in, pushing the price upward.
Technical Observations:
Potential Breakout of Double bottom: The price is trying to break out of the double bottom, which could signal a further upward movement.
Breakout and retest: If the price gives a break out, there might be a small retest and eventually starting moving towards the target.
Target Levels: If the breakout is sustained, my first target is around the 175.810 level, with a secondary target at 176.290, which aligns with previous resistance levels.
Stop-Loss: I've set my stop-loss below the 4h breakout candle if the breakout fails.

CHF/JPY Analysis: Potential Reversal SetupIn this chart, I'm analyzing a potential bullish reversal in the CHF/JPY pair after a downward trend. The price has been moving within a descending channel, with lower highs and lower lows, indicating a bearish sentiment. However, it recently hit a strong demand zone between 174.100 and 174.200, where buyers seem to have stepped in, pushing the price upward.
Technical Observations:
Breakout of Descending Channel: The price has broken out of the descending channel, which could signal a reversal of the downtrend.
Demand Zone Support: The green zones between 174.100 and 174.400 acted as support, creating a base for buyers to initiate an upward movement.
Target Levels: If the breakout is sustained, my first target is around the 174.685 level, with a secondary target at 174.920, and 175.160 as final target which aligns with previous resistance levels.
Stop-Loss: I've set my stop-loss below the demand zone at 174.093 to protect against potential downside risk if the breakout fails and price re-enters the channel.
Trading Plan: I'm looking for a potential long position here, with the breakout from the channel acting as a confirmation for a bullish move. Watching for strong buying momentum to sustain, I’ll look to manage the trade carefully with a close eye on any signs of reversal back into the channel.
Disclaimer: This analysis is for educational purposes only and should not be considered financial advice. Trading involves significant risk, and you should always conduct your own research and consult with a professional financial advisor before making any investment decisions. Past performance is not indicative of future results. Trade responsibly.

Trade Idea On CHFJPY.1. Based on pure price action and Order flow.
2. Fundamentals in favor. Trump winning : JPY gonna sink.
: Study :
"Knowing where the market is going and making profit out of the market are totally different things." Don't confuse yourself. Accept your mistakes. let go of ego.
GET TO WORK.
Starting a community soon.


CHFJPY Short ideaThe price broke and closed below the recent low and made a change of structure;
As the price breaks low, we can expect another impulsive selling move, and every rise is a selling opportunity.
The levels are marked on the chart.

CHFJPY D1CHFJPY D1
If Price reject from this green line then start looking for Confirmation in Lower timeframe and buy till TARGET.
Lower timeframe can be H4, H1,M30.
Entry must be with Lower timeframe confirmation otherwise skip this trade setup.
Thanks.

CHFJPY View!!U.S. stocks moved higher on Monday, following their European counterparts, as markets looked ahead to key data and actions from central banks.
The S&P 500 appeared set to snap a four-session losing streak, bouncing back along with the Dow from its biggest weekly percentage loss since March 2022.
The tech-laden Nasdaq staged a comeback after suffering its largest Friday-to-Friday decline since January 2022 last week.

CHFJPYAnother Yen pair... but it seems interesting, for an explanation and details of this trading idea, check my latest FX video analysis ( 22.7 - x ) Have a great week!
T

CHFJPY SHORT 15MINS OUT LOOKShort if the price fails to close above & forms lower lows & lower highs


SELLING PRESSURE @ CHFJPYCHFJPY showing Selling pressure on QUARTERLY / MONTHLY time frame. If MARCH candle closes as RED, it may go down till any GOOD QUALITY monthly / quarterly DEMAND AREA. In that case it can create good quality Supply Zones on Lower Time frame (Daily, 12hrs, 8hrs, 4hrs) with good risk reward ratio (minimum 5:1).
