Step-by-Step Divergence Trading StrategyOption Pricing Factors
Option prices are influenced by several key factors:
Spot Price: Current market price of the asset.
Strike Price: Pre-agreed exercise price.
Time to Expiry: Longer duration = higher premium (due to time value).
Volatility: Higher volatility = higher premium (greater uncertainty).
Interest Rates: Affect cost of carry.
Dividends: Expected payouts can impact call and put prices.
Trade ideas

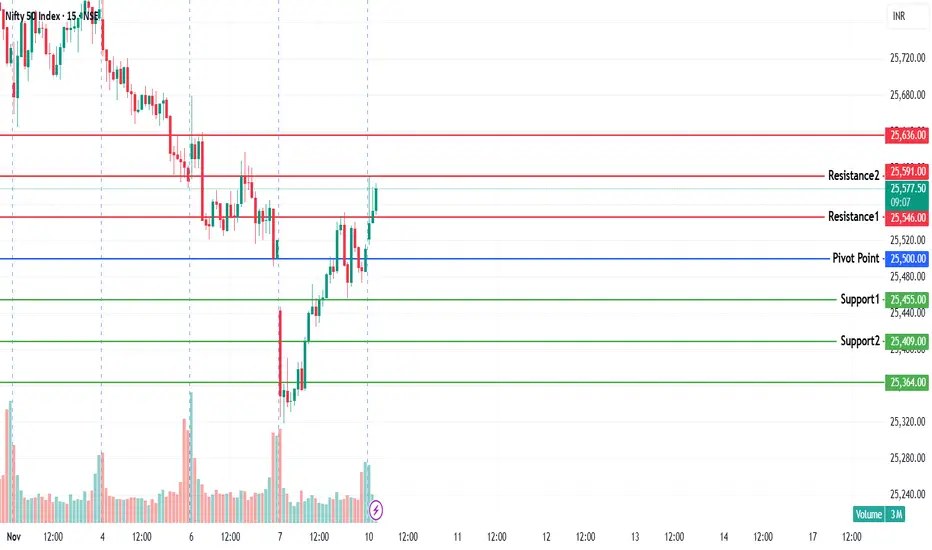
NIFTY KEY LEVELS FOR 10.11.2025NIFTY KEY LEVELS FOR 10.11.2025
Timeframe: 3 Minutes
If the candle stays above the pivot point, it is considered a bullish bias; if it remains below, it indicates a bearish bias. Price may reverse near Resistance 1 or Support 1. If it moves further, the next potential reversal zone is near Resistance 2 or Support 2. If these levels are also broken, we can expect the trend.
When a support or resistance level is broken, it often reverses its role; a broken resistance becomes the new support, and a broken support becomes the new resistance.
If the range(R2-S2) is narrow, the market may become volatile or trend strongly. If the range is wide, the market is more likely to remain sideways
please like and share my idea if you find it helpful
📢 Disclaimer
I am not a SEBI-registered financial adviser.
The information, views, and ideas shared here are purely for educational and informational purposes only. They are not intended as investment advice or a recommendation to buy, sell, or hold any financial instruments.
Please consult with your SEBI-registered financial advisor before making any trading or investment decisions.
Trading and investing in the stock market involves risk, and you should do your own research and analysis. You are solely responsible for any decisions made based on this research.
Does Nifty is really bullish?cpr: narrow+decending cpr.
OI : today highest oi.
1.support:25400, 25300.
2.Resistance:25600,25700.
FII:4581bought.
DII:6674bought.
conclusion:
1.Nifty is not clearly in uptrend but it can go upto 200ma(25749) in 15min chart.
2.In 15min chart nifty can take support in cpr,20ma,50ma.
Disclamier:
Iam not sebi registed so i started this as a hobby,please do your own analysis,any profit/loss you gained is not my concern.I can be wrong please do not take it seriously thank you.

NIFTY Levels for Today
Here are the NIFTY's Levels for intraday (in the image below) today. Based on market movement, these levels can act as support, resistance or both.
Please consider these levels only if there is movement in index and 15m candle sustains at the given levels. The SL (Stop loss) for each BUY trade should be the previous RED candle below the given level. Similarly, the SL (Stop loss) for each SELL trade should be the previous GREEN candle above the given level.
Note: This idea and these levels are only for learning and educational purpose.
Your likes and boosts gives us motivation for continued learning and support.

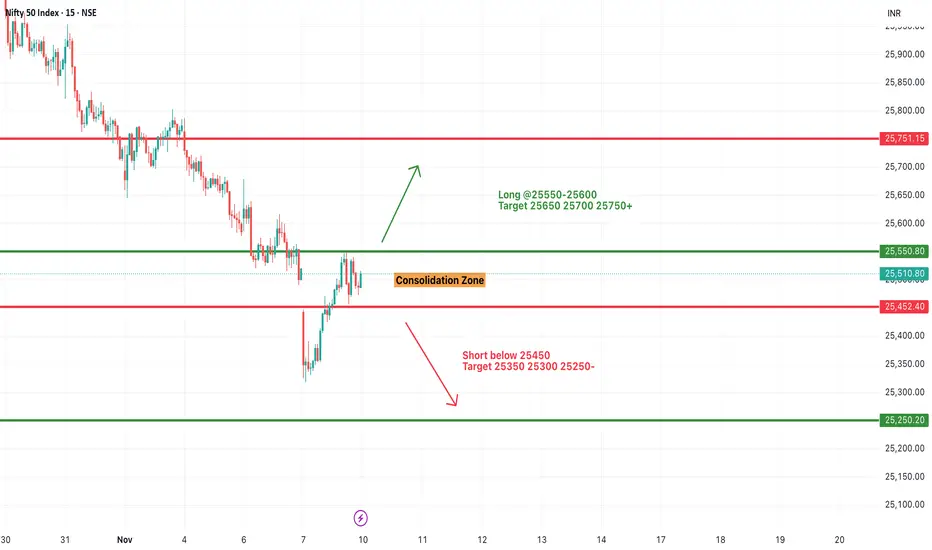
#NIFTY Intraday Support and Resistance Levels - 10/11/2025Nifty is expected to open flat to slightly gap up near the 25,500–25,550 zone, showing early signs of stability after the recent correction. The index is currently trading within a consolidation range, where both buyers and sellers are actively defending key levels.
If Nifty sustains above 25,550–25,600, it may trigger a short-covering rally toward 25,650, 25,700, and 25,750+. A breakout above 25,750 could further strengthen the momentum and shift sentiment toward the bullish side.
On the downside, immediate support lies near 25,450, and a breakdown below this level may lead to a retest of 25,350, 25,300, and 25,250 zones. Sustained weakness below 25,250 would open the door for deeper corrections.
Overall, with a flat to slightly gap up opening, Nifty may witness a range-bound to mildly positive session in the first half. Traders should watch for a breakout above 25,600 for long opportunities or a breakdown below 25,450 for short setups, while maintaining tight stop losses in this consolidation phase.
Nifty Analysis - 10/11/25Market showed some Support and tried to show upside momentum but it needs to close above 25620 for CE trades. For PE trades we need to close below 25430. Zone in between is sideways. Look at premiums left in OI and see how the movement can be for the day.

How will 25500 act now! As a SUPPORT or RESISTANCE!?As we can see NIFTY showed strong recovery despite opening weak exactly as analysed bt failed to close above 25500 which could potentially make 25500 psychological level as STRONG DEMAND ZONE TURNED SUPPLY ZONE but will turn void if opens gap up and sustains itself above 25500! 25500 can be ascertained as a SUPPLY ZONE only if NIFTY despite opening strong fails to hold itself above 25500 and closes below so keeping all these important points in mind, plan your trades accordingly.
Huge fall awaiting in NiftyVery big correction awaiting. You can see clearly in my Nifty chart. In 2008 it was a great fall. In corona everyone knows, what happened. Now same Stochastic pattern created again. Mkt will go to 16000 range.
Don't panic. Stay away from investment for 3 months. Invest lumsum when mkt goes to 15 Stochastic value .

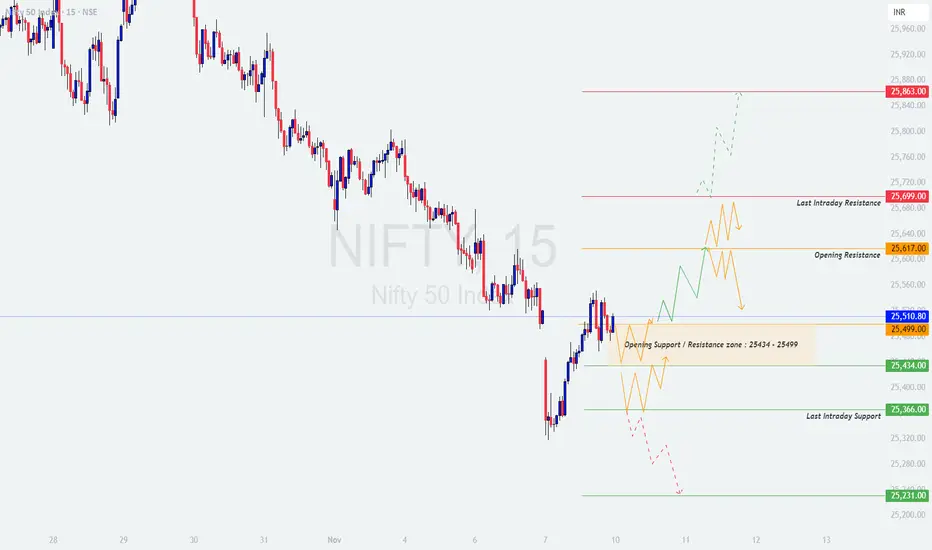
NIFTY - Trading levels and Plan for 10-Nov-2025📊 NIFTY TRADING PLAN — 10 NOV 2025
(Timeframe Reference: 15-Min Chart)
Chart Summary:
Nifty is currently trading around the 25,510 zone, situated right near the Opening Support / Resistance Zone (25,434 – 25,499) . The market structure shows a short-term base building, with the index now oscillating between 25,434 on the downside and 25,617 on the upside. A breakout beyond either level could define the trend for the session.
Key levels to watch include:
🟢 Resistance Zones: 25,617 (Opening Resistance), 25,699 (Last Intraday Resistance), 25,863 (Next Upside Level)
🔴 Support Zones: 25,434 (Immediate), 25,366 (Last Intraday Support), 25,231 (Final Support)
With volatility expected due to global cues and options expiry positioning, traders should emphasize patience, discipline, and confirmation before entry.
🟢 Scenario 1: GAP-UP Opening (100+ Points)
If Nifty opens near or above 25,610 – 25,640 , it will directly test the Opening Resistance zone. Bulls need to sustain above this level to maintain control.
If price sustains above 25,617 for 15–30 minutes with strong candle closings and rising volume, a move toward 25,699 and possibly 25,863 can unfold.
However, if price fails to sustain above 25,617 and forms rejection candles or bearish patterns (like shooting star or engulfing), traders can expect a pullback toward 25,510 – 25,499 .
A failed breakout above 25,617 can offer a short-term shorting opportunity back into the consolidation range.
Avoid aggressive long entries immediately after the gap-up — wait for retests and volume confirmations.
💡 Educational Note:
A gap-up does not guarantee continuation. Many traders get trapped in "breakout euphoria" without waiting for confirmation. The key is sustained price action with strong volume. Smart traders often buy on dips after confirmation, not at the peak of the first candle.
🟧 Scenario 2: FLAT Opening (Within 25,434 – 25,499 Zone)
A flat opening inside the Opening Support / Resistance Zone will likely cause initial indecision. The market may first trap both sides before picking direction.
Avoid trading the first few 15-min candles if price stays within 25,434 – 25,499 .
If price breaks above 25,499 decisively with strength, the momentum could carry it toward 25,617 and 25,699 .
If price breaks below 25,434 , it may drag the index lower toward 25,366 , and in case of strong selling, 25,231 .
Ideal strategy: Wait for breakouts with closing confirmation. Avoid countertrend trades in this setup.
🧠 Educational Tip:
Flat openings test patience — they’re designed to frustrate impulsive traders. Remember: The first move after a flat open is often false. Wait for clear direction confirmed by price structure and volume alignment before taking a stance.
🔴 Scenario 3: GAP-DOWN Opening (100+ Points)
If Nifty opens below 25,410 or near 25,366 , sentiment may turn weak initially, bringing the Last Intraday Support (25,366 – 25,231) into focus.
If a reversal candle forms near 25,366 – 25,231 (hammer or bullish engulfing), traders can look for short-covering opportunities toward 25,434 – 25,499 .
However, if price sustains below 25,366 , then weakness can extend further, possibly toward 25,200 – 25,150 zones.
Avoid shorting immediately after a big gap-down. Wait for a pullback toward resistance levels for better entry and risk-reward balance.
Volume confirmation near support zones is critical — weak volume during selloffs often precedes reversals.
📘 Educational Insight:
Gap-downs tend to trigger fear-based selling early in the session. The best approach is to observe — not react — in the first few minutes. If buyers start stepping in near strong support levels, that’s often where reversals begin. Let price tell you its story before taking sides.
💼 RISK MANAGEMENT TIPS FOR OPTIONS TRADERS:
Avoid buying options during the first 15 minutes of volatile openings — inflated IV spikes can cause fast premium decay.
Always define your stop-loss before entry and risk a maximum of 1–2% of total capital per trade.
Use ITM options for cleaner directional plays; avoid far OTM contracts unless volatility breakout is confirmed.
Trail stop-losses once your trade moves 30–40 points in your favor — protect profits and minimize emotional exits.
Never trade without a plan. The best traders protect their capital first, profits come next.
📈 SUMMARY:
🟧 Opening Support / Resistance Zone: 25,434 – 25,499
🟥 Resistance Zones: 25,617 / 25,699 / 25,863
🟩 Support Zones: 25,434 / 25,366 / 25,231
⚖️ Bias: Neutral-to-Bullish above 25,499 | Weakness below 25,434
📚 CONCLUSION:
Nifty is currently at a pivotal range, consolidating before its next major breakout. The 25,434 – 25,499 zone is the short-term decision point. A break above 25,499 can reignite bullish sentiment, while a fall below 25,434 may extend weakness toward 25,366 or even 25,231 .
Be patient during the opening volatility and focus on clarity over speed. The first 15–30 minutes often decide the day’s fate — don’t rush into uncertain setups.
📊 Consistency in following your plan is more powerful than chasing every move.
⚠️ DISCLAIMER:
I am not a SEBI-registered analyst . The views and levels shared are for educational purposes only . Please do your own research or consult a registered financial advisor before making any trading or investment decisions.
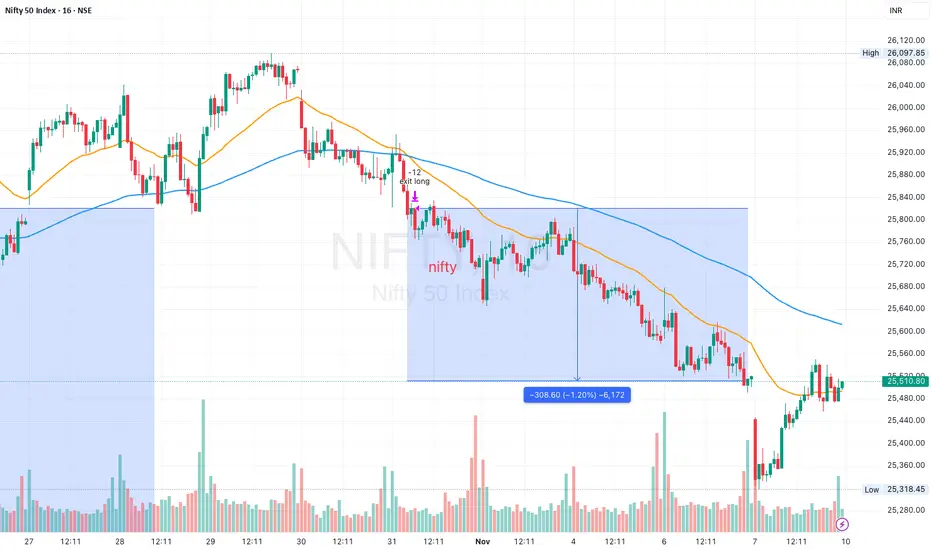
07 Nov 2025–308pts profits and counting on the Nifty short tradeNifty Stance Bearish 🐻
We went short on Nifty last Friday, and this complete week, we have had a decent one-way fall. So far, we have fallen 308pts, and it looks like more shorts could enter the system even if we remain flattish over the next two days. There was a holiday in between, but it did not affect the markets, and the journey has been one-sided so far this week.
One interesting technical data point is the first candle of today, when we fell to 25318, and from there we saw an intraday recovery of 234+ pts. We might have ended the day in green, but for the lack of momentum in the last hour of trade.
My nearest support levels are at 25219 and 25003, and I was really surprised to see markets take a U-turn at 25318. The closest resistance is at 25681, followed by 25906.
Nifty 50 Price Action Analysis & Trade IdeaNifty 50 Price Action Analysis & Trade Idea
The current Nifty 50 15-minute chart depicts consolidation after a sharp drop and a subsequent bullish recovery. Key levels are indicated with daily open, high, low, close, and structural resistance.
#### Technical Analysis
- Price attempted to reclaim the previous day's close (Pdc: 25,510.80) and found resistance near the previous day’s high (PdH: 25,551.25).
- Strong buying emerged from the previous day’s low (PdL: 25,318.45), showing rejection and a bullish impulse from the support zone.
- Price remains range-bound between 25,443.15 (PdO) and 25,551.25 (PdH), with momentum favoring a bullish breakout above the PdH for continuation.
#### Trade Plan
| Trade Setup | Entry | Stop Loss | Target | Rationale |
|-------------|------------------|--------------|----------------|-----------------------------------------|
| Long | 25,555 (Above PdH) | 25,510 (Below PdC) | 25,679 (Next resistance) | Bullish momentum above resistance; upside continuation |
| Short | 25,440 (Below PdO) | 25,485 (Above PdO) | 25,318 (PdL support) | Rejection from resistance; downside movement to prior demand |
#### Trade Management
- If entering long above 25,555, watch for sustained volume and momentum confirmation; reduce risk if price fails to close above PdH.
- If short below 25,440, monitor for rapid rejection back above PdO to exit quickly.
***
**Summary:**
Nifty 50 has formed a clear price action range following strong support and resistance tests. A breakout above PdH opens up the next resistance, while breakdown below PdO targets previous demand.
**Levels:** Entry: 25,555 | Stop loss: 25,510 | Target: 25,679
Risk management and patience are key – let the price confirm direction above/below the marked levels before execution.

Banks Ready for Next Rally — Nifty Needs to Confirm Itself NSE:NIFTY bounced exactly from our support at 25335, which I mentioned in the last commentary.
At first glance, it looks like a solid recovery, but internally, the momentum still feels weak as the index failed to close above the previous day’s close.
So we need a follow-up move tomorrow to confirm whether this bounce can actually sustain.
For now, I’ll stay sideways until the market confirms its direction.
I’ll be watching the 25550 resistance closely. Only if the market gives a strong close above this level will I consider going long on the index, because above 25550 we could see sharp short covering straight toward 25800.
Support remains at 25335. A drop below this could go very wrong — a fall toward 24700–24600 would then be possible.
NSE:BANKNIFTY , on the other hand, looks much better. Both its intraday and daily structures are bullish, clearly showing that banks may lead the next rally.
It has strong support at 57350 and resistance at 58250. If this support holds through the week, we might see 60300 levels very soon.
Many sector-specific stocks are showing good momentum setups that could perform well next week. Still, treat those bounces as profit-booking opportunities, not long-term holds. We’ll get better setups ahead.
You can trade confidently, but make sure to lock in your profits.
Sector-wise, NSE:CNXFINANCE , NSE:CNXMETAL , and NSE:CNXAUTO Parts stocks look strong for swing trades.
That’s all for the day. Take care and have a profitable week ahead.
📊Levels at a glance:
Nifty Support: 25335 (break = 24700–24600)
Nifty Resistance: 25550 (break = short covering to 25800)
BankNifty Support: 57350
BankNifty Resistance: 58250 (above = rally to 60300)
Bias: Sideways till confirmation
Sectors to watch: Financials, Metals, Auto Parts
Strategy: Trade swings, book profits on bounces
Nifty - Weekly review Nov 10 to Nov 14Last week, the price fall down gradually. Friday took support at the 25280 - 25320 support zone.
Now the price has to sustain above the 25500 zone to move up. 25700 - 25720 can act as a resistance.
The daily chart also shows a similar support/resistance zone.
Buy above 25520 with the stop loss of 25470 for the targets 25560, 25600, 25660, 25720, 25760 and 25820. This is work if the price shows bullish strength at 25500.
Sell below 25400 with the stop loss of 25450 for the targets 25360, 25320, 25260, 25220 and 25160. This will work if the price shows bearish strength around the 25500 zone.
Always do your analysis before taking any trade.

Chart Patterns Risks Involved
Time Decay: Option value decreases as expiry nears.
Volatility Risk: Rapid volatility changes can affect premiums.
Unlimited Loss for Writers: Option sellers face theoretically unlimited loss potential.
Complexity: Requires strong understanding of pricing and market movement.

NIFTY 50There's a high possibility, NIFTY could test below white line or 24770 within 17th Nov 2025 .
Disclaimer:
It's a personal view not a financial advice and I assume no responsibility and liability whatever outcome arises.

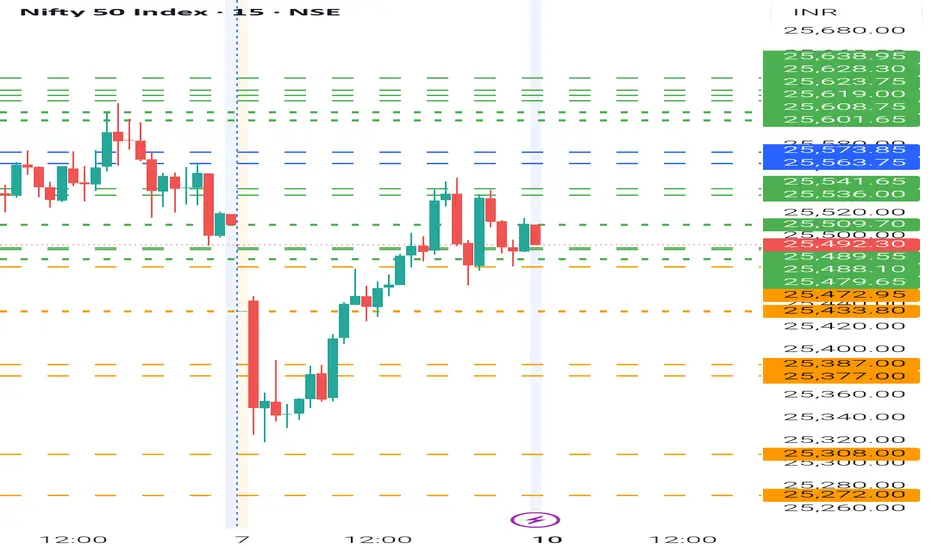
NIFTY- Intraday Levels - 10th November 2025If NIFTY sustain above 25509 above this bullish then around 25536/41 strong level then 25563/73 then 25601/08 or 25619/38 then above this more bullish above this wait
If NIFTY sustain below 25489/79/72 below this bearish then around 25433/25387/77 big range but a strong level below this more bearish then around 25308/25272 last hope then below this wait
My view :-
"My viewpoint, offered purely for analytical consideration, is that the market will exhibit volatility with movement in both directions . The trading thesis is: Nifty (bullish tactical approach: buy on dip ) and Bank Nifty (bearish tactical approach: sell on rise ). This analysis is highly speculative and is not guaranteed to be accurate; therefore, the implementation of stringent risk controls is non-negotiable for mitigating trade risk."
Consider some buffer points in above levels.
Please do your due diligence before trading or investment.
**Disclaimer -
I am not a SEBI registered analyst or advisor. I does not represent or endorse the accuracy or reliability of any information, conversation, or content. Stock trading is inherently risky and the users agree to assume complete and full responsibility for the outcomes of all trading decisions that they make, including but not limited to loss of capital. None of these communications should be construed as an offer to buy or sell securities, nor advice to do so. The users understands and acknowledges that there is a very high risk involved in trading securities. By using this information, the user agrees that use of this information is entirely at their own risk.
Thank you.
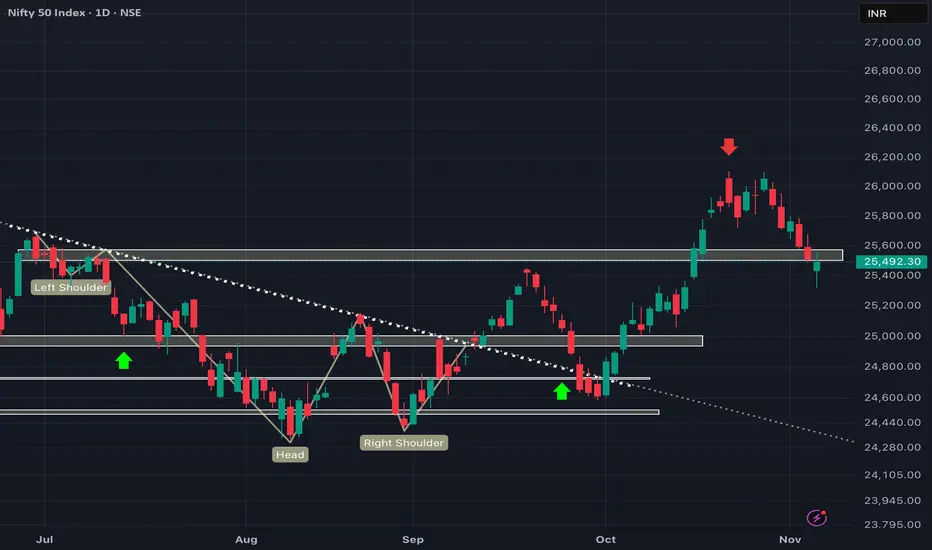
Monthly analysis for Nifty: 09/11/25I tried to make it as elaborate as I could to give a clear picture of the Nifty trend in November. If there is any doubt or question, you can drop in the comment section.
Right now, it is in between the zone of cluster of support/resistance

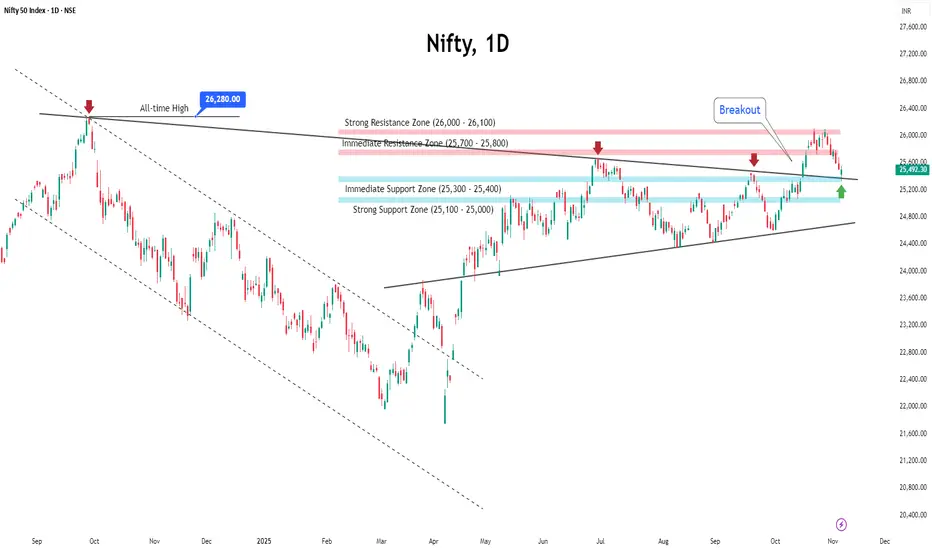
Nifty Slips for 2nd Week: Consolidation Ahead amid Rising VIXIndian markets ended lower for the second straight week, weighed down by persistent foreign fund outflows, mixed corporate earnings, and cautious global cues.
Nifty slipped nearly 0.8% to close at 25,490, while India VIX rose over 3% to 12.55, reflecting a slight uptick in market volatility.
Key Levels to Watch
Nifty is currently retesting the apex of its ascending triangle breakout, around the 25,300–25,400 zone. This area is supported by significant put writing, as reflected in recent open interest data, making it an important near-term support.
Below this, the next strong support lies near 25,000.
On the upside, the 25,700–25,800 zone could act as an immediate resistance due to heavy call writing, while 26,000 remains a major resistance level to watch.
Outlook
Given the current setup, markets are likely to trade within a neutral range in the coming week. Volatility may stay elevated as global uncertainties, FII outflows, and a busy flow of economic and earnings data continue to influence sentiment.
While near-term sentiment remains cautious, strong domestic macro fundamentals and steady corporate performance are expected to provide underlying support to the broader trend.
Traders are advised to stay stock-specific, focusing on banking and financials—particularly PSU banks—which continue to display relative strength.
#Nifty Weekly 10-11-25 to 14-11-25#Nifty Weekly 10-11-25 to 14-11-25
25200-25300 is major support for next week.
If Nifty form W pattern near support and sustains above 25550, Long for the targets of 25780/26000.
Shor level is only below 25000.
View: Bullish to Sideways

Nifty all levels works perfectly upmove will come next weekNifty updated levels given, next week we can see bounce 25250-25300 buying zone
25750,-25830 target.
How My Harmonic pattern projection Indicator work is explained below :
Recent High or Low :
D-0% is our recent low or high
Profit booking zone ( Early / Risky entry) : D 13.2% -D 16.1 % is
range if break them profit booking start on uptrend or downtrend but only profit booking, trend not changed
SL reversal zone (Safe entry ) : SL 23.1% and SL 25.5% is reversal zone if break then trend reverse and we can take reverse trade
Target : T1, T2, T3, T4 and .
Are our Target zone
Any Upside or downside level will activate only if break 1st level then 2nd will be active if break 2nd then 3rd will be active.
Total we have 7 important level which are support and resistance area
Until , 16% not break uptrend will continue if break then profit booking will start.
If break 25% then fresh downtrend will start then T1, T2,T3 will activate
1,3,5,10,15,20 minutes are short term levels.
30 minutes 60 minutes , 2 hours,3 hours, ... 1 day and 1 week chart positional and long term levels

Premium Charts Tips for Successful Option Trading
Master the basics before applying advanced strategies.
Analyze market trends, OI data, and IV regularly.
Use proper risk management—never risk more than 1–2% of capital per trade.
Avoid trading near major events (earnings, RBI policy) unless experienced.
Keep learning through backtesting and continuous strategy refinement.

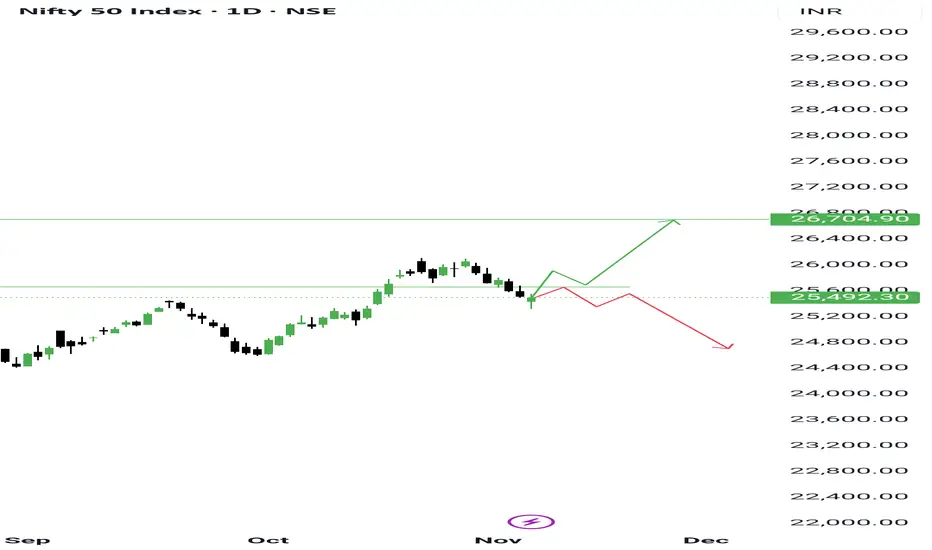
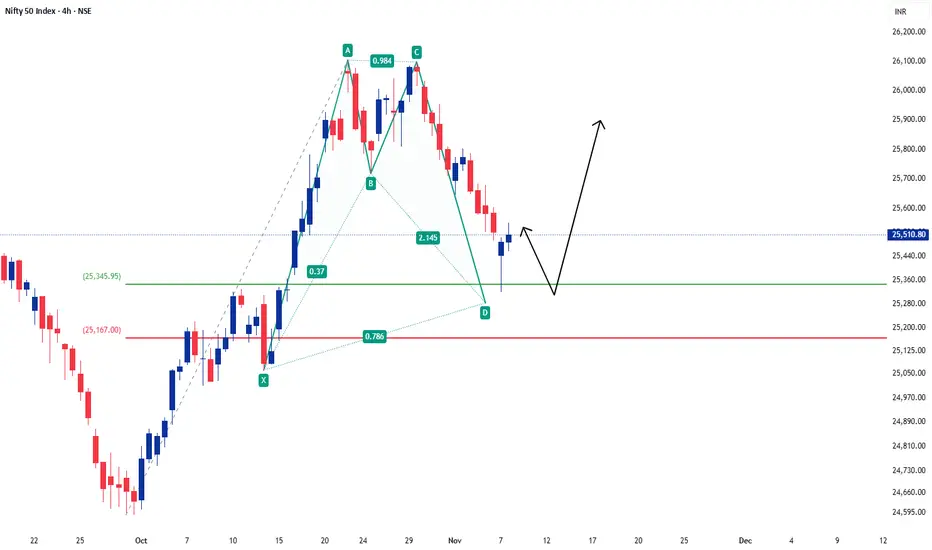
NIFTY at a Crucial Zone - BIG MOVE COMINGNifty is standing at a crucial support zone, and the next few days will determine whether the market begins a fresh rally or breaks down for a deeper decline.
At present, Nifty has taken support near 25320–25380.
This area is critical for three reasons:
Gap Support: There was a gap on the charts near 25320 from earlier trading sessions. That gap is now filled and is acting as a support level.
Trendline Retest: This same zone also touches the long-term trendline that Nifty broke earlier. Retesting that trendline is a common technical behaviour before the next big move.
50% Fibonacci Retracement: If we measure the recent rally from 24600 to 26100, then the 50% retracement level also comes exactly around 25,350. This means the market has corrected half of its move and is now testing buyers' strength.
So, this area between 25320–25380 is a major support zone where buyers are expected to defend the market.
Current Market Behaviour
For the last few sessions, Nifty has been falling, but it is still holding this support.
If the market takes support here and starts going up, it can trigger short covering.
Many short traders are keeping their stop loss near the previous candle highs, which are around 25550.
If Nifty breaks above 25550, these stop losses will get hit, and that can lead to a sharp rally due to short covering.
Upside View (If Nifty Moves Up)
If Nifty crosses 25550 and sustains above it, we can expect a good upside move:
First target: 26470 – 26500
Next target: 26900
This move can happen quickly because short sellers will exit their positions and buyers will enter aggressively.
Downside View (If Support Fails)
If Nifty breaks below 25320 and closes below it:
Next support is near 24600, but this level has already been tested earlier, so it has become a weak support now.
If 24600 also breaks, the next possible target is 24000.
This will mean that the market has entered a deeper correction phase.
Volatility & India VIX
Right now, India VIX is around 12.55, and it is slowly moving up.
This increase in VIX means uncertainty is rising, which usually supports a downside or volatile market.
If VIX cools down near 11, it will show that fear is reducing, and the market can again aim for new highs.
But if VIX keeps rising toward 15, expect more pressure and a possible fall.
Final View
Nifty is at a point where either fresh buying starts or the market breaks down.
All major indicators (trendline, gap, Fibonacci, and previous support) are pointing to this being a decisive zone.
Traders should watch 25320 on the downside and 25550 on the upside - whichever breaks first will set the next trend.
Stay patient and avoid emotional trades here - this is where big moves begin.
