Nifty 50 Weekly Chart- Long-term bullish, short-term correctiveNifty 50 Weekly Chart – Inshort Summary
Trend: Long-term bullish, short-term corrective.
Immediate Support: ₹24,347 – ₹24,395
Key Supports Below: ₹23,141 · ₹22,676 · ₹21,137
Resistance Levels: ₹24,694 · ₹24,811 · ₹25,317 · ₹25,661
Fibonacci Zone: Strong retracement support between ₹23,100 – ₹22,600
Outlook: Possible dip toward ₹22,600–₹23,100, then rebound to ₹25,500+ if support holds.
Disclaimer -
I am not a SEBI-registered analyst or investment advisor. The views, charts, and trading ideas shared are purely for educational and informational purposes only. These do not constitute investment advice or a recommendation to buy/sell any securities. Please consult your SEBI-registered financial advisor before making any investment decisions. Trading and investing involve substantial risk — do your own research (DYOR).
INDIA50CFD trade ideas

Nifty Technical Analysis-Bearish Divergence Nifty Technical Analysis (Daily Timeframe):
🔺 Bearish Divergence (Negative Divergence):
The chart clearly shows:
Nifty made a Higher High
But MACD made a Lower High
This is a Bearish Divergence, which indicates that momentum is weakening even though the price is rising.
Ichimoku Cloud Analysis:
The price is trying to close below the Ichimoku Cloud, which is a Bearish Signal.
Both Tenkan-sen (red) and Kijun-sen (blue) lines are pointing downward.
The future cloud is also turning slightly bearish.
MACD Analysis:
Both the MACD line and the Signal line are turning downward.
The MACD histogram is also in negative territory.
The earlier divergence is now weakening, suggesting that strong selling momentum may be building.
Trading Idea (Bearish Positional Setup):
🔻 Sell / Short Trade Setup:
Sell Entry:
Below ₹24,400 or after a confirmed breakdown below the Ichimoku Cloud
Target 1: ₹24,000
Target 2: ₹23,500
Stop Loss (SL): ₹24,850 (above the Ichimoku Cloud)
🛑 Risk Management Tip:
MACD is already bearish, and divergence has occurred.
If the broader market weakens further, sharper downside is likely.
Be careful with position sizing due to expected volatility.
📌 Summary:
The combination of Bearish Divergence + Ichimoku Cloud Breakdown + Bearish MACD =
✔️ A good positional Sell Setup for traders.

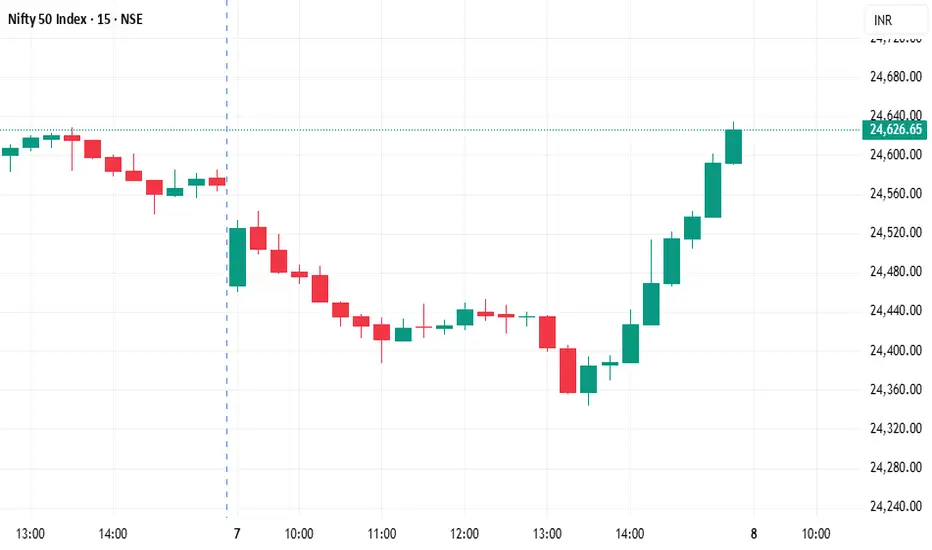
Nifty bullish momentum ahead - target 24955Nifty is showing bullish momentum — buyers are currently in control, and the trend suggests the index could move higher in the short term. A sustained move above key resistance levels with strong volumes can push it toward higher targets.
Target 24955

Nifty 8 August 2025 ( Fake Upmove ) ?Today also i will find short setup for 100 points. As it might be a only short covering move and it can give a downside trade today because the sentiments are not good as of now.
Trade plan ( bearish biased )

NIFTY: BULL or BEAR? 08-AUG-2025LTP 24555
Support: 24334
Resistances: 24634/25677
As long as 24334 holds support, we can see 24655 first.
Further targets: 24850, 25003, 144, 277, 377, 25516
MY VIEW: BUY ON DIPS.

NIFTY Analysis 8 AUGUST, 2025 ,Morning update at 9 amNifty may open flat to negative near 24574 and may move in a range between 24548 and 24652 to consolidate.
Watch if a Bn pattern forms around 24620 on the 5 minute chart — in that case, Nifty may short cover towards 24670 and 24746
If Nifty is unable to sustain above 24548, it may slip towards 24496 and move sideways.
Always wait for a clear breakout before taking a position — the share market is totally mathematics-based, not a game of chance or luck.
Support & Resistance
Support Levels
24496 (S1)
24410 (S2)
24320 (S3)
Resistance Levels
24670 (R1)
24746 (R2)
24862 (R3)

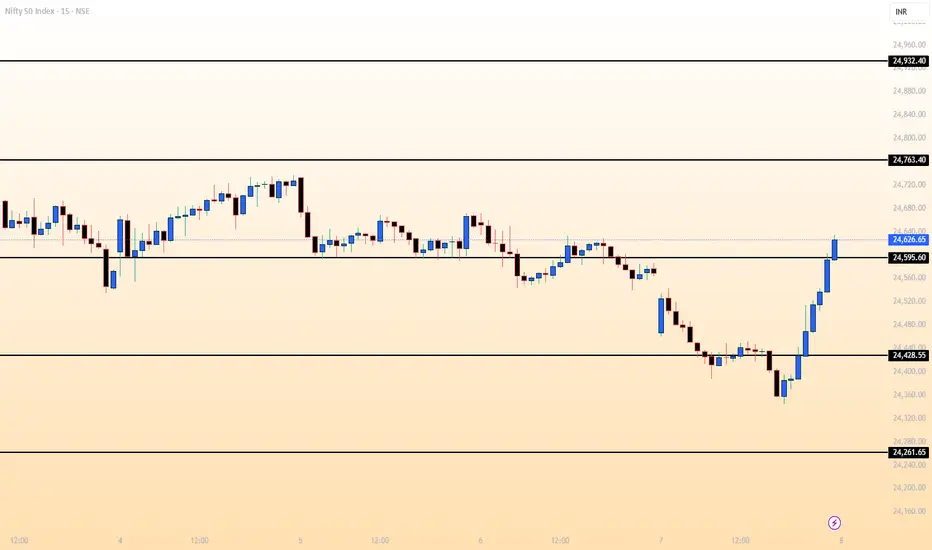
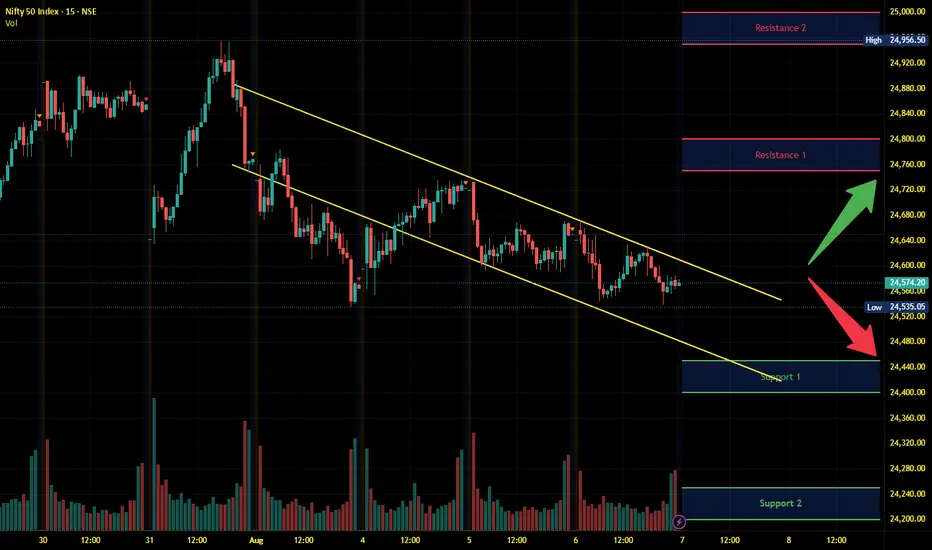
#NIFTY Intraday Support and Resistance Levels - 08/08/2025Nifty is expected to open slightly gap up, indicating a positive start to the session. If the index sustains above the 24,550–24,600 zone, it could extend its upside toward 24,650, 24,700, and 24,750+. On the other hand, a rejection from higher levels, particularly near 24,750–24,700, could trigger a pullback toward 24,650, 24,600, and 24,550-.
A breakdown below 24,500 may invite further weakness, with downside targets at 24,350, 24,300, and 24,250-. Price action near the 24,550–24,600 support-turned-pivot zone will be key for intraday momentum. Traders should maintain strict stop-losses and consider partial profit booking at each milestone level.

NIFTY Levels for TodayHere are the today's NIFTY Levels for intraday (in the image below). Based on market movement, these levels can act as support, resistance or both.
Please consider these levels only if there is movement in index and 15m candle sustains at the given levels. The SL (Stop loss) for each BUY trade should be the previous RED candle below the given level. Similarly, the SL (Stop loss) for each SELL trade should be the previous GREEN candle above the given level.
Note: This idea and these levels are only for learning and educational purpose.
Your likes and boosts gives us motivation for continued learning and support.
NIFTY MATHEMATICAL LEVELS FOR EXPIRYThese Levels are based on purely mathematical calculations.
Validity of levels are upto expiry of current week.
How to use these levels :-
* Mark these levels on your chart.
* Safe players Can use 15 min Time Frame
* Risky Traders Can use 5 min. Time Frame
* When Candle give Breakout / Breakdown to any level we have to enter with High/Low of that breaking candle.
* Targets will be another level marked on chart
* Stop Loss will be Low/High of that Breaking Candle.
* Trail your SL with every candle.
* Avoid Big Candles as SL will be high then.
* This is one of the Best Risk Reward Setup.
For Educational purpose only
Nifty strategy for 8/8/25Nifty may open around 24550 levels on negative bias as per SGX NIFTY. In yesterday nifty was dragged since opening levels upto afternoon but market snapped all losses and turnaround to positive and closed positively which is indicates bulls are entered into market at lower levels. The nifty managed to closed above its crucial support level i. e. 24400 levels if market closed once decisively below these levels nifty may fallen upto 23800 levels. So investors trade cautiously at support and resistance levels.
Support levels : 24540,24436
Resistance levels : 24657,24713
Stock of the day : TORNT POWER in this stock a bullish candle was formed after a bullish engulfing pattern which is indicated buying momentum in this stock so i advised to investors trade this stock with strict stop losses.
Buy price : 1340
Tgt price : 1400
Stop loss : 1310
Disclimer : I AM NOT A SEBI RESEARCH ANALYST OR FINANCIAL ADVISOR, these recommendations are only for education purpose, not for trading and investment purpose please take an advise from your financial advisor before investing on my recommendations.
🙏 : If you liked my content please suggest to your friends follow my trading channel. Your likes and comments provide boosting to me to update more financial information.
Thanking you to support me
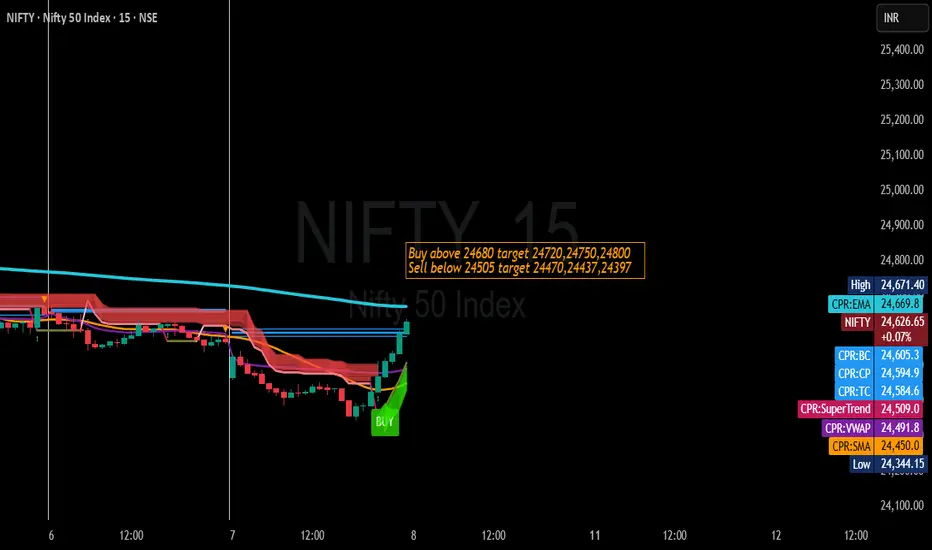
Nifty Trading Strategy for 08th August 2025📊 Nifty Intraday Trading Plan – 15-Minute Timeframe
Instrument: Nifty 50 Index (Spot or Futures)
Analysis Basis: 15-minute candlestick chart
Method: Breakout strategy based on candle close above/below key price levels
🟢 Buy Setup – Bullish Breakout
✅ Entry Conditions:
Wait for a full 15-minute candle to close above 24,680.
Ensure the candle body is clearly above the level, not just a wick.
Place your buy order above the high of that confirmed breakout candle to avoid false breakouts.
💵 Entry Price: Above breakout candle high if it closes above 24,680
🎯 Profit Targets:
Target 1: 24,720 (Immediate short-term resistance)
Target 2: 24,750 (Intermediate resistance zone)
Target 3: 24,800 (Major resistance for the session)
🛑 Stop Loss:
Conservative: Just below 24,680 breakout level.
Aggressive: Below the breakout candle’s low.
📌 Trade Management:
Once Target 1 is hit, move stop loss to breakeven.
Book partial profits at each target and let the rest ride with a trailing stop.
🔴 Sell Setup – Bearish Breakdown
✅ Entry Conditions:
Wait for a full 15-minute candle to close below 24,505.
Ensure the candle body is clearly below the level, showing strong selling pressure.
Place your sell order below the low of that breakdown candle for confirmation.
💵 Entry Price: Below breakdown candle low if it closes below 24,505
🎯 Profit Targets:
Target 1: 24,470 (Immediate short-term support)
Target 2: 24,437 (Intermediate support zone)
Target 3: 24,397 (Major support for the session)
🛑 Stop Loss:
Conservative: Just above 24,505 breakdown level.
Aggressive: Above the breakdown candle’s high.
📌 Trade Management:
Once Target 1 is achieved, move stop loss to breakeven.
Scale out profits at each target to reduce risk.
📌 Risk Management Notes
Risk only 1–2% of your total capital per trade.
Avoid trading during high-volatility news events unless planned.
Monitor slippage and spreads, especially near market open or news times.
Stick to your stop loss and avoid averaging into losing trades.
📌 Example Trade Scenarios
Bullish Example:
15-min candle closes at 24,683 with a high of 24,686 and a low of 24,672.
Buy stop at 24,687, stop loss at 24,671, first target 24,720.
Bearish Example:
15-min candle closes at 24,502 with a high of 24,508 and a low of 24,498.
Sell stop at 24,497, stop loss at 24,509, first target 24,470.
⚠️ Disclaimer
I am not SEBI registered. This content is for educational purposes only and should not be considered financial advice or a recommendation to trade. Trading in the stock market involves substantial risk and may result in losses greater than your initial investment. Always do your own analysis and, if necessary, consult a SEBI-registered investment advisor before making trading decisions.
SIGNS OF REVERSAL!!?As we can see despite the break of psychological level and important support, we saw a strong closing with strong closing and has closed inside the structure which completely changes the sentiment. Hence from here unless and until 24400 is broken and sustained below, every rise can be bought. so, plan your trades accordingly and keep watching everyone.

His Strategy Had 80% Accuracy… But His Mind Had 0% Trust!Hello Traders!
Today, I want to share a short story, not about charts, but about what goes on between the ears of every trader: the mind.
There was a trader named Arjun.
He backtested a strategy for months.
It gave an average of 80% win rate with a proper risk-reward setup.
But despite this, every time he placed a trade, he’d panic and exit early.
If price moved slightly against him, he’d cut the trade.
Even after making money for weeks, he feared losses so much, he couldn’t sit tight.
Why?
Because Arjun didn’t trust himself.
He trusted the setup, on paper. But not in live market.
Here’s what this teaches us:
Even the best strategy is useless if your mindset is not stable.
Without trust in your own system, you'll keep sabotaging your results.
Market will always test your patience.
You can’t expect every candle to go in your direction. If you don’t train your emotions, you'll exit too soon.
Confidence comes from repetition + reflection.
Each time you follow the setup without breaking rules, your self-trust grows.
Journaling helps rebuild confidence.
Arjun started writing down his thoughts after every trade, and slowly, he saw the patterns of fear and how to fix them.
No one lacks discipline, they lack belief.
If you truly believed in your system, you'd follow it. Lack of trust = lack of execution.
Rahul’s Tip
Don’t look for the perfect strategy.
Look for a simple one, and focus on executing it flawlessly.
Discipline doesn’t come from forcing yourself.
It comes from knowing: "Even if this trade fails, I followed the plan, and that’s a win."
Conclusion
Your results are not just about price action, they’re about mind action.
If you feel your system works, but you still keep breaking rules, the issue is not the strategy. It’s time to work on belief.
Which part of your mindset do you need to upgrade? Share below, let's grow together.
If this story made sense to you,
like, follow, or drop a comment, I post this kind of real talk often.
Nifty - Closed with a phenomenal recovery. What's next?Nifty closed in green today. Thanks to the spectacular last hour move. Does this move say something for the future trend? Watch the video to know.

NIFTYThe momentum slope of the chart changes constantly over time, So it is always not possible to find the next support using simple trend lines.
So it may be a better idea to use curved lines instead of straight lines.

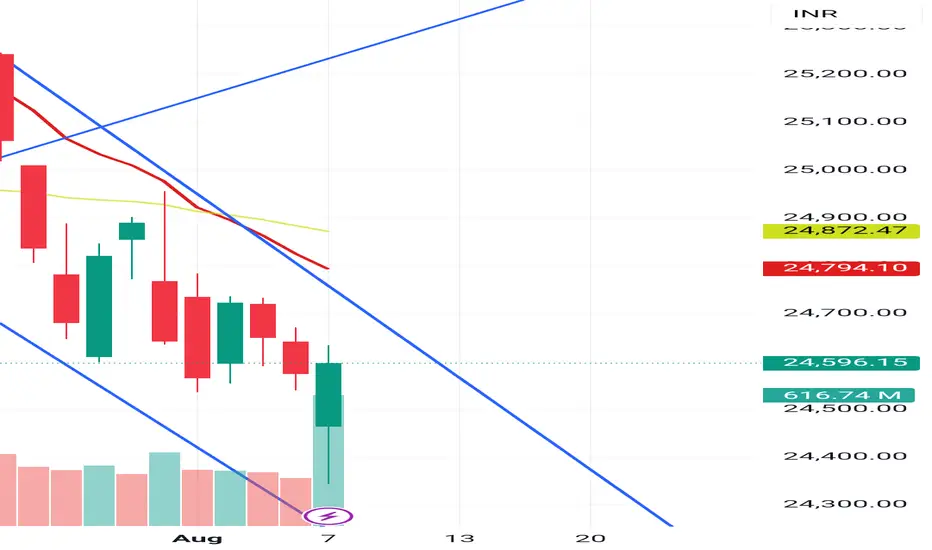
Corrective Rise UpNifty seems to completed the formation of the corrective down pattern which was a Diametric formation.
From here we could expect an up move to take place, which will most likely be a corrective rise too.
The first warning that the downside it still in progress will be price entering the range of around 24290 and a break below the level of 23900 will confirm that this wave was just the starting of a larger correction
Happy Trading!!
Nifty Intraday Analysis for 07th August 2025NSE:NIFTY
Index has resistance near 24750 – 24800 range and if index crosses and sustains above this level then may reach near 24950 – 25000 range.
Nifty has immediate support near 24450 – 24400 range and if this support is broken then index may tank near 24250 – 24200 range.
Volatility expected due to probable tariff escalation from the US President on imports from India.
Nifty Bear Put Spread Strategy - Bullish viewView - Bullish.
buy Nifty 24200 PE – AT CMP
Sell Nifty 24500 PE – AT CMP
premium collected - 132 (sell) , 45 (buy)
Target 2000 rs per lot.

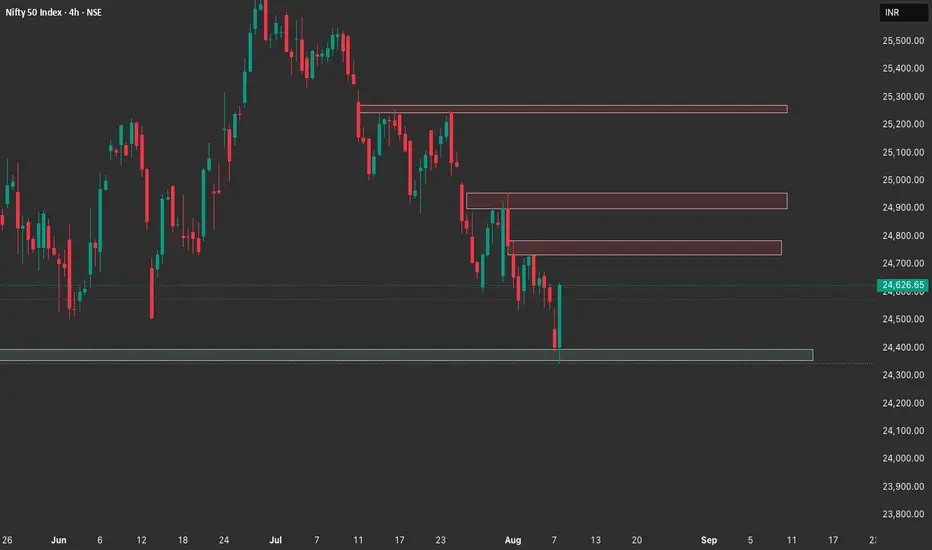
Nifty Market Structure & Trade Plan: 8th August📊 Nifty 50 – Market Structure Analysis
⏱️ 4H Timeframe
Market Structure: Price printed a strong bullish engulfing candle from the higher demand zone (around 24,370).
Current Status: Still in a lower high - lower low structure, but this strong reversal suggests a potential short-term pullback.
Supply Zones:
24,780–24,900
24,950–25,250
⏱️ 1H Timeframe
Market Structure: Clean BOS (Break of Structure) on the upside. Price has taken out recent highs.
Current Trend: Short-term bullish within a broader downtrend. Approaching supply zone.
Liquidity: Just tapped into old liquidity pockets, creating a reaction-worthy setup.
⏱️ 15-Min Timeframe
Market Structure: Sharp vertical rally from demand without much consolidation. Now entering minor supply around 24,650–24,700.
FVG/OB: Small fair value gaps left below; likely to be filled if price weakens.
📌 Trade Plan for 8th August (Nifty 50)
🎯 Bias: Neutral to Mildly Bullish (as long as 24,430 is protected)
Reversal observed, but continuation depends on how price reacts to the 24,700–24,800 supply zone.
🔻 Short Setup (High Probability if rejection seen at supply)
Entry Zone: 24,720–24,780
Stop Loss: Above 24,820
Targets:
T1: 24,580
T2: 24,480
T3: 24,370 (if full rejection)
🔼 Long Setup (Only on Retest + Bullish Candle)
Entry Zone: 24,500–24,530 (retest of breakout zone)
Stop Loss: Below 24,440
Targets:
T1: 24,700
T2: 24,780
⚠️ Avoid fresh longs if price opens near or inside supply zones without a proper dip.
🚫 No Trade Zones – Nifty 50 (8th August)
These are the zones where:
There is low RR (Risk-Reward)
Price is likely to consolidate or chop
Better to wait for confirmation or breakout
⛔ Zone 1: 24,600 – 24,680
Price has rallied straight into this zone from demand.
Minor supply sits just above, while momentum from the rally may exhaust.
Wait for either: rejection to short , a clean breakout and retest to go long.
⛔ Zone 2: 24,480 – 24,530
This is the midpoint of today’s rally — price could consolidate here.
No clear long or short signal unless strong reaction occurs.
Action: Stay flat in these zones unless there’s a clear BOS, rejection wick, or liquidity sweep with reversal.
Part12 Trading MasterclassIntroduction to Options Trading
Options trading is one of the most powerful tools in financial markets. Unlike traditional stock trading, where you buy and sell shares directly, options give you the right but not the obligation to buy or sell an asset at a predetermined price before a specific date. This flexibility allows traders to hedge risks, generate income, and speculate on price movements with limited capital.
In recent years, options trading has seen a surge in popularity, especially among retail investors. With the growth of online trading platforms and educational resources, more traders are exploring this complex yet rewarding field.
What Is an Option?
An option is a financial derivative contract. It derives its value from an underlying asset—commonly a stock, index, ETF, or commodity.
There are two types of options:
Call Option: Gives the holder the right to buy the asset at a fixed price (strike price) before or on the expiry date.
Put Option: Gives the holder the right to sell the asset at a fixed price before or on the expiry date.
Key Terms to Know:
Strike Price: The price at which the option can be exercised.
Premium: The price paid to purchase the option.
Expiration Date: The last date on which the option can be exercised.
Underlying Asset: The financial instrument (like a stock) the option is based on.
In the Money (ITM): When exercising the option would be profitable.
Out of the Money (OTM): When exercising the option would not be profitable.
At the Money (ATM): When the strike price is equal to the market price.

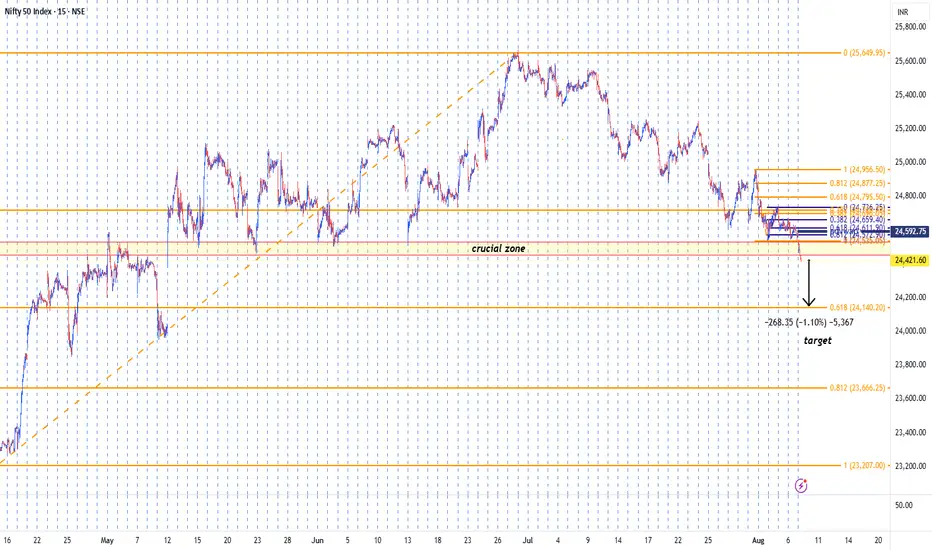
Nifty targetbased on crucial zone break + fibo extention theory
marked target in above chart
#nifty #sankhyainvestment #niftytarget
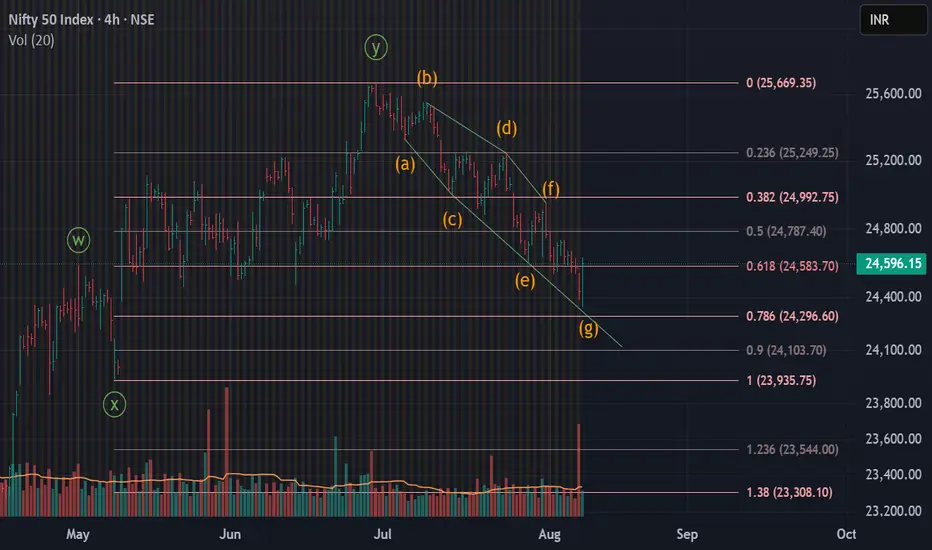
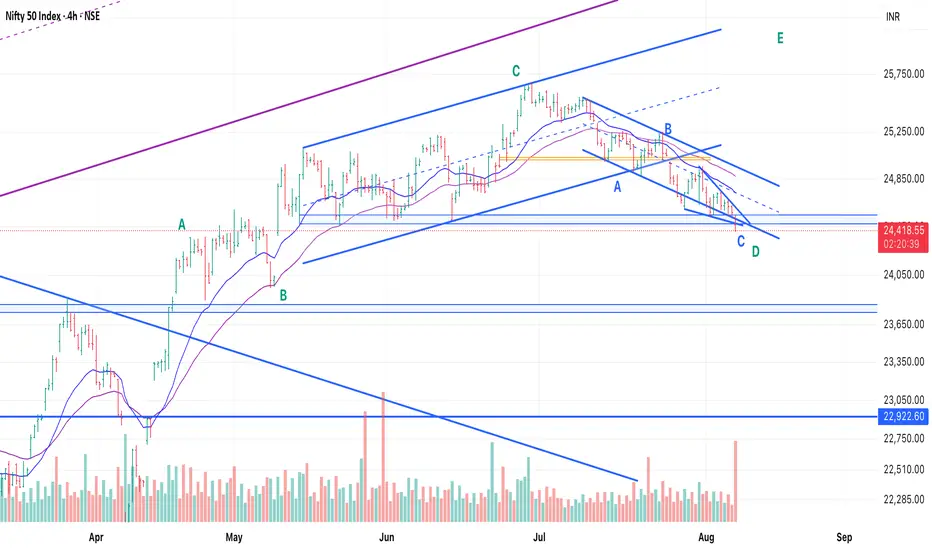
Nifty - Elliot Waves Counts - LongLooking for bottom everyday, as broader markets indicating one more high.
Aligning Nifty counts with broader markets - We have an ABC with C ending in an ED - If it has to turn and head up to another high, this is the time.
Wait for one green day for confirmation.
Level at which view goes wrong - If 24320 breaks on the downside.
All the best!
Nifty 50 Analysis – Key Support Zone HoldsThe Nifty 50 Index is currently testing a critical support zone near the 24,450–24,500 level, which has historically acted as a strong base for multiple reversals. As visible on the chart, price action has formed a series of lower highs and lower lows, but recent candles show buyer defense around this support, hinting at a potential bottom formation.
Structure Breakdown
Over the past few sessions, Nifty has been in a short-term downtrend, trading consistently below the 200 EMA, which confirms the bearish pressure. However, price is now at a make-or-break support level, which has been respected multiple times over the past two months.
A potential W-shaped bottom pattern (double bottom or inverse head & shoulders-like) seems to be forming, which could signal a bullish reversal if the neckline (near 24,850–24,900) breaks convincingly.
Bullish Possibility
If the support holds and price breaks above 24,900, we may see a trend reversal or at least a relief rally. The possible upside targets include:
First Target: 25,100
Second Target: 25,350
Swing Target: 25,600+
The move may be sharp if shorts start covering and fresh buying enters on confirmation. A successful reclaim of the 200 EMA will strengthen the bullish structure.
Bearish Breakdown Possibility
On the flip side, if price fails to hold above 24,450 and we get a candle close below this zone, the bullish reversal setup will get invalidated. This could open room for:
Downside Target 1: 24,200
Downside Target 2: 23,950
Extended Target: 23,700 zone (last swing low)
In this scenario, bears regain full control, and the overall downtrend from July could continue deeper.
Risk Factors for Both Sides
News Event Risk: Any macroeconomic event (like inflation data, RBI policy changes, or geopolitical developments) could trigger volatility and invalidate patterns.
False Breakouts: Watch for fake moves above resistance or below support. Always wait for confirmation candle close.
Gap Open Risk: Overnight global market moves can trigger gap-ups/downs, skipping stop-losses.
Trader Suggestions
- Wait for confirmation before entering long above 24,900 or short below 24,450.
- Use tight stop losses as volatility near key levels can result in whipsaws.
- Avoid heavy positions in this uncertain phase unless breakout or breakdown confirms.
- Keep watching for volume and price momentum for signs of real conviction.
- Option traders may explore straddle/strangle near this tight range, if expecting a sharp move.
Final Word
Nifty is at a crucial turning point. The support zone has worked like a wall so far—but whether it leads to a reversal rally or a breakdown will depend on how price reacts in the next 1–2 sessions. Trade with a clear plan, and adapt quickly based on market behavior.
