Bullish Iron Condor on Nifty (30th September 2025 expiry)Hello Traders!
Just like we shared the August Iron Condor setup, here comes the fresh plan for September expiry.
Nifty is trading around 24,840 and we are witnessing a defined range between 23,750 – 25,500.
Such ranges are perfect for premium eating strategies like the Iron Condor, where time decay works in our favour as long as the index stays inside the zone.
So here’s the September plan:
Position Details
Sell 2 lots 24,700 PE @ 140.30
Buy 2 lots 24,400 PE @ 71.60
Sell 2 lots 25,500 CE @ 53.95
Buy 2 lots 25,750 CE @ 22.95
We expect Nifty to consolidate between 23,750 – 25,500 as per our technical chart analysis .
200-DEMA is acting as dynamic support
Strong resistance capped near 25,500 – 26,270
Until a breakout happens on either side, premium sellers can stay in control
This Iron Condor gives us a balanced risk-reward setup and benefits from time decay while keeping risk well-defined.
Why I Like This Setup:
Limited loss , defined by hedge positions
High probability of success as long as Nifty remains in the range
Best suited for traders focusing on consistent income from option writing
Rahul’s Tip 👉 Discipline in trade management is always more important than the setup itself.
For income-based option strategies, always check for:
Key events and news (policy, RBI, FED, budgets, etc.)
Breakout signals beyond short strikes
Quick exit or adjustment if market moves out of range
Disclaimer This post is for educational purposes only . Please manage your risk and position sizing wisely.
Avoid large quantities at once – it’s always better to scale in gradually once the range confirms.
Trade ideas

Daily updates for Nifty50: 30/09/2025Between the chaos of bulls/bears at the current level of Nifty, there is a slight divergence for a back in the prices.
Nevertheless, I'm bearish for this unless prices are trading below 24805. I am bearish till the trendline that I shared yesterday.
Buying on the intraday level will be on rejection of 24628, which is 78.6% fib retracement.
Any swing trade will be on the rejection of the trendline at around 24530sh range

Nifty As per the chart pattern, 24500-24550 is very crucial support zone. Bearish move will persist if Nifty closes below 24500. Next 2-3 days we need to watch carefully. If it reverse from this zone, strong bull case scenario will be there. Trigger point will be RBI policy and earning season

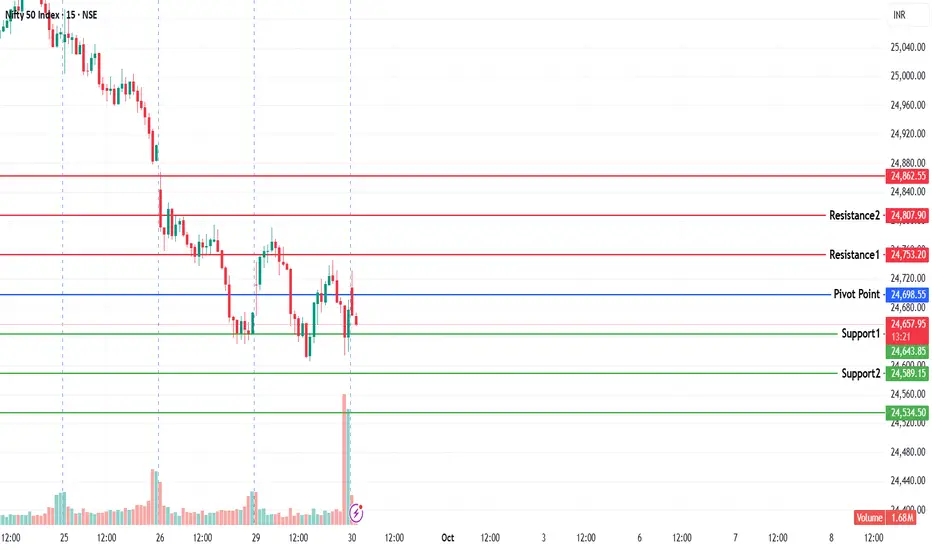
NIFTY KEY LEVELS FOR 30.09.2025NIFTY KEY LEVELS FOR 30.09.2025
RTF: 3 Minutes
If the candle stays above the pivot point, it is considered a bullish bias; if it remains below, it indicates a bearish bias. Price may reverse near Resistance 1 or Support 1. If it moves further, the next potential reversal zone is near Resistance 2 or Support 2. If these levels are also broken, we can expect the trend.
When a support or resistance level is broken, it often reverses its role; a broken resistance becomes the new support, and a broken support becomes the new resistance.
If the range(R2-S2) is narrow, the market may become volatile or trend strongly. If the range is wide, the market is more likely to remain sideways
please like and share my idea if you find it helpful
📢 Disclaimer
I am not a SEBI-registered financial adviser.
The information, views, and ideas shared here are purely for educational and informational purposes only. They are not intended as investment advice or a recommendation to buy, sell, or hold any financial instruments.
Please consult with your SEBI-registered financial advisor before making any trading or investment decisions.
Trading and investing in the stock market involves risk, and you should do your own research and analysis. You are solely responsible for any decisions made based on this research.
NIFTY Analysis 30 SEPTEMBER, 2025 ,Daily Morning update at 9 amTrading Skill Self-Check (Before Trading and traning)
Evaluate yourself
Can you identify support & resistance levels accurately?
Can you spot Doji, engulfing, or pin bar patterns?
Can you calculate FAKE levels using 1- 4 hour chart?
Can you judge overbought/oversold zones in intraday charts?
Can you set entry/exit levels before market open?
Can you place stop-loss orders effectively?
Can you manage positions during consolidation or breakout?
Can you predict short covering moves?
Can you avoid trading during indecision?
Can you adjust strategy dynamically based on market reaction at key levels?
Can you recognize short-term trend reversals before price breaks key levels?
Can you differentiate between strong and weak breakouts?
Can you use gap analysis and previous day levels to anticipate pre-market moves?
Can you combine multiple indicators (like moving averages, trendlines, volume) to confirm trade setups?
Can you analyze intraday candlestick bodies and wicks to identify buying/selling pressure?
Can you forecast short-covering or profit-booking moves using chart patterns?
Risk Management Skills
Can you set stop-loss levels based on support/resistance or ATR?
Can you calculate target levels based on technical levels, Fibonacci, or fake level strategy?
Can you adjust position size according to risk tolerance and volatility?
Can you avoid overtrading during consolidation or sideways markets?
Can you cut losses quickly when the market moves against your position?
Execution & Strategy Skills
Can you place orders efficiently during volatile market conditions?
Can you track market reaction to key levels and adjust your trades dynamically?
Can you combine pre-market analysis with live price action to improve decision-making?
Can you identify fake breakouts or fake moves and avoid being trapped?
Can you maintain discipline and follow your trading plan without letting emotions affect decisions? if NO ,THEN WHY U R WEASTING YOUR MONY AND TIME.
24500 coming again!?As we can see NIFTY failed to take SUPPORT at our demand zone and is falling unidirectionally which shows impending weakness in all sectors. Hence we may see NIFTY taking support around 24500 zone which is also a psychological level

#NIFTY Intraday Support and Resistance Levels - 30/09/2025Nifty is likely to see a flat opening around the 24,700 zone, indicating indecision after the recent downtrend. The index is trading near a crucial support and resistance zone, suggesting that today’s session could remain range-bound with opportunities for both intraday buyers and sellers.
On the upside, a move above 24,750–24,800 can trigger a bounce toward 24,850, 24,900, and 24,950+. Sustaining above these levels may bring short-covering and provide momentum to bulls.
On the downside, a breakdown below 24,700 followed by weakness under 24,650–24,600 can drag the index lower toward 24,550 and 24,500-. If selling pressure increases, further downside cannot be ruled out.
Overall, Nifty is consolidating in a narrow range with sellers holding dominance. Traders should stay cautious, follow breakout levels, and manage risk with strict stop-losses.

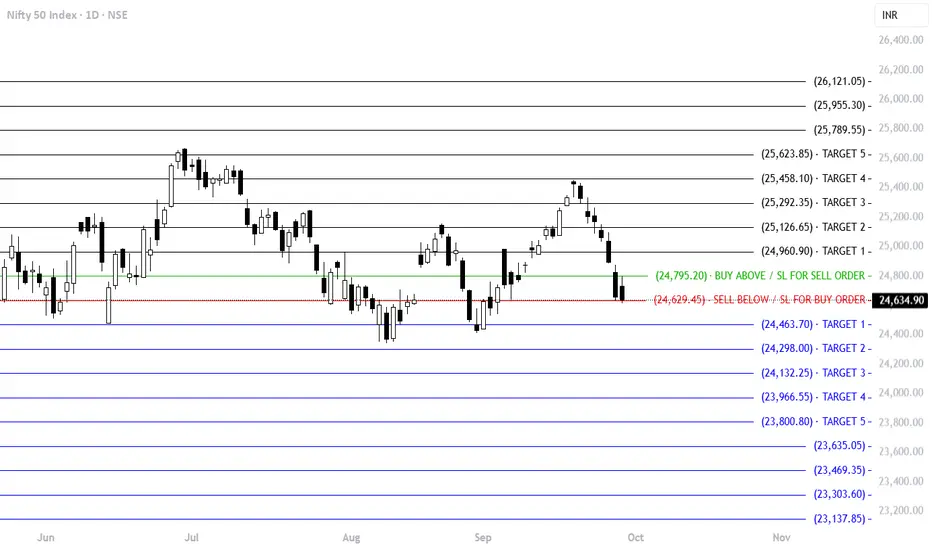
NIFTY Levels for TodayHere are the NIFTY's Levels for intraday (in the image below) today. Based on market movement, these levels can act as support, resistance or both.
Please consider these levels only if there is movement in index and 15m candle sustains at the given levels. The SL (Stop loss) for each BUY trade should be the previous RED candle below the given level. Similarly, the SL (Stop loss) for each SELL trade should be the previous GREEN candle above the given level.
Note: This idea and these levels are only for learning and educational purpose.
Your likes and boosts gives us motivation for continued learning and support.
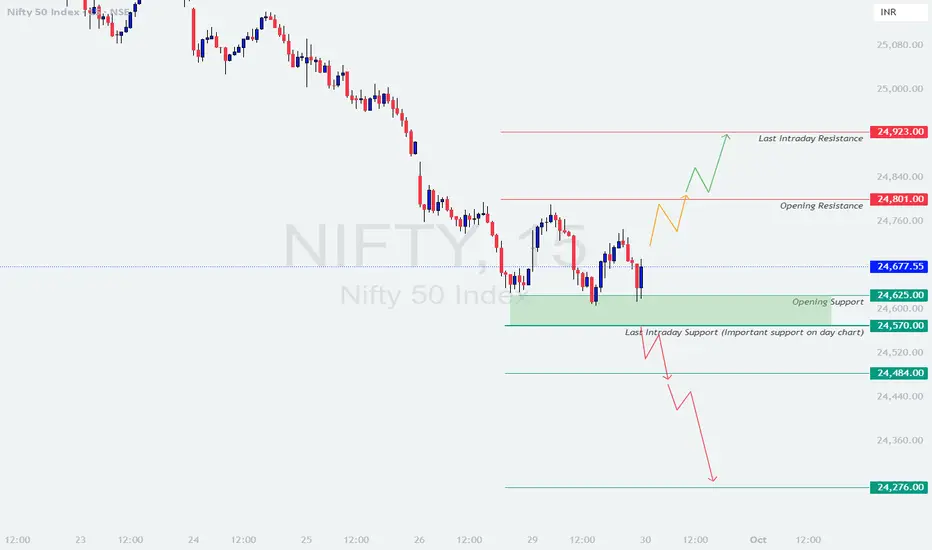
NIFTY : Trading levels and Plan for 30-09-2025NIFTY TRADING PLAN – 30-Sep-2025
Nifty closed at 24,677.55, recovering slightly after testing crucial supports. For tomorrow’s session, the index is positioned between 24,801 (Opening Resistance) and 24,570 (Last Intraday Support). These levels will be pivotal in shaping intraday moves.
📌 Key Levels to Watch:
Last Intraday Resistance: 24,923
Opening Resistance: 24,801
Current Market Level (CMP): 24,677
Opening Support: 24,625
Last Intraday Support (Crucial on daily chart): 24,570
Extended Support Levels: 24,484 → 24,276
🚀 Scenario 1: Gap Up Opening (100+ points)
If Nifty opens near 24,780 – 24,850, it will be very close to the Opening Resistance at 24,801 .
Sustained move above 24,801 may trigger bullish momentum, leading towards 24,923.
A breakout above 24,923 could extend gains towards 25,000+ zones, but traders must confirm strength with follow-up buying.
However, rejection around 24,801 – 24,923 may attract intraday profit booking, dragging Nifty back towards 24,700 – 24,625.
👉 Educational Note: Gap-ups tend to trap aggressive buyers if resistance zones are not broken decisively. Always wait for an hourly close above resistance before committing to fresh longs.
⚖️ Scenario 2: Flat Opening (within ±100 points)
A flat opening near 24,650 – 24,700 will likely keep Nifty in a consolidation phase.
On the upside, a push towards 24,801 needs to be watched closely. If crossed, 24,923 becomes the immediate target.
On the downside, failure to hold 24,625 will invite pressure towards 24,570.
Sustained weakness below 24,570 will likely lead to an extended decline towards 24,484 → 24,276.
👉 Educational Note: Flat openings usually indicate indecision. Such days often turn into range-bound markets until a breakout confirms direction.
📉 Scenario 3: Gap Down Opening (100+ points)
If Nifty opens around 24,550 – 24,500, it will be close to the Last Intraday Support at 24,570 .
A breakdown below 24,570 may extend the decline to 24,484, and if that fails to hold, next support lies at 24,276.
If 24,570 holds firmly, expect a rebound towards 24,625 → 24,700, driven by short covering.
Hourly close below 24,570 is the confirmation for a bearish continuation.
👉 Educational Note: Gap-downs often trigger panic selling in the first hour. Smart traders wait for support to be tested before entering trades to avoid false breakdowns.
🛡️ Risk Management Tips for Options Traders
⏳ Avoid aggressive trades in the first 15–30 mins; let the market settle.
🛑 Always place stop losses on a closing basis (15-min/hourly candle) .
🎯 Use option spreads (Bull Call / Bear Put) to minimize time decay.
⚖️ Stick to a 1:2 or higher risk-reward ratio .
💰 Book partial profits at key levels instead of waiting for extremes.
🧘 Maintain discipline—capital preservation is more important than chasing every move.
📌 Summary & Conclusion
Bullish Bias: Above 24,801 → 24,923, next target 25,000+.
Neutral Zone: Between 24,625 – 24,801, expect sideways consolidation.
Bearish Bias: Below 24,570, expect weakness towards 24,484 → 24,276.
📊 Nifty is trading in a tight band with critical support at 24,570 and resistance at 24,801. A decisive move beyond these levels will guide intraday momentum. Traders should stay patient and trade only on confirmation.
⚠️ Disclaimer: This trading plan is for educational purposes only. I am not a SEBI-registered analyst. Please do your own analysis or consult a financial advisor before making trading decisions.
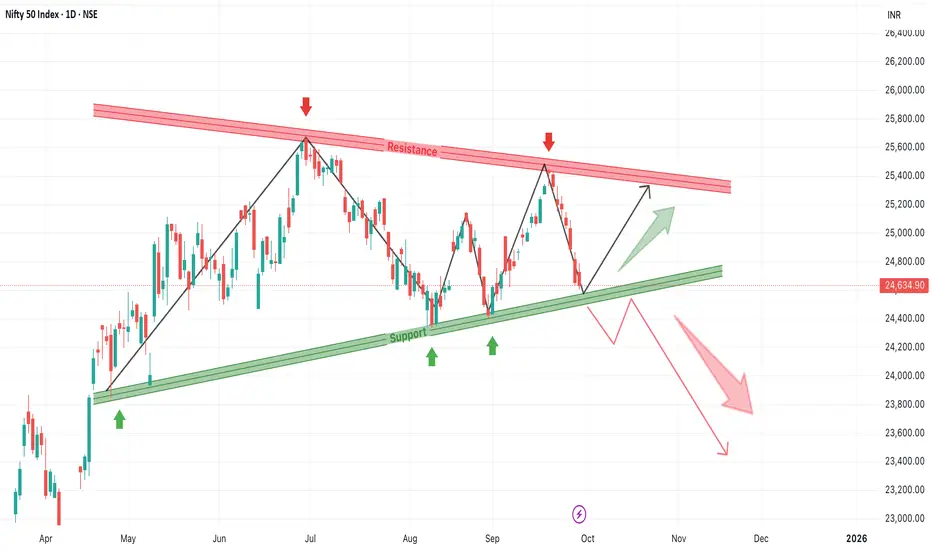
Nifty 50 – Triangle Structure Holding Critical Support ZoneThe daily chart of Nifty 50 shows a well-formed symmetrical triangle pattern. Price is currently hovering around the lower ascending trendline, which has acted as a strong support multiple times in the past. Market participants should closely monitor this zone as the next move will set the tone for October.
1. Symmetrical Triangle with Tightening Range
Nifty has been forming lower highs and higher lows since May, leading to the development of a large symmetrical triangle pattern. The converging trendlines indicate that volatility compression is taking place, often a precursor to a big breakout or breakdown move.
2. Support Zone Holding Around 24,600
Currently, the index is testing the crucial ascending support line, which has been respected at least 4 times in recent months (as shown by green arrows). A bounce from here would indicate continued buyer interest and maintain the bullish structure intact.
3. Upside Scenario – Reversal from Support
If Nifty manages to hold above this support zone and begins a reversal, we can expect a relief rally toward the falling resistance trendline. This could lead to a price retest near 25,300–25,400, which is also the previous swing high. A clean breakout above this zone could trigger a new upward trend.
4. Downside Scenario – Breakdown Below Support
On the contrary, if price breaks and closes below the 24,600 support zone, it may trigger panic selling. The chart indicates a large red arrow projection in this case, suggesting a move toward the 23,800–23,400 zone initially. A breakdown from symmetrical triangles often results in sharp directional moves.
5. Risk Management Is Critical
At this stage, traders must stay non-directional and reactive rather than anticipatory. Wait for either a confirmation bounce from support or a clear breakdown. False moves are common near the apex of a triangle. Risk should be tightly managed with stop-losses below support for long positions, and above resistance for short positions.
6. Pattern Psychology – Buyers vs Sellers at War
This pattern is a classic indecision structure, where neither bulls nor bears are in full control. The resolution from this zone will reflect market sentiment for Q4 2025. Keep an eye on macro triggers, earnings season, or global cues, which could act as catalysts for the next breakout or breakdown.
Neowave Forecast| Gold|Bitcoin|Nifty|Bank Nifty|30/09/2025If you have any doubts related to your stocks and portfolio, ask in the comments we will provide you Neowave Chart for that.
Discussed Instruments
#Gold
#Bitcoin
#Nifty
#Bank Nifty
Yesterday Video-

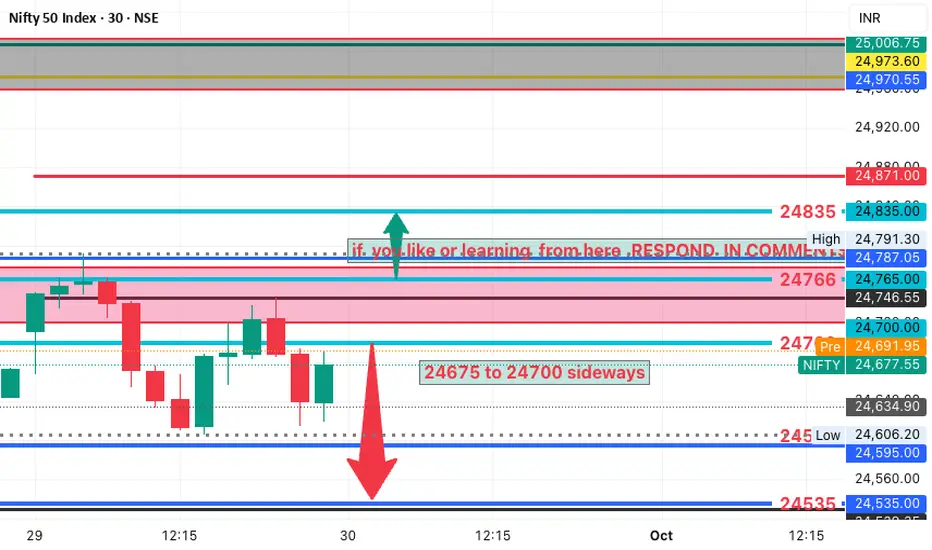
Nifty is ready for 26000We are expecting Nifty to reverse from the important demand zone of 25050.
After the reversal, we can expect Nifty to reach above 26000. RSI is also indicating the reversal signal on the 30-minute timeframe.

Trading Levels for NIFTY 50 Trading Levels for NIFTY 50
Anyone can Trade on both sides (as per levels)
Levels shared on chart
Nifty 50 Path Daily Time Frame On Daily Time Frame Path of Nifty 50 with Support and Resistance Levels
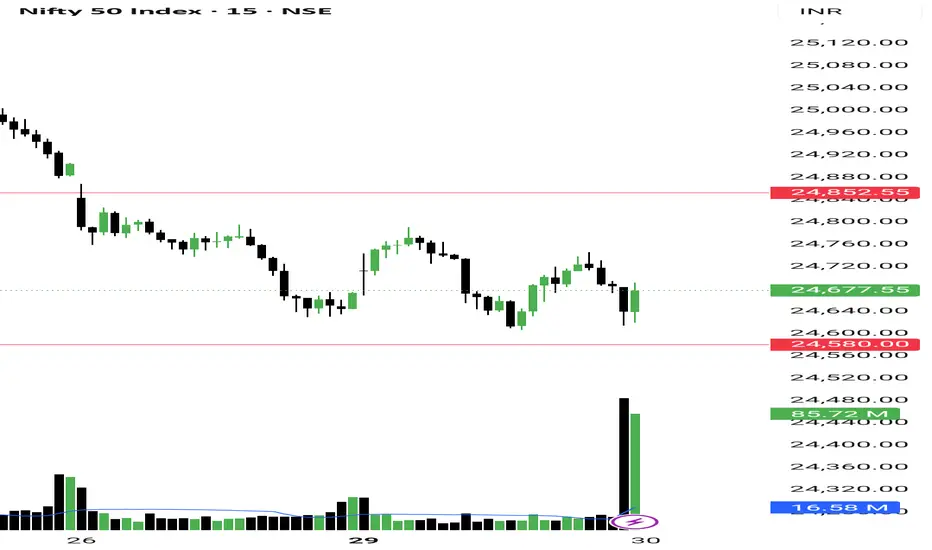
Nifty Down but Buyers Volume is Back! So as we studied, NSE:NIFTY gave a chance to Sell-on-Rise. The index went up to the day high and then dropped.
But here’s the interesting part – even though price fell, the candle closed red, and it ended below Friday’s low, the buyers’ volume was still higher by 60 million.
That’s a classic sign of accumulation!
So yes, I’ve entered the first batch of index longs. Even if it dips further, I’ll be accumulating more.
Now let’s check the data for tomorrow:
- Pivot is now at 24677, and PP is 0.17
- Retail index down but buyers’ volume up = classic sign of institutional accumulation!
My plan for tomorrow is simple – I’ll add more to the longs I bought today if Nifty opens above the pivot.
The upside target is resistance at 24850.
Support is at 24580.
On the equity side – yes, we saw a sell-off on Friday and swing supports were broken. But today, stocks didn’t get any strong follow-up. I see this as manipulation and liquidity grabbing.
That’s why I didn’t sell anything yet. In fact, I’ve added more to my holdings – NSE:KROSS and NSE:HINDZINC .
For tomorrow, I’ll be focusing on #Commodity sector. And from now on, I’ll also start hunting for my Earning Pivot setups since quarterly results are here.
That’s all for the day. Take care and have a profitable tomorrow.
---
📊 Levels at a glance:
Pivot: 24677
Support: 24580
Resistance: 24850
Pivot Percentile: 0.17 (supports accumulation view)
Bias: Long buildup, add more if above pivot
Sectors to watch: Commodities, Earnings Pivot setups
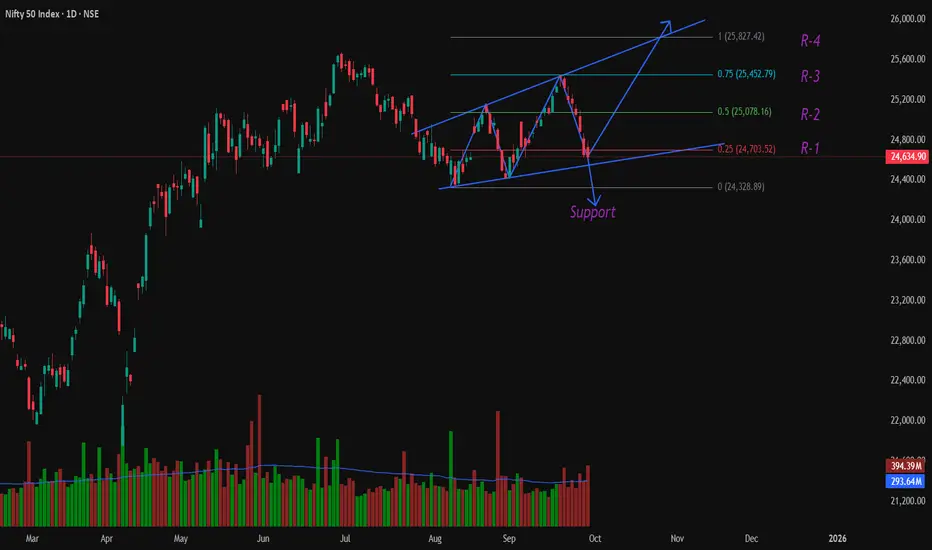
Nifty – Potential Reversal ZoneNifty – Potential Reversal Zone
Nifty is testing a key support area once again, its third touch of the 100-EMA after previous successful reversals.
Price is also hovering near the 0.786 Fibonacci retracement, adding confluence.
A brief consolidation here could set up a strong upside move, but confirmation is critical after eight straight sessions of decline.
One should look for a decisive candle or volume pickup before taking any long trade.
In case it goes down further then next support areas are 24350, 24190, 23900.
✅ If you like my analysis, please follow me as a token of appreciation :)
in.tradingview.com/u/SatpalS/
📌 For learning and educational purposes only, not a recommendation. Please consult your financial advisor before investing.
