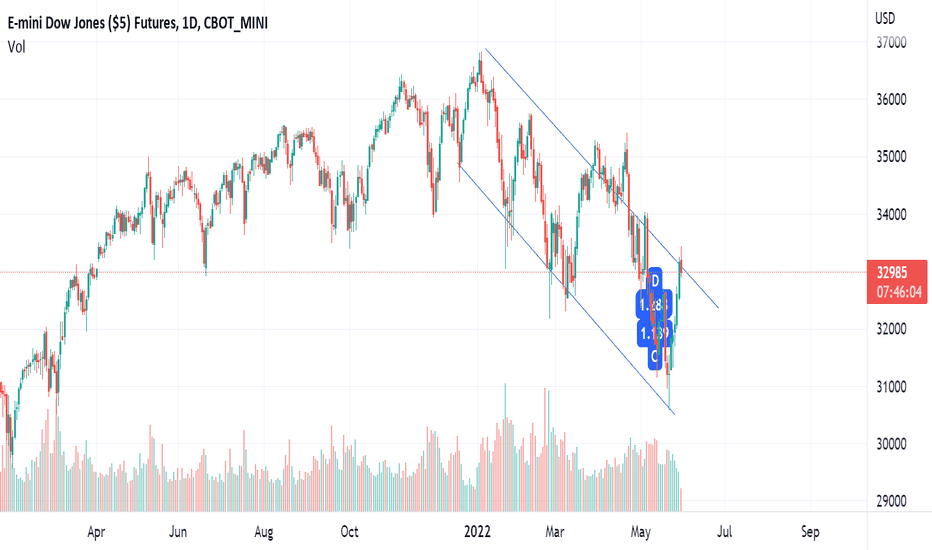
dow jones futuresSo inspite of a 1300 points RUN UP from the Bottom Last Night..... why is it that the DJIA is almost at a halt?????? It is very simple if you understand what is happening..... This chart is LIVE as I write .
Look at the 78.6% fib..... it is acting as a resistence ..... PRICE is reacting here and NOT WANTING TO GO UP. So what next ???? If it doesnt go up..... it will want to come down to the 61.8% level.
I am a SCALPER and I take my trades based on the 1st 5 minutes candle...... I know in 5 minutes EXACTLY where the market is headed. If any of you want to understand how???? You can call me on 9366831223.... My name is DEEPAK GUPTA. This will have to be explained over the phone and not on a write up. Please call me anytime from now untill 8 am.... or after 4 pm untill 5 pm. Thankxx.
BTW.............. I dont ever use any indicators
US30H2026 trade ideas
dow jones futuresThe DJIA future charts as I see it LIVE and CURRENTLY. Has some interesting set up poised... breaking and sustaining above 29725, it can go right up to 32000 zone. However Early days to be ANTICIPATING . I however SAW something very interesting on the 3/5 minute tfs..... an ENDING DIAGONAL. Needs to be seen whether we can take off yet
dow futuresThe Chart Must be co-related at your end to the DJIA spot chart and seen accordingly. AB=CD done on Daily basis on the DJIA futures, and a Jump/Bounce followed. I cautioned you all yesterday that the BOUNCE would be sooo LETHAL ... None of you would believe it, just as None believed Nifty at 15190 odd. DJIA future is at its 23.6% fib retracement which is the 1st RESISTENCE. Since Price never reacts at the specific point.... I have given it a Buffer of 100-120 odd points to see what happens. I have also marked a LEVEL, above which and SUSTAINING ...................................... CATCH ME IF YOU CAN
I HOPE YOU GUYS MADE MONEY TODAY ...... I would be happy to hear the YESS'S
DJIA futuresIf DJIA futures hold the zone marked........ expect a 3000 RALLY very very soon. It takes a Lot of Guts to come out and say all this especially when Each one of you is in a NEGATIVE SENTIMENT MOOD. You have to believe what the Chart is Telling you and NOT what you want to make yourself Believe. These are NO FLUKE Markings ... they are based on Serious Calculations.
I have watched SOME PROS give a lot of GYAAN here regarding levels etc. What was given on Friday has been VIOLATED today and all these GYAANI PURUSH are quiet. I have the GUTS to OWN UP and say I WAS WRONG.... So far I have held GOOD
Dow Jones FuturesA single 1 minute candle of 700 points down, from 32795 to 30075 or something like that... and if you are wondering YYYY>>>????? Look at the 12 MA..... it broke below 21 MA and then just kept pushing down. I have had to show this on a 30 minute chart as TV will not accept any analysis on a 1 minute chart. But if you plot the 12/21 on a 1 minute time frame, you will understand what I am saying.
1. Here is your 3rd Most RELIABLE indicator
Dow jones futureAgain, this is just an EXAMPLE and nothing else. The indicator will AUTOMATIVALLY give you a SIGNAL like this.... XABCD OR simply ABCD. This is NOTHING but a SIGNAL that the wave structure is coming to an end on that PARTICULAR TIME FRAME. SIMILARLY, THE SAME XABCD OR ABCD will appear to the LOWER SIDE ..... which really Means that it is Time to go LONG on that Specific Time Frame
Dow Jones FuturesI marked the chart on the DJIA futures by mistake. But the marking will co - relate with the DJIA spot as well. I have marked just the CURRENT WAVE, to show you what the wave swill look like. Inspite of the fact that I have marked ABC, showing C breaking below the Recent Low, there is just 1 contra call here. I will need that to happen before I say we are done.
LongsExit🔴Dow oversold. But its a relative term. Weekly RSI < 40 (36)
🔴SAR-Mean reversion system has given sell signal in weekly.
🔴Price trading below major moving avg in daily & weekly TF
🔴Below 31148 it can break swing low & head towards 29731
Since 2021 DOW - Khaya piya kuch nahin glass toda bara ana.


