Get ready for bull runDow jones is getting ready bull run. Expect it to touch 43415 - 44071 by December 2024. Bottom has already formed.

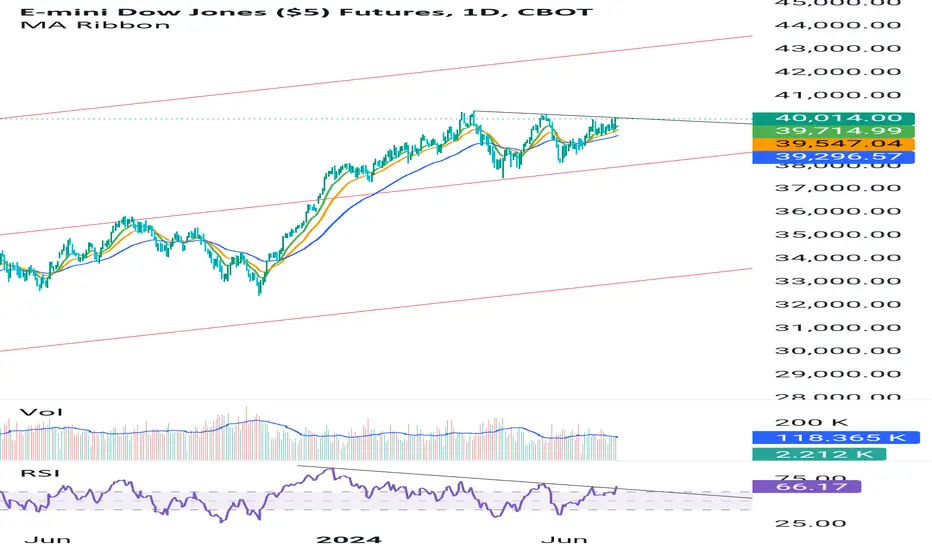
Negative divergence Negative divergence, near the top end of slope, is suggesting short term top is in near future. 38500-38750 is the zone for short term top. Close above 38800 will negate this view.

dow jones future bearish at resistance/sell zoneCBOT_MINI:MYM1! may give sharp fall from the current sell zone if sustains below 34121 and gives daily closing below it

Dow JonesHere is the LONG TERM Channel of the Dow Jones since 2007 or so with Price staying well within the Channel for all these many years. What I have spotted are the 4 SUPPORT areas since 2009 or so and simply attached all those support areas to draw a PERCEPTION LINE between the Broader Channel . In the

Dow - BearishLooks Like a Good Set up of Head & Shoulders
Might just go down to Targets
Check if you Like & Agree

DJIA In as much as it is the DJIA futures chart............ just co-relate to Spot..... Have given you the CHICKEN HIDING.................... Lets see what happens..., So far Sooooooo Good


#dowjonesi am not a sebi registerd dow jones is making a negative pattern sell below the red zone if it is fall below the red zone messive selling is come
Note :- this is my early view donot sell befor the level is come

See all ideas
A representation of what an asset is worth today and what the market thinks it will be worth in the future.
Displays a symbol's price movements over previous years to identify recurring trends.
Frequently Asked Questions
The current price of DJIA Futures is 44,042 JPY — it has fallen −0.29% in the past 24 hours. Watch DJIA Futures price in more detail on the chart.
The volume of DJIA Futures is 8.00. Track more important stats on the DJIA Futures chart.
Open interest is the number of contracts held by traders in active positions — they're not closed or expired. For DJIA Futures this number is 1.00 K. You can use it to track a prevailing market trend and adjust your own strategy: declining open interest for DJIA Futures shows that traders are closing their positions, which means a weakening trend.
Buying or selling futures contracts depends on many factors: season, underlying commodity, your own trading strategy. So mostly it's up to you, but if you look for some certain calculations to take into account, you can study technical analysis for DJIA Futures. Today its technical rating is neutral, but remember that market conditions change all the time, so it's always crucial to do your own research. See more of DJIA Futures technicals for a more comprehensive analysis.