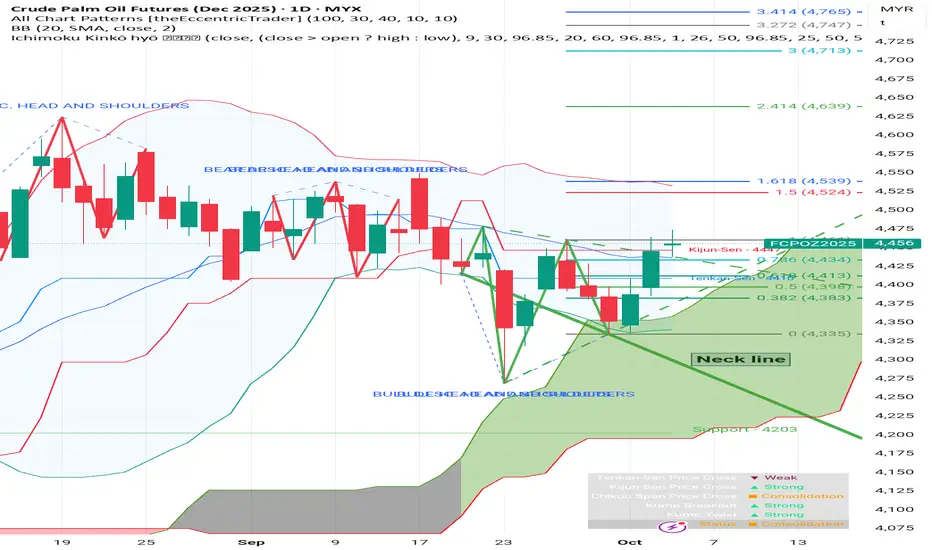
Potential Inverse H&SA descending trendline has been drawn, connecting the peaks between the shoulders and the head. A decisive break and close above this neckline would be a bullish confirmation signal, suggesting a potential trend reversal to the upside.
Ichimoku Cloud Analysis:
The price is currently trading inside the Kumo (the cloud), which typically indicates a state of consolidation or equilibrium.
A breakout above the top of the cloud (Senkou Span B) would add strength to the bullish case. Conversely, a fall below the bottom of the cloud (Senkou Span A) would be bearish.
The Kijun-Sen (blue line) at 4,441 is acting as a key level of support/resistance. The price is currently trading just above it.
An earlier Bearish Head and Shoulders pattern is marked on the chart from late August to mid-September. The price broke its neckline and subsequently trended downwards, which led to the formation of the current potential inverse pattern.
A Fibonacci retracement has been drawn from a recent swing high to the low of the "Head." The price is currently hovering near the 0.786 Fibonacci level (4,434).
The chart suggests that the Crude Palm Oil futures for December 2025 are in a consolidation phase after a prior downtrend. Traders are likely watching for the completion of the potential Inverse Head and Shoulders pattern. A breakout above the neckline and the Ichimoku Cloud would be a significant bullish signal. Until then, the price may continue to fluctuate between the key support and resistance levels.
CPOF2028 trade ideas
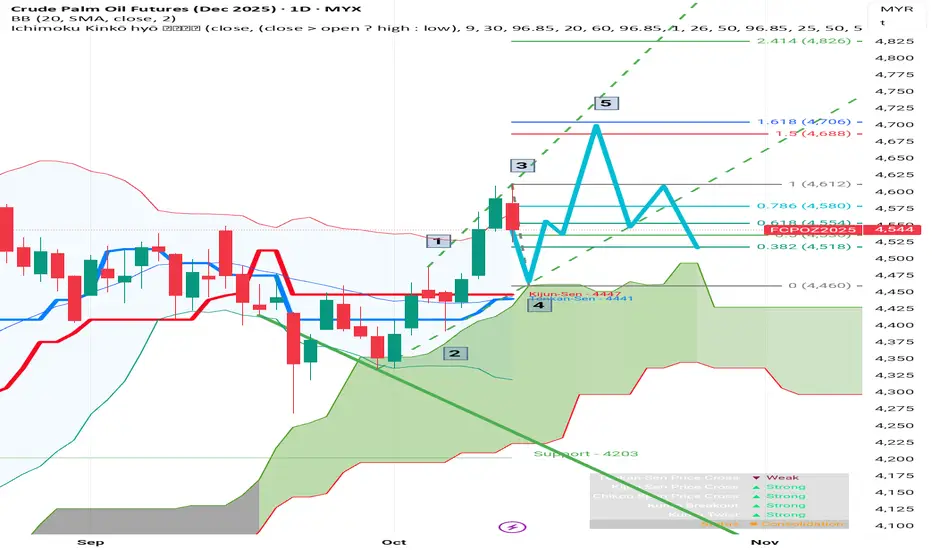
a bullish outlook, following EW impulse patternIdentified a potential 5-wave upward impulse move starting from the low in early October.
Wave 3 appears to have just completed, reaching a high of 4,612. This wave is typically the strongest and longest.
The chart projects a corrective Wave 4 is now underway. The blue line indicates a potential path for this correction, suggesting a pullback towards the Fibonacci retracement levels.
Following the correction, a final upward Wave 5 is anticipated, with targets set by Fibonacci extension levels.
Ichimoku Cloud Analysis:
The price is trading above the Ichimoku Cloud (Kumo), which is a strong bullish signal.
The cloud ahead is green and thick, suggesting continued bullish momentum and strong support below the current price.
The Tenkan-Sen (red line) is above the Kijun-Sen (blue line), reinforcing the bullish sentiment.
The Kijun-Sen, currently around 4,441, and the top of the cloud could act as significant support levels during the projected Wave 4 correction.
Fibonacci Levels:
Retracement for Wave 4: The potential support targets for the corrective Wave 4 are based on the Fibonacci retracement of Wave 3. Key levels to watch are:
0.382 level at 4,518
0.500 level at 4,492
Extension for Wave 5: The potential targets for the next upward move (Wave 5) are projected using Fibonacci extensions. Key resistance levels are:
1.500 extension at 4,688
1.618 extension (a common target for Wave 5) at 4,706
A more optimistic target is at the 2.414 extension level of 4,826.
Current Price Action:
The last traded price is $4,544, down 1.02% for the day.
The recent bearish candle (red) after reaching the peak of Wave 3 supports the idea that the corrective Wave 4 may have begun.
Potential Market Scenario
Based on this chart, the anticipated scenario is:
Short-term: A price correction or consolidation (pullback). The price may drop to test support levels around $4,518 or $4,492.
Medium-term: If the support holds and the Elliott Wave count is correct, the price is expected to resume its upward trend to begin Wave 5, targeting the resistance area between 4,688 and 4,706.
A baerish outlook for fcpo pricesA potential Head and Shoulders pattern, which is a classic bearish reversal formation. The chart has labeled "Neck line" around the MYR 4,475 price level. A decisive break below this neckline would confirm the pattern and signal a potential move lower.
Fibonacci Retracement: A Fibonacci retracement tool has been applied from a recent swing high (around MYR 4,515) to a swing low (around MYR 4,411). The price has struggled to stay above the 0.382 and 0.618 levels, which often act as resistance in a downtrend.
Projected Price Path: The blue line drawn on the chart illustrates a hypothetical scenario where the price breaks below the neckline, retests it as new resistance, and then continues its downward trajectory.
Potential Price Targets: The Fibonacci extension levels are used to project potential downside targets. Key levels identified include:
MYR 4,359 (1.5 extension)
MYR 4,347 (1.618 extension)
MYR 4,264 (2.414 extension)
Descending Trendline: A green trendline shows that the price has been making lower highs, indicating an existing downtrend that adds weight to the bearish analysis.
In summary, the technical setup suggests that if the price of FCPO breaks below the neckline support, it could trigger a significant sell-off toward the lower Fibonacci targets. 📉
Disclaimer: This is an interpretation of the technical analysis presented in the chart and does not constitute financial advice. Market conditions can change rapidly.

Malaysian Palm Oil Hovers around MYR 3,780Malaysian palm oil futures traded around MYR 3,780 per tonne, extending gains from the prior session amid strength in rival edible oils. Prospects of lower production because of dry weather and declining inventories also lifted sentiment. Malaysia's palm oil stocks at the end of November fell after growing in the prior 6 months. Capping the bullish traction was a lack of market participants and a low volume of trade in the wake of a holiday weekend. Meantime, exports of Malaysian palm oil products during Dec. 1-25 were estimated to fall between 4% and 16% from the prior month, according to data from surveyors Intertek Testing Services and AmSpec Agri. Traders continued to digest a move from Kuala Lumpur to keep January export tax for palm oil at 8% but raise its reference price. In top exporter Indonesia, 3.0 million metric tons of palm oil products were shipped in October, tumbling 31% from a year ago but rising 11.4% from the prior month, data from an industry association showed.
For Signals details in bio

Is Anti Butterfly to be targeted...Seems extreme price has been ended as price has entered inside of Bottom BB. Ptichfork is assisting to find the Anti Butterfly (3988 - 4109)

FCPO | End of downsideFCPO has been on the downside for an extended period, corrected huge.
now we are looking for upside movement.
as one can see RSI is also supportive, it may turn upside anytime soon.

Support Breakout in CRUDE PALM OIL - RINGGIT FUTURES (JUNE)A violation of support at 5900 may conclude the uptrend and set the stage for deeper correction towards 5500/5000.

FCPO Triangle PatternFCPO emerging triangle patter, sellers are becoming nervous, will they book profits or cover their losses?
