Global Events Impacting Nifty & Sensex1. The Role of Globalization in Stock Markets
Before diving into specific events, it’s important to understand why global developments matter for India’s Nifty and Sensex.
Foreign Institutional Investors (FIIs):
FIIs are among the biggest drivers of India’s stock markets. Their decisions are often influenced by global risk appetite, interest rates abroad, and international events. If FIIs buy, markets rally. If they sell, markets often correct.
Trade and Commodities:
India is one of the largest importers of crude oil and commodities. Global supply chain issues, trade wars, or sanctions directly affect inflation, current account deficit, and corporate profitability, thereby impacting indices.
Currency Movements:
The rupee’s exchange rate against the U.S. dollar is heavily influenced by global factors. A stronger dollar can lead to FII outflows, while a weaker dollar generally benefits emerging markets like India.
Interconnected Economies:
A slowdown in the U.S., Europe, or China affects global demand. Since Indian companies export software, pharmaceuticals, textiles, and engineering goods globally, their revenues depend on world economic conditions.
This interconnectedness means that even if domestic fundamentals are strong, global shocks can influence Indian equity indices.
2. Global Monetary Policies and Interest Rates
One of the most consistent global factors that affect Nifty and Sensex is monetary policy decisions of major central banks, especially the U.S. Federal Reserve, the European Central Bank (ECB), and the Bank of Japan (BoJ).
U.S. Federal Reserve (The Fed):
The Fed’s interest rate decisions directly impact the flow of capital. When the Fed hikes rates, U.S. bonds become more attractive, leading to capital outflows from emerging markets like India. This often causes pressure on Nifty and Sensex. Conversely, rate cuts or dovish policies encourage FIIs to invest in Indian equities.
Quantitative Easing & Tightening:
During crises (like 2008 or COVID-19), central banks inject liquidity through QE. This “easy money” often flows into Indian markets, creating rallies. On the flip side, tapering or tightening leads to corrections.
Impact on Currency:
Interest rate hikes abroad strengthen the U.S. dollar, weakening the rupee. This affects import costs, inflation, and overall market sentiment.
Example:
In 2013, the U.S. Fed hinted at tapering its bond-buying program (“Taper Tantrum”). This led to a sharp fall in emerging markets, including India, with Sensex and Nifty witnessing major corrections.
3. Oil Prices and Energy Shocks
Crude oil is often called the “lifeblood” of the Indian economy because India imports nearly 80% of its crude requirements.
High Oil Prices:
Rising crude prices increase India’s import bill, fuel inflation, widen the current account deficit, and reduce corporate profitability. This usually leads to negative sentiment in Nifty and Sensex.
Falling Oil Prices:
Lower oil prices act like a tax cut for the Indian economy. They reduce inflation, boost consumer spending, and improve margins for companies. This often supports rallies.
Geopolitical Influence:
Events like tensions in the Middle East, OPEC+ production decisions, or sanctions on major oil-producing nations can cause volatility in global oil prices, which in turn directly impacts Indian markets.
Example:
In 2022, the Russia-Ukraine war pushed crude oil above $100 per barrel, leading to inflationary pressures and corrections in Indian equity indices.
4. Geopolitical Conflicts and Wars
Global conflicts often trigger risk-off sentiment, where investors move out of risky assets (like equities) into safe havens (like gold and U.S. bonds).
Wars:
Conflicts such as the Gulf War, U.S.-Iraq war, or Russia-Ukraine war lead to volatility in global markets. Sensex and Nifty often see short-term corrections.
Terrorist Attacks:
Events like 9/11 in the U.S. or terrorist incidents in Europe not only affect global travel and trade but also trigger immediate stock market panic worldwide, including India.
China-Taiwan Tensions:
As China is a major trading partner globally, tensions in Asia-Pacific also ripple into Indian equities.
Example:
During the 2022 Russia-Ukraine war, Indian markets corrected sharply in the initial phase due to fears of crude price spikes and FII outflows.
5. Global Economic Slowdowns and Recessions
Recessions in major economies affect Indian exports, global investor sentiment, and FII inflows.
2008 Global Financial Crisis (GFC):
Triggered by the collapse of Lehman Brothers and the U.S. housing bubble, this event led to a meltdown across global markets. Sensex fell from over 21,000 to below 9,000 within months.
European Debt Crisis (2010–12):
Concerns over Greece, Spain, and Italy’s debt led to global volatility. Indian indices too saw fluctuations during this period.
COVID-19 Pandemic (2020):
The pandemic caused global shutdowns, leading to a historic crash in March 2020 when Sensex lost over 13% in a single day. However, due to massive global stimulus, markets recovered sharply in the following months.
6. Global Trade Policies and Protectionism
Trade relations between major economies (especially the U.S. and China) influence global supply chains and investor sentiment.
U.S.-China Trade War:
When the U.S. imposed tariffs on Chinese goods, global markets saw volatility. India was indirectly affected as supply chains were disrupted, though some Indian sectors benefited (like electronics and chemicals).
WTO and Free Trade Agreements:
Global trade liberalization generally benefits Indian exporters. Protectionism, on the other hand, reduces global trade volume, impacting companies listed on Nifty and Sensex.
7. Global Technology Trends and Disruptions
Technology disruptions are global in nature, and India, being a hub for IT services, is directly impacted.
Silicon Valley and U.S. Tech Trends:
Since Indian IT companies earn most revenues from U.S. clients, any slowdown in U.S. tech spending impacts their stock prices, thereby dragging Nifty IT index and influencing the overall Nifty.
Global Cybersecurity Threats:
Large-scale cyberattacks (like the WannaCry ransomware) can impact IT companies and financial markets worldwide.
Artificial Intelligence & Automation:
Technological changes can reshape sectors globally, and Indian companies must adapt quickly.
8. Climate Change and Global Energy Transition
With the world moving towards sustainability, global policies like carbon taxes, ESG investing trends, and green energy transition directly affect Indian companies.
Global ESG Funds:
Many large funds now only invest in companies with strong ESG scores. This has influenced Indian companies listed on Nifty and Sensex to adapt.
Climate Disasters:
Global climate events like floods, hurricanes, and wildfires affect commodity supply chains, insurance costs, and investor sentiment worldwide.
Conclusion
Global events—whether economic, political, or social—have a direct and lasting impact on India’s Nifty and Sensex. In today’s interconnected financial system, Indian investors cannot ignore what happens across the world. From the U.S. Fed’s decisions to oil price shocks, geopolitical tensions, global recessions, or health pandemics, every event ripples into Dalal Street.
Yet, history shows that despite these ups and downs, India’s stock markets have grown over the long run, reflecting the resilience of its economy and corporate sector. For investors, the key is to stay informed, prepared, and disciplined, understanding that while global winds may shake the tree, the roots of India’s growth story remain strong.
NQM2022 trade ideas

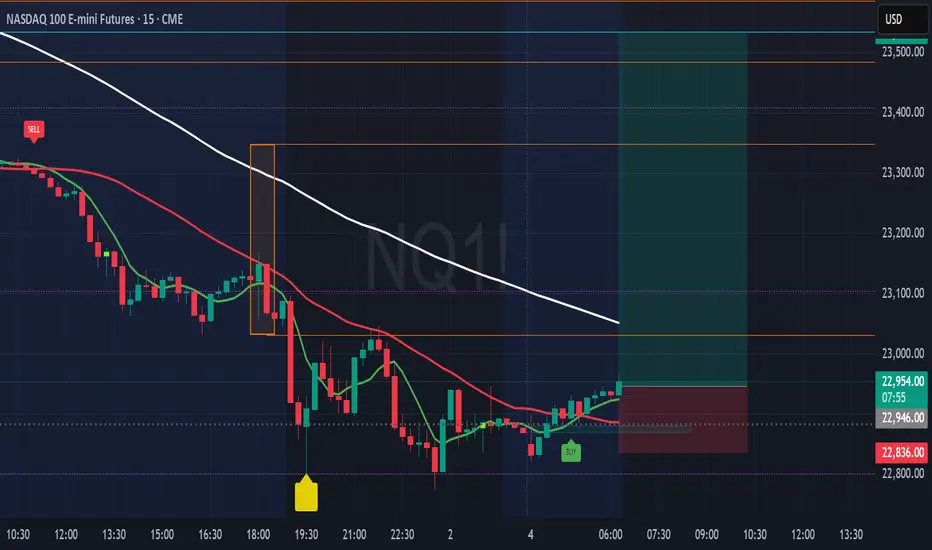
NQ100 - Eyes Long Towards 23531📌 NQ100 Futures 15-min — Buy Signal After Momentum Exhaustion & Trap Zone
Technical Structure Insights (15m):
🟡 A caution label printed near the evening session, highlighting a potential trap zone after short-term buyers were absorbed near the white moving average (trend resistance).
🔻 Price broke lower, completing a strong impulse leg to the downside.
🟢 BUY Signal has since appeared after price based out near 22,830 — coinciding with the purple reaction line.
📈 Current price is climbing back toward dynamic resistance levels (red and white moving averages).
🔍 Price must reclaim and sustain above 23,000 for upward continuation to remain structurally valid.
Otherwise, this may evolve into a lower high setup within the broader trend context.
Disclaimer: This chart is for educational purposes only and does not constitute financial advice. Always perform your own analysis and manage your trading risk responsibly
NAS100 breaks ATH Here the 15 min charts having all information all context that how money travels so long.
there is a smooth SMT divergence with S&P500.That added the story telling more strong.
Today is FOMC meeting lets see the market direction.

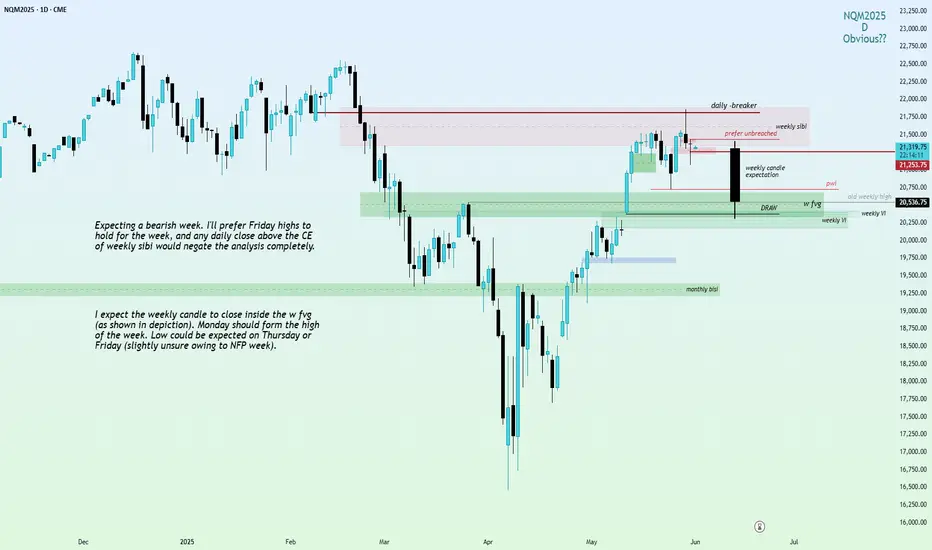
Weekly Review for US Indices. Bearish.Hello traders!
I've mentioned everything on the chart itself. Attaching YM and ES charts as well.
YM
ES
Note that if YM breaks Thurday's high, analysis of NQ and ES will be negated as well.
GLGT!
NASDAQ 100 E-Mini Future Weekly Technical Analysis 31Mar-4Apr!🚀 Unlock the potential with my NASDAQ 100 E-Mini Future Weekly Technical Analysis for 31st March to 4th April 2025!
✨ Boost, follow, and engage for updates. Your support means a lot! 🚀❤️
📍 Range Trigger Point (WRTP): 19,457
📅 Weekly Range: 1,179
📈 Long Position
🔹 Buy Above: 20,086
🎯 Target 1: 20,186
🎯 Target 2: 20,636
⛔ Stoploss: 19,693
📉 Short Position
🔹 Sell Below: 19,808
🎯 Target 1: 18,728
🎯 Target 2: 18,278
⛔ Stoploss: 20,201
✨ My strategies are backed by 6+ years of research and proven success in trading indices, commodities, and more. Connect to know more for Intraday and Weekly Levels and Live Market Confirmations. 📈
#Nasdaq100 #EminiFutures #WeeklyTrading #NumroTrader
📊 How to Trade with Numro Trader Weekly Levels
Buy Setup
🕒 Wait for a 1-hour candle to close above WRTP or Buy Above level.
📈 Confirm breakout with a candle breaking the high.
🛒 Enter buy order at active level (WRTP or Buy Above).
🎯 Target 2 (if coming directly from WRTP) or Target 1 (if coming below levels from WRTP).
⚠️ Avoid re-entering after hitting the target.
Sell Setup
🕒 Wait for a 1-hour candle to close below WRTP or Sell Below level.
📉 Confirm breakout with a candle breaking the low.
🛒 Enter sell order at active level (WRTP or Sell Below).
🎯 Target 2 (if coming directly from WRTP) or Target 1 (if coming above levels from WRTP).
⚠️ Avoid re-entering after hitting the target.

Buy Nasdaq nesr 20300 , upside Target 21400, SL recent lowHow to take trades using Harmonic pattern projection Trade setup is explained below :-
Entry : 1st SL point : 0% is recent top or bottom.
Trailing D: 11.4% is work as trailing SL of buy or sell trade if hit then we have to book profit
.If price goes below 2nd D 21.4% to 23.6% range then early traders can make fresh reversals trade after breaking 1st D 11.4% safe traders can reversal trade after breaking Point D 21.4% to 23.6% range
Targets :
Target T1 : 35.1% to 38.3%
Target T3 : 49.1% to 53.2%
T3: 60.9% to 64.8% is our 3rd Target since this is reversal zone so must book profit if break then take fresh trade again
Target T4 : 76.4% to 79.7%
Next Targets are 100% , 127.2% ,141.4% and final Target 161.8%.
How to take reversal trade :
If price going upside/ downside then then buy or sell levels appear on Chart ( Automatically show when price reach any reversal zone of harmonic projection pattern based .
After showing reversal levels wait for confirmation until 21.4% or 28.3 % level not break if break then exit from current buy / sell trade and take fresh reverse trade buy/ sell .
Trailing SL:
After reach 1st Target trail SL to just above or below cost ( for example we are holding sell trade from 100 1st Target 110 hit then move trailing sl to 104-105 and move SL as price move upside or Downside)
Re- Entry :
For Re-entry in any pull back Point D ( 11.4% ) is used for re-entry then SL recent high or low Point SL ( 0% ) .
Blue Line is 1st support/ Resistance
Green line is 2nd support/ resistance
Red line is 3rd Support/ resistance

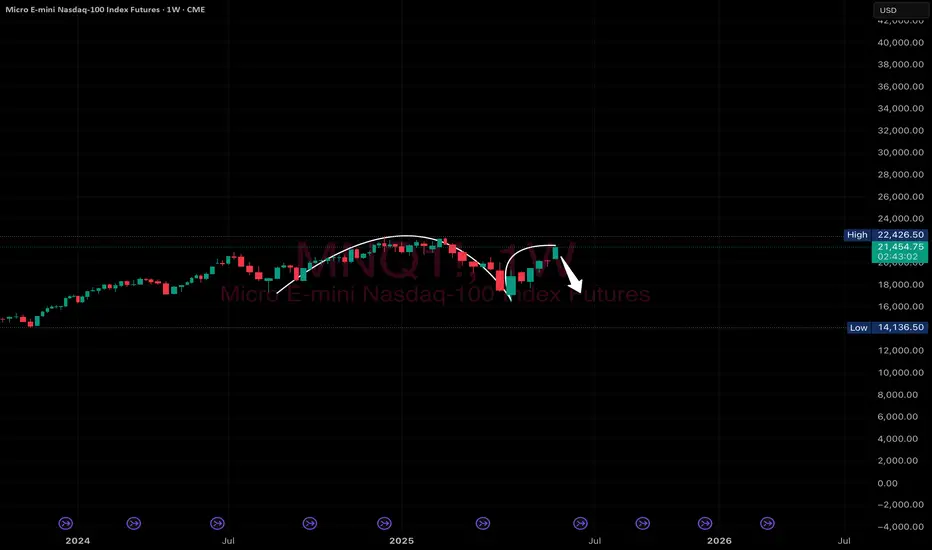
Welcome to bearishnessNQ shown the weakness in monthly TF. In Upcoming weeks we would see good downfall moves

Price Action AnalysisExpecting a price should be hold in the volume imbalance to push the price higher. If Volume imbalance get inverted and the target will be the HTF REQH

NASDAQ 100 E-Mini Future Technical Chart Analysis 09-13 Sept.📈 NASDAQ 100 E-Mini Future Technical Chart Analysis
📅 Date: 09-13 Sept., 2024
📊 Range Trigger Point: 18458
📉 Weekly Range: 1344
🟢 Buy Above: 19170
💼 Average Position: 19012
🎯 Buy Target 1: 19289
🎯 Buy Target 2: 19802
🔵 Stoploss: 18722
🔴 Sell Below: 18853
🎯 Sell Target 1: 17628
🎯 Sell Target 2: 17114
🔵 Stoploss: 19301
✨ Boost, follow, and engage for more detailed insights. Your support helps us bring you the latest and most accurate updates! 🚀❤️
#NASDAQ100 #NASDAQ #Emini #TradingSignals #TradingTips #StockMarket #USIndices

NASDAQ 100 E-Mini Future Weekly Chart Technical Analysis 6-10May📊 NASDAQ 100 E-Mini Future Weekly Chart Technical Analysis 6-10 May
🎯 Weekly Movement Point: 18001
🎯 Weekly Range in Points: 664
📉 Buy Above: 17797
📉 Average At: 17718
🎯 Buy Target 1: 18411
🎯 Buy Target 2: 18665
🛑 Buyer Stoploss: 17575
📉 Sale Below: 17640
🎯 Sale Target 1: 17590
🎯 Sale Target 2: 17337
🛑 Seller Stoploss: 17861
🙏 Humble Plea:
Hey there! Your support is like jet fuel for my trading journey - keeps me flying high! Hit that boost, follow, and engage button. Your energy keeps my momentum going!
⚠️ Disclaimer:
Trading's a wild ride - full of ups and downs! Strap in with stop-loss orders. Trade smart, protect those positions, and remember, fortune favors the brave (and the witty)! 🎢😄
🚀 Ready to launch into the Nasdaq cosmos?
Let's chat! I'm like a seasoned astronaut, navigating the Nasdaq universe with precision. Using cutting-edge technology and a constellation of indicators, I spot trading opportunities light years ahead. Give me a shout, and let's explore the Nasdaq galaxy together! 🌌📈

NASDAQ Future Weekly Technical Chart Analysis - 29 April - 3 May📊 NASDAQ 100 E-Mini Future Technical Chart Analysis
📅 18 June Future
🎯 Range Point: 17846
🎯 Weekly Range: 753
📉 Buy Above: 17614
📉 Average At: 17525
🎯 Buy Target 1: 18311
🎯 Buy Target 2: 18599
🛑 Buyer Stoploss: 17363
📉 Sale Below: 17436
🎯 Sale Target 1: 17380
🎯 Sale Target 2: 17093
🛑 Seller Stoploss: 17687
Don't forget to reciprocate your love by boosting, following and responding, your actions fuel my efforts to do even better for you!
#NASDAQ #NASDAQ100 #NASDAQFuture #Nasdaq100EMiniFuture

NASDAQ 100 E-Mini Future Technical Chart Weekly Analysis
📊 NASDAQ 100 E-Mini Future Technical Chart Analysis
📅 18 June Future
🎯 Range Trigger Point: 17181
🎯 Weekly Range: 1238 Point
📉 Buy Above: 17878
📉 Average At: 17732
🎯 Buy Target 1: 17946
🎯 Buy Target 2: 18418
🛑 Buyer Stoploss: 17466
📉 Sale Below: 17586
🎯 Sale Target 1: 16416
🎯 Sale Target 2: 15943
🛑 Seller Stoploss: 17998
Please follow/boost or respond what do you think of this trade. You actions fuel me to work ever harder to provide directional trade and save the traders from any shock from the market.
#NASDAQ #NASDAQ100 #NASDAQFuture #Nasdaq100EMiniFuture
NASDAQ 100 E-Mini Future Weekly Technical Analysis
Traders preparing for NASDAQ 100 E-Mini Future should anticipate a dynamic week ahead, guided by distinct levels and a delineated weekly range.
Key Levels:
Range Point: 17181
Weekly Range: 1238 points
Buy Scenario:
For traders inclined towards long positions, closely monitoring the market for an upsurge beyond 17878 is essential. Establishing an entry at 17732 could secure a stable average position. Targets for buyers are set at 17946 and 18418, reflecting potential bullish momentum. To mitigate downside risk, it's prudent to implement a stop-loss at 17466.
Sell Scenario:
Alternatively, a decline below 17586 might offer opportunities for short positions. Sellers eyeing targets at 16416 and 15943 should exercise caution. Implementing robust risk management strategies is essential, with a stop-loss set at 17998 to safeguard against potential losses.
As traders navigate the NASDAQ 100 E-Mini Future, a comprehensive grasp of these levels and disciplined risk management practices will be pivotal for capitalizing on opportunities while mitigating risks effectively.

NASDAQ 100 E-Mini Future Weekly Technical Chart Analysis 15-19"Nasdaq100 E-Mini 18 June Future Technical Chart Weekly Analysis for 15-19 April, 24
📊 Range Point: 18179
📈 Weekly Range: 465
🎯 Buy Above: 18341
🎯 Average At: 18286
🎯 Buy Target 1: 18467
🎯 Buy Target 2: 18645
🛑 Buyer Stoploss: 18186
📉 Sale Below: 18231
🎯 Sale Target 1: 17892
🎯 Sale Target 2: 17714
🛑 Seller Stoploss: 18386
Don't forget to reciprocate your love by boosting, following and responding, your actions fuel my efforts to do even better for you!
#NASDAQ #NASDAQ100 #NASDAQFuture #Nasdaq100EMiniFuture


📈 NASDAQ E-Mini Future Weekly Analysis📈 NASDAQ E-Mini Future DEC
Weekly Range: 608.50 Points
💰 Buy at 18458.8
🔄 Add one lot at 18387
🎯 Target 1: 18673.3
🎯 Target 2: 18905.75
🔒 Std. SL at 18255.97
🎯 Pref. SL at 18315.1
💲 Sell at 18315.2 with Targets:
🎯 Target 1: 17921.2
🎯 Target 2: 17688.75
🔒 Std. SL at 18524.02
🎯 Pref. SL at 18458.9

NASDAQ E-Mini Future Analysis for Today 19 Jan' 2024📊 NASDAQ Buy Levels
📈 Buy at 17014.4
🎯 Target: 17282.65 / 17394
🔍 Add one lot at 16980
📉 Sell at 16945.6
🎯 Target: 16922.35 / 16811
Resiprocate your love by following, sharing and commenting. Trade with trends to turn green!

NASDAQ 100 FUTURES TREND NOWTREND - NEGATIVE
PRESENT ZONE- Bounced from Demand zone now.
PRE HIGH
FORECAST -As per ZONE,
As bounce from demand zone will target 1st supply zone.
MY TAKE-
as lots of supply zones,TL resistance are there only gap up/Positive news flow required to go above.
Grinding expected as below also weeky demand zones are there.
(Note-only make entry at DEMAND ZONE's & Exit at SUPPLY ZONE's for BETTER RISK REWARD)
IF FOUND USEFUL KINDLY CLICK BOOST ICON


EURUSD GBPUSD USDCAD NQ price action today EURUSD remains a buyer. The preference is defined tomorrow at the opening of Europe. At 1.0680 it becomes a buy until 1.07. If seller opens tomorrow we will evaluate sales below 1.0650. As long as we are above 1.0650 we prefer buying strategies around 1.07 as a target.
GBPUSD remains a buyer. Above 1.22 we prefer purchase strategies. We will wait for tomorrow’s opening to evaluate buyers above 1.22 again. Purchases above 1.2250 must be confirmed and in search of targets at 1.2280.
USDCAD remained a seller on the day. Below 1.37 the preference remains selling. If it passes 1.3660, sales are activated up to 1.3650.
XAUUSD unchanged. No opportunity present. Standby preference.

NASDAQ SHORTif we get a 4hr candle close below 14610. then we plan short trades targeting next support zones.
