$XAU BEARS TO ENTER ?Seems like the gold is in down trend due to global markets tension easing out and gold not being a safe haven any more. As per the analysis seems like it can potentially go down $3220 won't be that easy ( until DJT says something crazy about tariffs on China ).
Let's see How well does this pan out and looking forward to accumulating OANDA:XAUUSD around $3200 zones
Micro Gold Futures
No trades
Market insights

GOLD Looking ready for 5% upside in 3-4 WeeksGOLD Looking ready for 5% upside in 3-4 Weeks.
Gold Hourly chart shows breakout from Flag Pattern targets coming as 100000+ in coming 3-4 weeks.
Happy Investing.

Institution Trading part 5Institutional trading involves buying and selling financial assets on behalf of institutions, such as big funds or investment banks. These large companies have dedicated teams consisting of analysts and traders who work together to make optimal trades.

Gold sell given at 97100 safe traders can book profit risky holdHow to take trades using Harmonic pattern projection Trade setup is explained below :-
Entry : 1st SL point : 0% is recent top or bottom.
Trailing D: 15.1% is work as trailing SL of buy or sell trade if hit then we have to book profit
.If price goes below 2nd D 22.5% to 24.5% range then early traders can make fresh reversals trade after breaking 1st D 15.1% safe traders can reversal trade after breaking Point D 22.5.4% to 24.5% range
Targets :
Target T1 : 36.1% to 38.3%
Target T3 : 49.1% to 52.5%
T3: 60.9% to 64.8% is our 3rd Target since this is reversal zone so must book profit if break then take fresh trade again
Target T4 : 76.4% to 79.7%
Next Targets are 100% , 127.2% ,141.4% and final Target 161.8%.
How to take reversal trade :
If price going upside/ downside then then buy or sell levels appear on Chart ( Automatically show when price reach any reversal zone of harmonic projection ).
Trailing SL:
After reach 1st Target trail SL to just above or below cost ( for example we are holding sell trade from 100 1st Target 110 hit then move trailing sl to 104-105 and move SL as price move upside or Downside)
Re- Entry :
For Re-entry in any pull back Point D ( 15.1% ) is used for re-entry then SL recent high or low Point SL ( 0% ) .
Blue Line is 1st support/ Resistance
Green line is 2nd support/ resistance
Red line is 3rd Support/ resistance
Gold sell at 97100 after fed meeting 2500-2700 points fall comeHow to take trades using Harmonic pattern projection Trade setup is explained below :-
Entry : 1st SL point : 0% is recent top or bottom.
Trailing D: 15.1% is work as trailing SL of buy or sell trade if hit then we have to book profit
.If price goes below 2nd D 22.5% to 24.5% range then early traders can make fresh reversals trade after breaking 1st D 15.1% safe traders can reversal trade after breaking Point D 22.5.4% to 24.5% range
Targets :
Target T1 : 36.1% to 38.3%
Target T3 : 49.1% to 52.5%
T3: 60.9% to 64.8% is our 3rd Target since this is reversal zone so must book profit if break then take fresh trade again
Target T4 : 76.4% to 79.7%
Next Targets are 100% , 127.2% ,141.4% and final Target 161.8%.
How to take reversal trade :
If price going upside/ downside then then buy or sell levels appear on Chart ( Automatically show when price reach any reversal zone of harmonic projection ).
Trailing SL:
After reach 1st Target trail SL to just above or below cost ( for example we are holding sell trade from 100 1st Target 110 hit then move trailing sl to 104-105 and move SL as price move upside or Downside)
Re- Entry :
For Re-entry in any pull back Point D ( 15.1% ) is used for re-entry then SL recent high or low Point SL ( 0% ) .
Blue Line is 1st support/ Resistance
Green line is 2nd support/ resistance
Red line is 3rd Support/ resistance

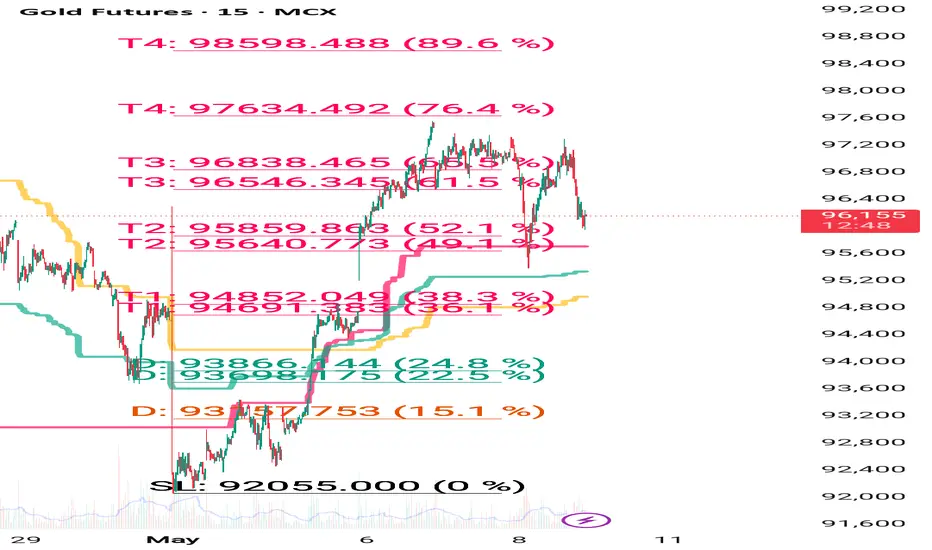
Gold premium members bought at 94600 booked at 96650 today How to take trades using Harmonic pattern projection Trade setup is explained below :-
Entry : 1st SL point : 0% is recent top or bottom.
Trailing D: 15.1% is work as trailing SL of buy or sell trade if hit then we have to book profit
.If price goes below 2nd D 22.5% to 24.5% range then early traders can make fresh reversals trade after breaking 1st D 15.1% safe traders can reversal trade after breaking Point D 22.5.4% to 24.5% range
Targets :
Target T1 : 36.1% to 38.3%
Target T3 : 49.1% to 52.5%
T3: 60.9% to 64.8% is our 3rd Target since this is reversal zone so must book profit if break then take fresh trade again
Target T4 : 76.4% to 79.7%
Next Targets are 100% , 127.2% ,141.4% and final Target 161.8%.
How to take reversal trade :
If price going upside/ downside then then buy or sell levels appear on Chart ( Automatically show when price reach any reversal zone of harmonic projection ).
Trailing SL:
After reach 1st Target trail SL to just above or below cost ( for example we are holding sell trade from 100 1st Target 110 hit then move trailing sl to 104-105 and move SL as price move upside or Downside)
Re- Entry :
For Re-entry in any pull back Point D ( 15.1% ) is used for re-entry then SL recent high or low Point SL ( 0% ) .
Blue Line is 1st support/ Resistance
Green line is 2nd support/ resistance
Red line is 3rd Support/ resistance

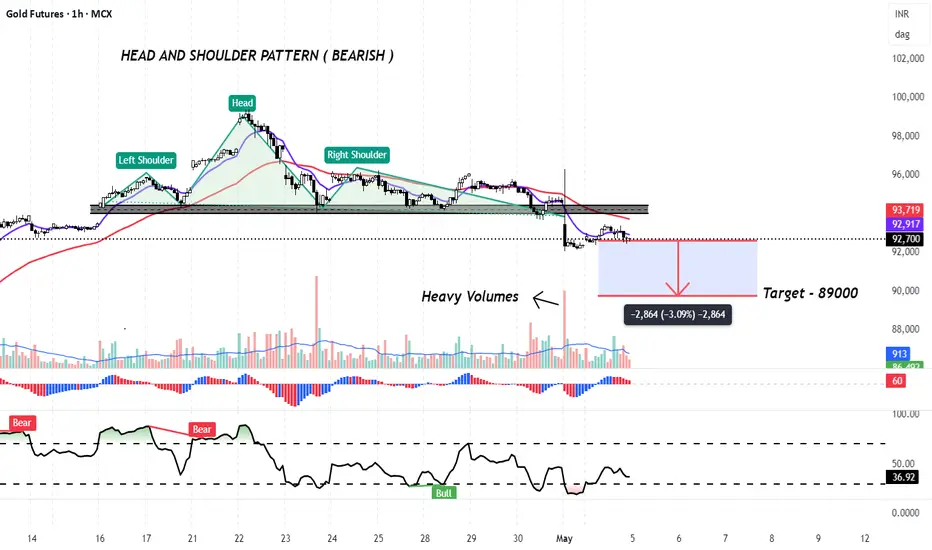
GOLD MCX - Head and Shoulder Pattern ( Bearish) in 1 our ChartGold Futures formed a Head & Shoulder Pattern on the 1 hour chart and given a breakout on the downside with strong volumes, confirming the validity of the pattern and the breakout.
The HNS target comes to Rs.89000 which is good further 3% from the current prices. However the Stop loss is very steep so one can wait for some pullback for entry.
CMP- Rs. 92637
TARGET-Rs. 89000
SL - 94950
Disclaimer: This is not a buy/sell recommendation. For educational purpose only. Kindly consult your financial advisor before entering a trade.
Gold sell on rise will continue on next week ,91200,89500 TargetHow to take trades using Harmonic pattern projection Trade setup is explained below :-
Entry : 1st SL point : 0% is recent top or bottom.
Trailing D: 15.1% is work as trailing SL of buy or sell trade if hit then we have to book profit
.If price goes below 2nd D 22.5% to 24.5% range then early traders can make fresh reversals trade after breaking 1st D 15.1% safe traders can reversal trade after breaking Point D 22.5.4% to 24.5% range
Targets :
Target T1 : 36.1% to 38.3%
Target T3 : 49.1% to 52.5%
T3: 60.9% to 64.8% is our 3rd Target since this is reversal zone so must book profit if break then take fresh trade again
Target T4 : 76.4% to 79.7%
Next Targets are 100% , 127.2% ,141.4% and final Target 161.8%.
How to take reversal trade :
If price going upside/ downside then then buy or sell levels appear on Chart ( Automatically show when price reach any reversal zone of harmonic projection ).
Trailing SL:
After reach 1st Target trail SL to just above or below cost ( for example we are holding sell trade from 100 1st Target 110 hit then move trailing sl to 104-105 and move SL as price move upside or Downside)
Re- Entry :
For Re-entry in any pull back Point D ( 15.1% ) is used for re-entry then SL recent high or low Point SL ( 0% ) .
Blue Line is 1st support/ Resistance
Green line is 2nd support/ resistance
Red line is 3rd Support/ resistance
Gold Trend directionGold has broke down from triangle pattern and has resistance at 95412 and target at 89458
Bear Volume is more than Bull Volume.

Gold is breaking out!Chart tells us that gold is breaking out of this trend line. SL would be below trendline.

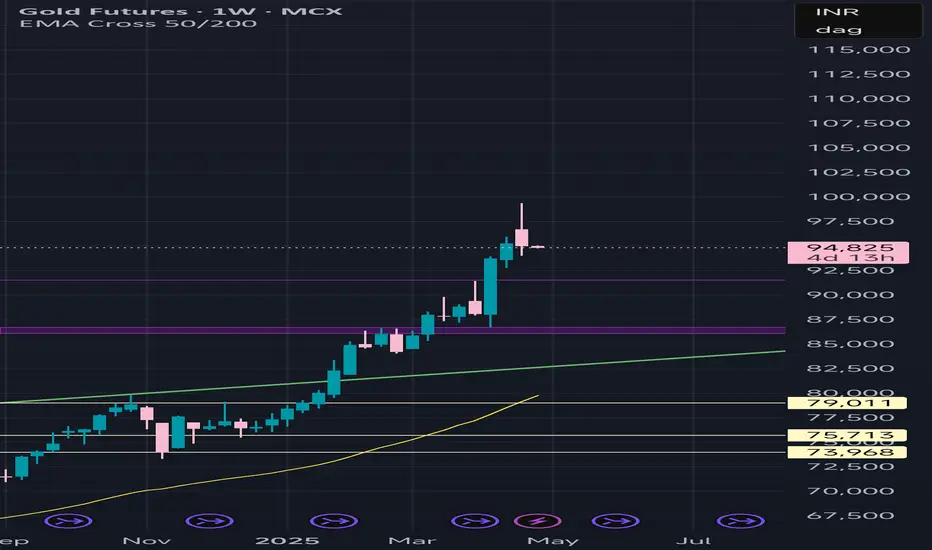
GOLD Breakout on Weekly charts suggest 90000+ in 1.5 - 2 Years.GOLD Breakout on Weekly charts suggest 90000+ Targets in 1.5 - 2 Years.
Multiple Chart Patterns breakout seen - Cup & Handle Pattern / Triangle breakout / Channel Bottom formation.
Happy Investing.

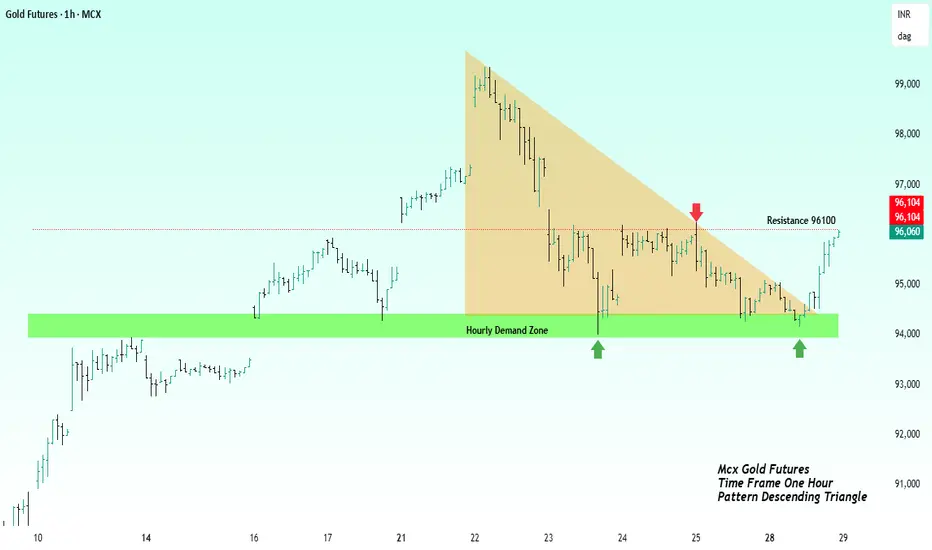
Gold Futures Charging at ResistanceHello Traders hope you are fine and doing well. Gold Futures are approaching a breakout above 96100 after strong demand zone defenses. This idea outlines a potential bullish setup awaiting confirmation for a momentum driven move.
Gold Futures (MCX) is currently forming a bullish setup with multiple rejections from a strong hourly demand zone and compression below the 96100 resistance level. A confirmed breakout above 96100 on the 1-hour timeframe will indicate renewed buying interest and a potential trend continuation.
Trade Plan-:
Entry: 1-hour candle close above 96100.
Stop Loss: To be defined post breakout, based on structure.
Target Levels:
97500, 98500, 99000
A decisive breakout with strong momentum will validate this setup.
Please note-: Final stop loss will be determined after the breakout confirmation.
Stay disciplined and manage risk carefully!
This publication is meant for only learning purpose and not contains any type of trading advice.
Best regards-: Amit
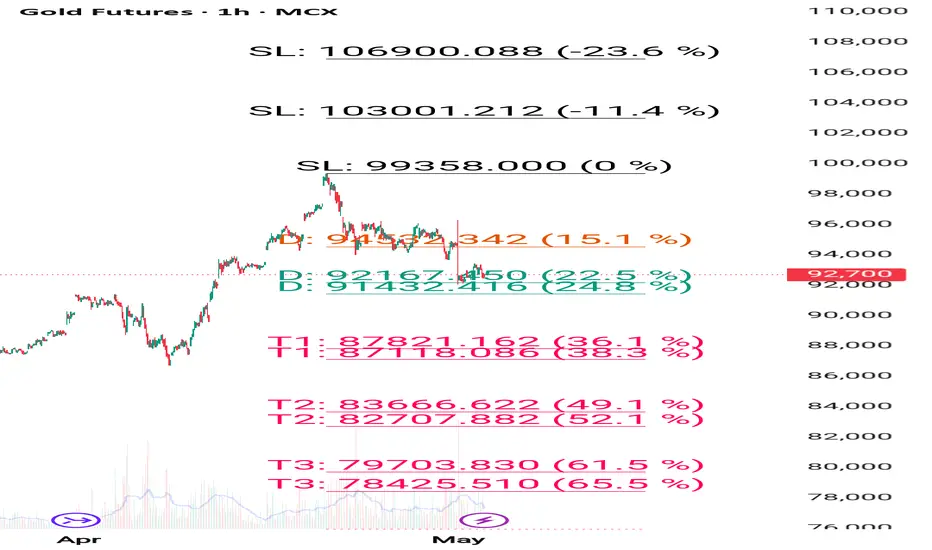
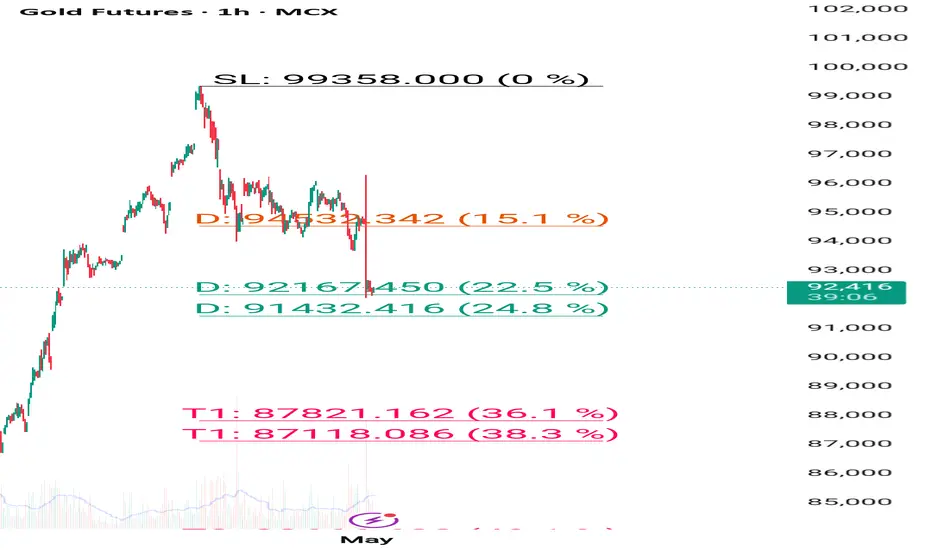
Gold mcx sell given below 93900 ,922200 Target hit How to take trades using Harmonic pattern projection Trade setup is explained below :-
Entry : 1st SL point : 0% is recent top or bottom.
Trailing D: 15.1% is work as trailing SL of buy or sell trade if hit then we have to book profit
.If price goes below 2nd D 22.5% to 24.5% range then early traders can make fresh reversals trade after breaking 1st D 15.1% safe traders can reversal trade after breaking Point D 22.5.4% to 24.5% range
Targets :
Target T1 : 36.1% to 38.3%
Target T3 : 49.1% to 52.5%
T3: 60.9% to 64.8% is our 3rd Target since this is reversal zone so must book profit if break then take fresh trade again
Target T4 : 76.4% to 79.7%
Next Targets are 100% , 127.2% ,141.4% and final Target 161.8%.
How to take reversal trade :
If price going upside/ downside then then buy or sell levels appear on Chart ( Automatically show when price reach any reversal zone of harmonic projection ).
Trailing SL:
After reach 1st Target trail SL to just above or below cost ( for example we are holding sell trade from 100 1st Target 110 hit then move trailing sl to 104-105 and move SL as price move upside or Downside)
Re- Entry :
For Re-entry in any pull back Point D ( 15.1% ) is used for re-entry then SL recent high or low Point SL ( 0% ) .
Blue Line is 1st support/ Resistance
Green line is 2nd support/ resistance
Red line is 3rd Support/ resistance
Gold mcx 96200 and 94000 range ,sell on rise will work better How to take trades using Harmonic pattern projection Trade setup is explained below :-
Entry : 1st SL point : 0% is recent top or bottom.
Trailing D: 15.1% is work as trailing SL of buy or sell trade if hit then we have to book profit
.If price goes below 2nd D 22.5% to 24.5% range then early traders can make fresh reversals trade after breaking 1st D 15.1% safe traders can reversal trade after breaking Point D 22.5.4% to 24.5% range
Targets :
Target T1 : 36.1% to 38.3%
Target T3 : 49.1% to 52.5%
T3: 60.9% to 64.8% is our 3rd Target since this is reversal zone so must book profit if break then take fresh trade again
Target T4 : 76.4% to 79.7%
Next Targets are 100% , 127.2% ,141.4% and final Target 161.8%.
How to take reversal trade :
If price going upside/ downside then then buy or sell levels appear on Chart ( Automatically show when price reach any reversal zone of harmonic projection ).
Trailing SL:
After reach 1st Target trail SL to just above or below cost ( for example we are holding sell trade from 100 1st Target 110 hit then move trailing sl to 104-105 and move SL as price move upside or Downside)
Re- Entry :
For Re-entry in any pull back Point D ( 15.1% ) is used for re-entry then SL recent high or low Point SL ( 0% ) .
Blue Line is 1st support/ Resistance
Green line is 2nd support/ resistance
Red line is 3rd Support/ resistance

Gold weekly chart candle at the top formed the inverted hammerInverted hammer candle at the top of the gold price likely to be trend reversal from here it may decrease to the level of 86500
It's just my opinion only it's not advise or suggestion
Gold mcx 93900 and 96200 range either side will give movement How to take trades using Harmonic pattern projection Trade setup is explained below :-
Entry : 1st SL point : 0% is recent top or bottom.
Trailing D: 15.1% is work as trailing SL of buy or sell trade if hit then we have to book profit
.If price goes below 2nd D 22.5% to 24.5% range then early traders can make fresh reversals trade after breaking 1st D 15.1% safe traders can reversal trade after breaking Point D 22.5.4% to 24.5% range
Targets :
Target T1 : 36.1% to 38.3%
Target T3 : 49.1% to 52.5%
T3: 60.9% to 64.8% is our 3rd Target since this is reversal zone so must book profit if break then take fresh trade again
Target T4 : 76.4% to 79.7%
Next Targets are 100% , 127.2% ,141.4% and final Target 161.8%.
How to take reversal trade :
If price going upside/ downside then then buy or sell levels appear on Chart ( Automatically show when price reach any reversal zone of harmonic projection ).
Trailing SL:
After reach 1st Target trail SL to just above or below cost ( for example we are holding sell trade from 100 1st Target 110 hit then move trailing sl to 104-105 and move SL as price move upside or Downside)
Re- Entry :
For Re-entry in any pull back Point D ( 15.1% ) is used for re-entry then SL recent high or low Point SL ( 0% ) .
Blue Line is 1st support/ Resistance
Green line is 2nd support/ resistance
Red line is 3rd Support/ resistance

Gold mcx avoid fresh sell trade we booked yesterday near 94300 How to take trades using Harmonic pattern projection Trade setup is explained below :-
Entry : 1st SL point : 0% is recent top or bottom.
Trailing D: 15.1% is work as trailing SL of buy or sell trade if hit then we have to book profit
.If price goes below 2nd D 22.5% to 24.5% range then early traders can make fresh reversals trade after breaking 1st D 15.1% safe traders can reversal trade after breaking Point D 22.5.4% to 24.5% range
Targets :
Target T1 : 36.1% to 38.3%
Target T3 : 49.1% to 52.5%
T3: 60.9% to 64.8% is our 3rd Target since this is reversal zone so must book profit if break then take fresh trade again
Target T4 : 76.4% to 79.7%
Next Targets are 100% , 127.2% ,141.4% and final Target 161.8%.
How to take reversal trade :
If price going upside/ downside then then buy or sell levels appear on Chart ( Automatically show when price reach any reversal zone of harmonic projection ).
Trailing SL:
After reach 1st Target trail SL to just above or below cost ( for example we are holding sell trade from 100 1st Target 110 hit then move trailing sl to 104-105 and move SL as price move upside or Downside)
Re- Entry :
For Re-entry in any pull back Point D ( 15.1% ) is used for re-entry then SL recent high or low Point SL ( 0% ) .
Blue Line is 1st support/ Resistance
Green line is 2nd support/ resistance
Red line is 3rd Support/ resistance

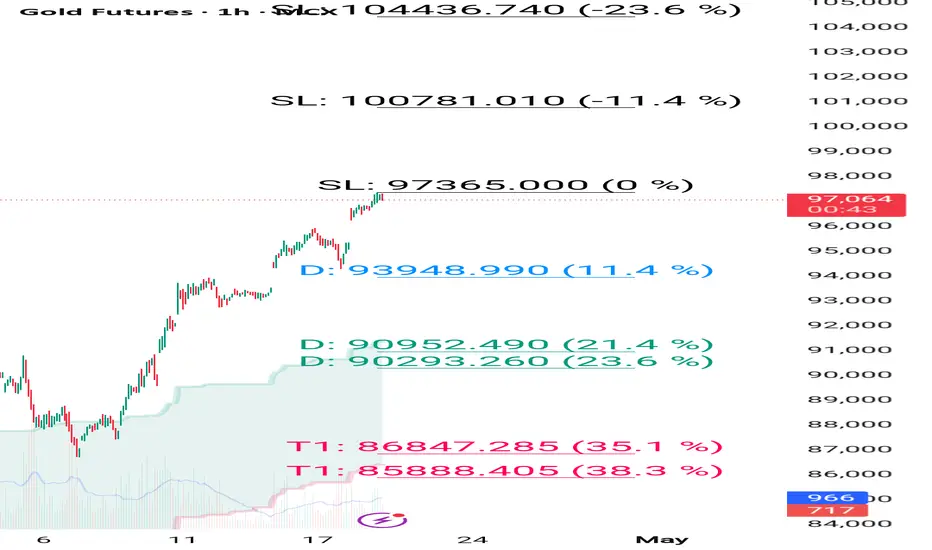
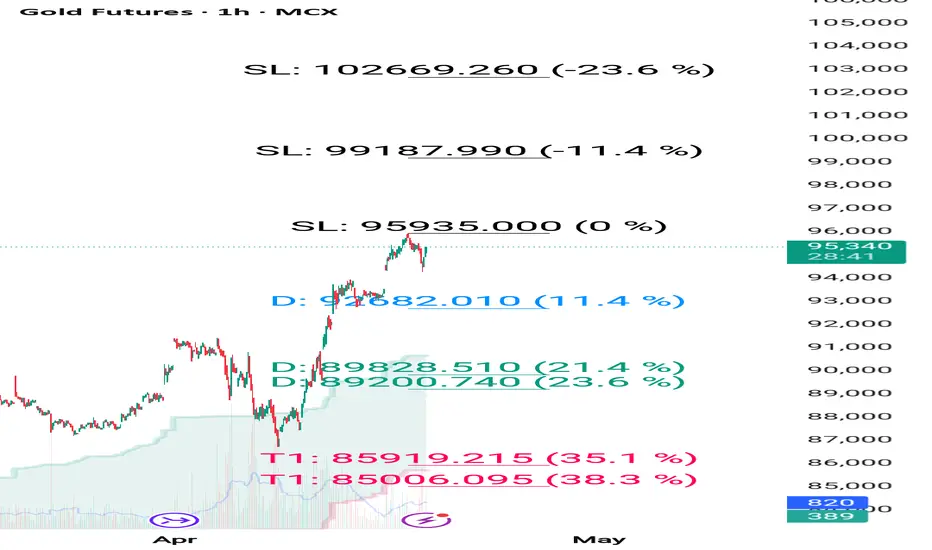
Gold profit booking started sell on every rise near resistance How to take trades using Harmonic pattern projection Trade setup is explained below :-
Entry : 1st SL point : 0% is recent top or bottom.
Trailing D: 11.4% is work as trailing SL of buy or sell trade if hit then we have to book profit
.If price goes below 2nd D 21.4% to 23.6% range then early traders can make fresh reversals trade after breaking 1st D 11.4% safe traders can reversal trade after breaking Point D 21.4% to 23.6% range
Targets :
Target T1 : 35.1% to 38.3%
Target T3 : 49.1% to 53.2%
T3: 60.9% to 64.8% is our 3rd Target since this is reversal zone so must book profit if break then take fresh trade again
Target T4 : 76.4% to 79.7%
Next Targets are 100% , 127.2% ,141.4% and final Target 161.8%.
How to take reversal trade :
If price going upside/ downside then then buy or sell levels appear on Chart ( Automatically show when price reach any reversal zone of harmonic projection pattern based .
After showing reversal levels wait for confirmation until 21.4% or 28.3 % level not break if break then exit from current buy / sell trade and take fresh reverse trade buy/ sell .
Trailing SL:
After reach 1st Target trail SL to just above or below cost ( for example we are holding sell trade from 100 1st Target 110 hit then move trailing sl to 104-105 and move SL as price move upside or Downside)
Re- Entry :
For Re-entry in any pull back Point D ( 11.4% ) is used for re-entry then SL recent high or low Point SL ( 0% ) .
Blue Line is 1st support/ Resistance
Green line is 2nd support/ resistance
Red line is 3rd Support/ resistance

Gold mcx buy given above 95500 enjoy huge profit How to take trades using Harmonic pattern projection Trade setup is explained below :-
Entry : 1st SL point : 0% is recent top or bottom.
Trailing D: 11.4% is work as trailing SL of buy or sell trade if hit then we have to book profit
.If price goes below 2nd D 21.4% to 23.6% range then early traders can make fresh reversals trade after breaking 1st D 11.4% safe traders can reversal trade after breaking Point D 21.4% to 23.6% range
Targets :
Target T1 : 35.1% to 38.3%
Target T3 : 49.1% to 53.2%
T3: 60.9% to 64.8% is our 3rd Target since this is reversal zone so must book profit if break then take fresh trade again
Target T4 : 76.4% to 79.7%
Next Targets are 100% , 127.2% ,141.4% and final Target 161.8%.
How to take reversal trade :
If price going upside/ downside then then buy or sell levels appear on Chart ( Automatically show when price reach any reversal zone of harmonic projection pattern based .
After showing reversal levels wait for confirmation until 21.4% or 28.3 % level not break if break then exit from current buy / sell trade and take fresh reverse trade buy/ sell .
Trailing SL:
After reach 1st Target trail SL to just above or below cost ( for example we are holding sell trade from 100 1st Target 110 hit then move trailing sl to 104-105 and move SL as price move upside or Downside)
Re- Entry :
For Re-entry in any pull back Point D ( 11.4% ) is used for re-entry then SL recent high or low Point SL ( 0% ) .
Blue Line is 1st support/ Resistance
Green line is 2nd support/ resistance
Red line is 3rd Support/ resistance
Gold mcx buy only above ATH sell below 94450How to take trades using Harmonic pattern projection Trade setup is explained below :-
Entry : 1st SL point : 0% is recent top or bottom.
Trailing D: 11.4% is work as trailing SL of buy or sell trade if hit then we have to book profit
.If price goes below 2nd D 21.4% to 23.6% range then early traders can make fresh reversals trade after breaking 1st D 11.4% safe traders can reversal trade after breaking Point D 21.4% to 23.6% range
Targets :
Target T1 : 35.1% to 38.3%
Target T3 : 49.1% to 53.2%
T3: 60.9% to 64.8% is our 3rd Target since this is reversal zone so must book profit if break then take fresh trade again
Target T4 : 76.4% to 79.7%
Next Targets are 100% , 127.2% ,141.4% and final Target 161.8%.
How to take reversal trade :
If price going upside/ downside then then buy or sell levels appear on Chart ( Automatically show when price reach any reversal zone of harmonic projection pattern based .
After showing reversal levels wait for confirmation until 21.4% or 28.3 % level not break if break then exit from current buy / sell trade and take fresh reverse trade buy/ sell .
Trailing SL:
After reach 1st Target trail SL to just above or below cost ( for example we are holding sell trade from 100 1st Target 110 hit then move trailing sl to 104-105 and move SL as price move upside or Downside)
Re- Entry :
For Re-entry in any pull back Point D ( 11.4% ) is used for re-entry then SL recent high or low Point SL ( 0% ) .
Blue Line is 1st support/ Resistance
Green line is 2nd support/ resistance
Red line is 3rd Support/ resistance
GOLD can move up 15% in coming 6-8 Months based on Weekly ChartsGOLD can move up 15% in coming 6-8 Months based on Weekly Charts.
Weekly Chart shows breakout from Flag pattern.
LTP - 74321
Targets - 86000+
Timeframe - 8-10 Months.
Happy Investing.

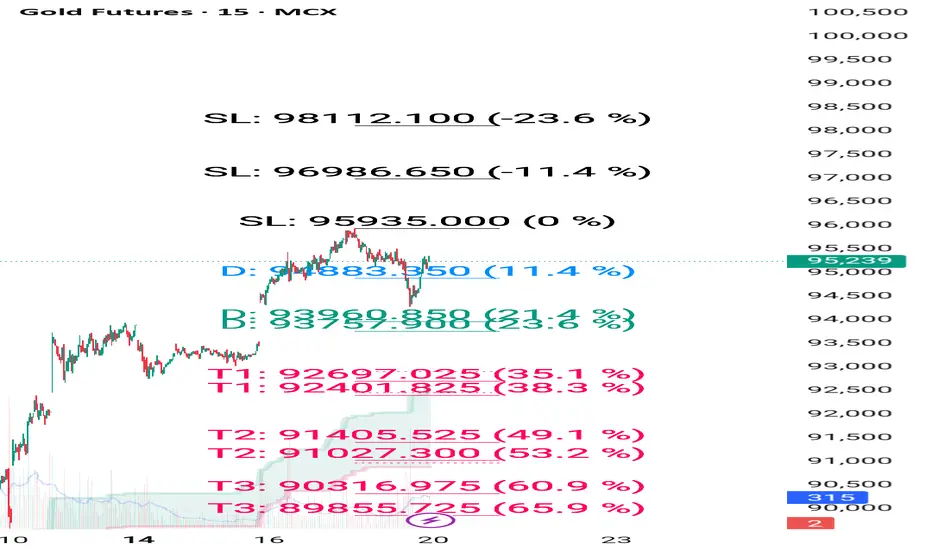
Gold mcx positional support and resistance levels How to take trades using Harmonic pattern projection Trade setup is explained below :-
Entry : 1st SL point : 0% is recent top or bottom.
Trailing D: 11.4% is work as trailing SL of buy or sell trade if hit then we have to book profit
.If price goes below 2nd D 21.4% to 23.6% range then early traders can make fresh reversals trade after breaking 1st D 11.4% safe traders can reversal trade after breaking Point D 21.4% to 23.6% range
Targets :
Target T1 : 35.1% to 38.3%
Target T3 : 49.1% to 53.2%
T3: 60.9% to 64.8% is our 3rd Target since this is reversal zone so must book profit if break then take fresh trade again
Target T4 : 76.4% to 79.7%
Next Targets are 100% , 127.2% ,141.4% and final Target 161.8%.
How to take reversal trade :
If price going upside/ downside then then buy or sell levels appear on Chart ( Automatically show when price reach any reversal zone of harmonic projection pattern based .
After showing reversal levels wait for confirmation until 21.4% or 28.3 % level not break if break then exit from current buy / sell trade and take fresh reverse trade buy/ sell .
Trailing SL:
After reach 1st Target trail SL to just above or below cost ( for example we are holding sell trade from 100 1st Target 110 hit then move trailing sl to 104-105 and move SL as price move upside or Downside)
Re- Entry :
For Re-entry in any pull back Point D ( 11.4% ) is used for re-entry then SL recent high or low Point SL ( 0% ) .
Blue Line is 1st support/ Resistance
Green line is 2nd support/ resistance
Red line is 3rd Support/ resistance
Gold mcx sell given at 93100 hold sell trade with sl of ATHHow to take trades using Harmonic pattern projection Trade setup is explained below :-
Entry : 1st SL point : 0% is recent top or bottom.
Trailing D: 11.4% is work as trailing SL of buy or sell trade if hit then we have to book profit
.If price goes below 2nd D 21.4% to 23.6% range then early traders can make fresh reversals trade after breaking 1st D 11.4% safe traders can reversal trade after breaking Point D 21.4% to 23.6% range
Targets :
Target T1 : 35.1% to 38.3%
Target T3 : 49.1% to 53.2%
T3: 60.9% to 64.8% is our 3rd Target since this is reversal zone so must book profit if break then take fresh trade again
Target T4 : 76.4% to 79.7%
Next Targets are 100% , 127.2% ,141.4% and final Target 161.8%.
How to take reversal trade :
If price going upside/ downside then then buy or sell levels appear on Chart ( Automatically show when price reach any reversal zone of harmonic projection pattern based .
After showing reversal levels wait for confirmation until 21.4% or 28.3 % level not break if break then exit from current buy / sell trade and take fresh reverse trade buy/ sell .
Trailing SL:
After reach 1st Target trail SL to just above or below cost ( for example we are holding sell trade from 100 1st Target 110 hit then move trailing sl to 104-105 and move SL as price move upside or Downside)
Re- Entry :
For Re-entry in any pull back Point D ( 11.4% ) is used for re-entry then SL recent high or low Point SL ( 0% ) .
Blue Line is 1st support/ Resistance
Green line is 2nd support/ resistance
Red line is 3rd Support/ resistance
