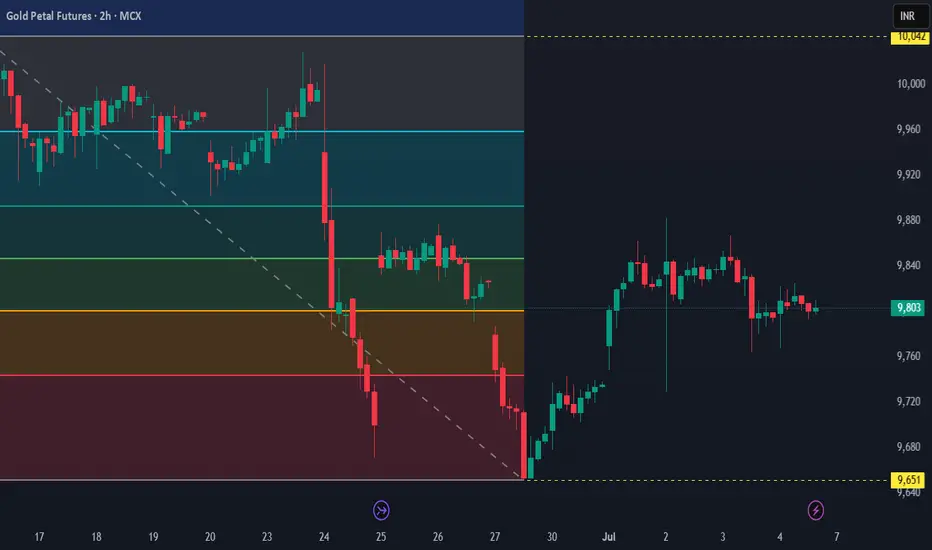
MCX GOLD Petal - market indecisionThe recent candles are choppy, with mixed direction and long wicks, reflecting market indecision and low conviction from both buyers and sellers. Price is hovering around the mid-range of the fall, indicating a range-bound structure with no clear breakout or breakdown yet. If the price breaks below ₹9740, it could retest the major support at ₹9651. Conversely, a breakout above ₹9850 with volume may invite a retest toward ₹9940 and ₹10000. Until then, the bias remains neutral-to-bearish, with volatility compressing inside a sideways band.
Micro Gold Futures
No trades
Market insights
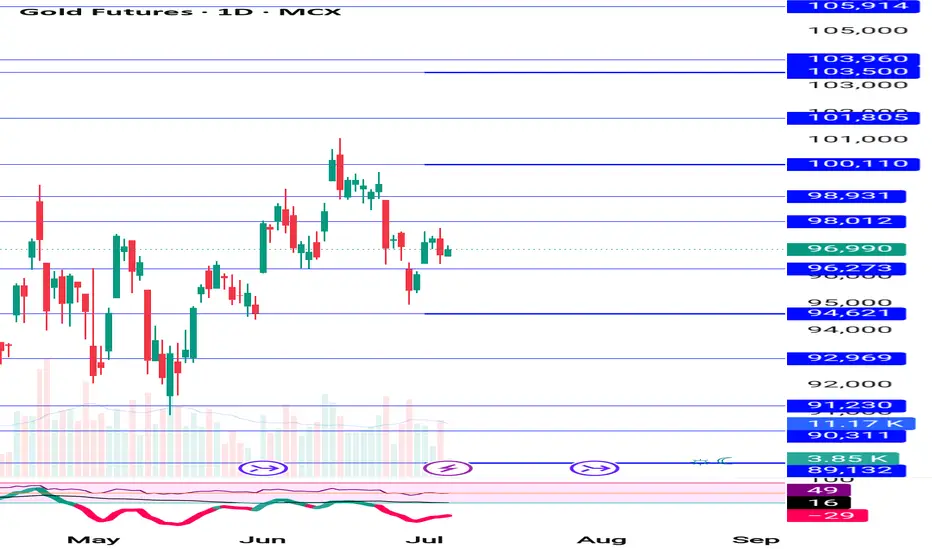
Gold 96988Gold 96988 is under pressure. Resistance at 98431 and support at 94041.
Signals shows some trend reversal
WE expect Gold will test the resistance before falling to support.
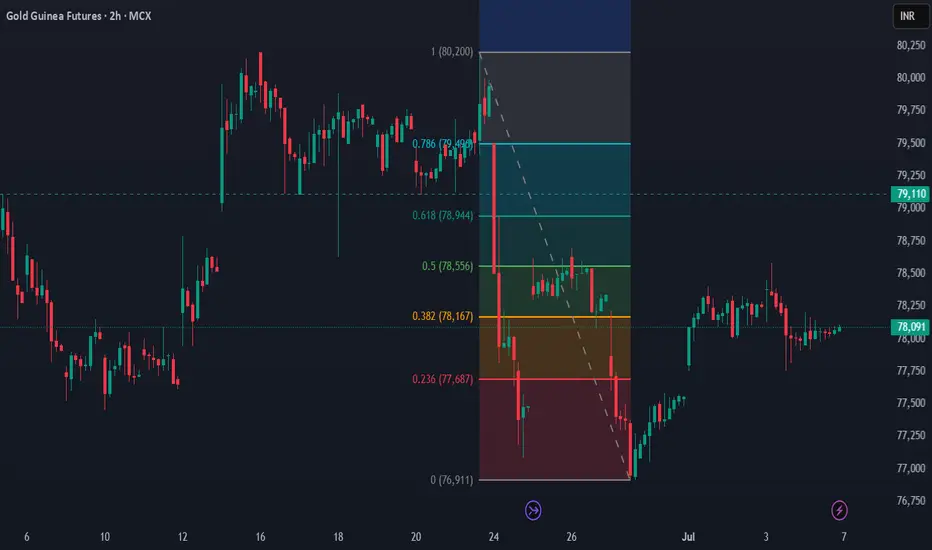
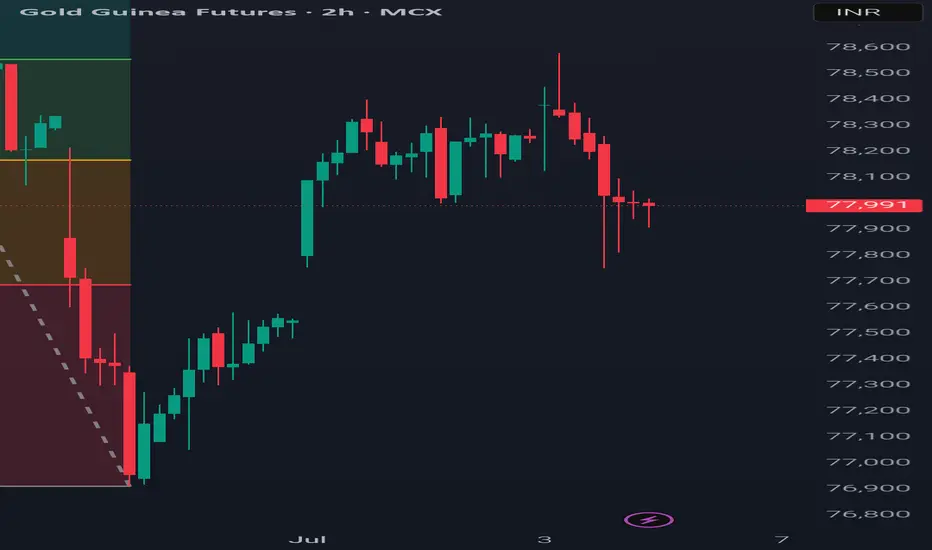
MCX Gold Guinea overall sentiment remains bearish to neutralMCX Gold Guinea July Futures are currently exhibiting signs of bearish consolidation after a steep sell-off from the ₹80670 levels, where strong resistance led to a decisive breakdown. The price has since retraced to the ₹78580 zone but failed to sustain above it, leading to a phase of tight range-bound movement between ₹77750 and ₹78580. Recent candlestick formations on the 2-hour chart show low volatility, narrow bodies, and compressed ranges, suggesting a potential build-up for a breakout. However, this consolidation resembles a bearish flag or rectangle—typically a continuation pattern favoring the prevailing downtrend. A break below ₹77750 could trigger a sharp move toward ₹77300 and ₹76900, while any breakout above ₹78580 with volume could invalidate this setup and push the price toward ₹79050–₹79230.
Momentum indicators also align with the bearish structure. The Money Flow Index (MFI) is currently at 28.64, indicating oversold territory, but without divergence or recovery—reflecting weak buying pressure and the risk of further downside. The MACD histogram, though flattening, still trades in the negative zone with no bullish crossover, suggesting that the selling momentum has cooled but buyers are not yet taking control. Together, these indicators suggest a market in pause mode, awaiting a decisive move.
From a fundamental standpoint, the gold market remains under pressure globally. Stronger U.S. macroeconomic data, particularly around jobs and inflation, has led to a delay in rate cut expectations by the Federal Reserve. This has strengthened the U.S. dollar and kept Treasury yields elevated, both of which are traditionally bearish for non-yielding assets like gold. Furthermore, safe-haven demand is subdued due to the absence of immediate geopolitical shocks. On the domestic front, the Indian rupee remains stable, and seasonal gold demand has softened post-Akshaya Tritiya, contributing to the muted movement in MCX prices. Jewelry demand has not picked up significantly, and speculative positions are cautious.
In conclusion, Gold Guinea July Futures are caught between technical compression and macroeconomic resistance, with bias tilted toward the downside unless ₹78580 is decisively breached. Traders should watch for a breakdown below ₹77750 for bearish continuation or a breakout above ₹78580 for any bullish relief. Until then, the overall sentiment remains bearish to neutral, supported by both price action and macro fundamentals.
GOLD NEXT WEEK 7 TO 11 JULY
gold next week 40% bullish 60% bearish upside cap near 98400 to 99000 downside 96000,95640 break then next bais 93500

Gold MCX levels for next week Range bound to Negative biase How My Harmonic pattern projection Indicator work is explained below :
Recent High or Low :
D-0% is our recent low or high
Profit booking zone: D13% -D15% is
range if break them profit booking start on uptrend or downtrend but only profit booking, trend not changed
SL reversal zone : SL 23% and SL 25% is reversal zone if break then trend reverse and we can take reverse trade
Target : T1, T2, T3, T4 and .
Are our Target zone
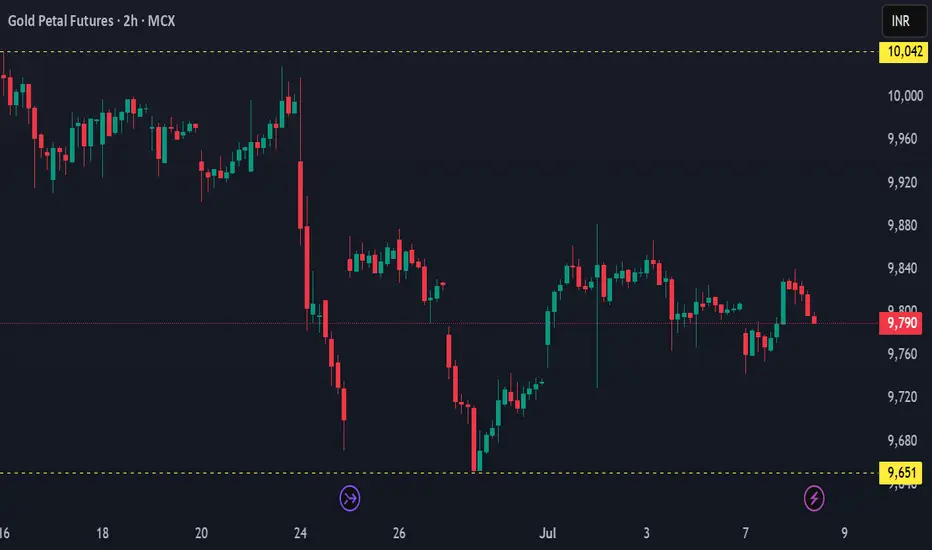
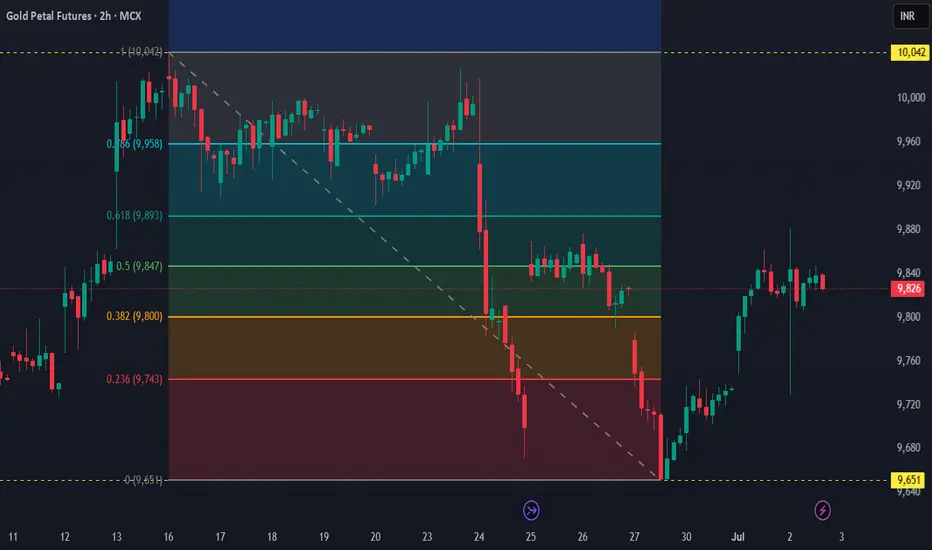
GOLDPETAL JULY – RANGE PLAY BEFORE DECISION MOVEThe 2-hour chart of Gold Petal July shows a classic range-bound structure between ₹9729 (support) and ₹9882 (resistance) after a steep drop from the ₹10064 zone. Post sell-off, the price staged a recovery but has repeatedly faced rejection near ₹9882, forming lower highs. The current candles around ₹9800 are small and indecisive, indicating a lack of momentum. The narrow consolidation zone with reduced volume suggests that the market is waiting for a breakout trigger. Traders should watch for a breakout above ₹9882 for a potential short-term bullish move, or a breakdown below ₹9729 to resume the downtrend.
Fundamentally, Gold remains influenced by global macro data and U.S. rate expectations. Recent hawkish tones from the Federal Reserve, coupled with stronger-than-expected economic resilience, have pressured precious metals. This has kept speculative interest low, evident in the low-volatility zones like the one seen here. In India, weak festive demand and a stable rupee are limiting upside in MCX Gold Petal. However, if geopolitical risks or U.S. job data weaken the dollar, gold could break higher. Until then, range trading remains the most probable scenario with tight stop-losses.
Gold Guinea Show Signs of Short-Term Weakness Amids ConolidationThe 2-hour candlestick chart of Gold Guinea July Futures indicates a strong bearish sentiment. After facing resistance near the 78450–78500 zone, the price faced a steep fall, forming consecutive bearish candles. The recent candles are consolidating near the 77950–78000 support level, suggesting a potential pause or indecision after the sharp drop. The presence of long lower wicks shows buying interest at lower levels, but the lack of bullish follow-through suggests that bears are still in control. The absence of higher highs and consistent lower lows confirm a short-term downtrend. A break below 77950 could open the gates to test 77700, while resistance remains near 78250.
Fundamentally, gold is currently under pressure due to a combination of rising US Treasury yields and expectations that the Federal Reserve may delay rate cuts amidst sticky inflation. Investors are preferring dollar-backed assets, leading to outflows from precious metals. Additionally, global risk sentiment remains relatively stable, reducing safe-haven demand. However, geopolitical tensions and potential recessionary fears continue to provide a long-term bullish backdrop for gold. In the Indian context, rupee movement and import policies also impact local gold futures pricing. Until clarity emerges on US economic direction, gold may remain choppy with a short-term bearish bias.
Gold Petal Futures Coil Near ₹9829 – Calm Before the Move?Gold Petal July Futures is currently showing signs of range-bound consolidation after a sharp recovery from the recent low of ₹9651. The price surged aggressively in the last leg but is now hovering around ₹9829 with multiple small-bodied candles, indicating indecision and balance between bulls and bears. Previous sessions show a strong bullish impulse followed by a flattening structure, suggesting that momentum is cooling off. This tight consolidation just below recent swing highs indicates that buyers are hesitant to push higher without a fresh trigger, while sellers are also not aggressively stepping in.
A breakout above ₹9840 with strong volume could trigger a fresh upward rally, while a fall below ₹9780 may lead to a minor correction. This current price action resembles a bullish flag or base-building phase, and traders should wait for a clear directional move before entering. Until then, the structure is neutral with a slight bullish bias.
This consolidation comes at a time when global gold markets are reacting to mixed signals—rising geopolitical tensions are offering support, while strong US economic data and hawkish Fed commentary are limiting upside. Domestic festive demand and favourable rupee movement are lending local strength, but the market remains cautious ahead of key macro data. Until clearer global triggers emerge, this zone between ₹9,826 and ₹9,880 may act as a supply ceiling, with traders needing confirmation before betting on the next leg.
Gold mcx buy given at 96050 , book profit now at 97550, How My Harmonic pattern projection Indicator work is explained below :
Recent High or Low :
D-0% is our recent low or high
Profit booking zone: D13% -D15% is
range if break them profit booking start on uptrend or downtrend but only profit booking, trend not changed
SL reversal zone : SL 23% and SL 25% is reversal zone if break then trend reverse and we can take reverse trade
Target : T1, T2, T3, T4 and .
Are our Target zone

Gold mcx 99500 to100300 upside target until Friday low not brekaHow My Harmonic pattern projection Indicator work is explained below :
Recent High or Low :
D-0% is our recent low or high
Profit booking zone: D13% -D15% is
range if break them profit booking start on uptrend or downtrend but only profit booking, trend not changed
SL reversal zone : SL 23% and SL 25% is reversal zone if break then trend reverse and we can take reverse trade
Target : T1, T2, T3, T4 and .
Are our Target zone
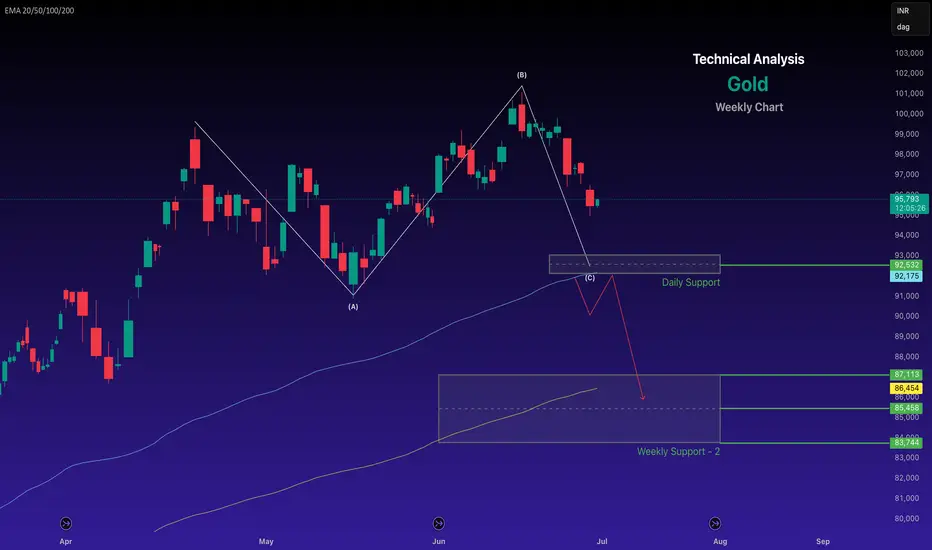
Gold retains a bearish trend after breaching support.Weekly Technical Analysis for Gold
Chart for the reference
- Disclaimer --
This analysis is based on recent technical data and market sentiment from web sources. It is for informational purposes only and not financial advice. Trading involves high risks, and past performance does not guarantee future results. Always conduct your own research or consult a SEBI-registered advisor before trading.
#Boost and comment will be highly appreciated
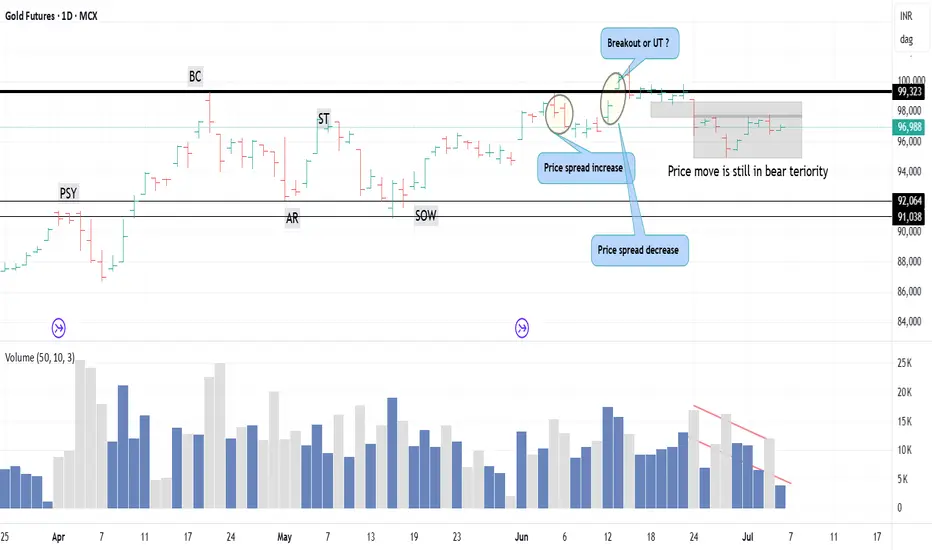
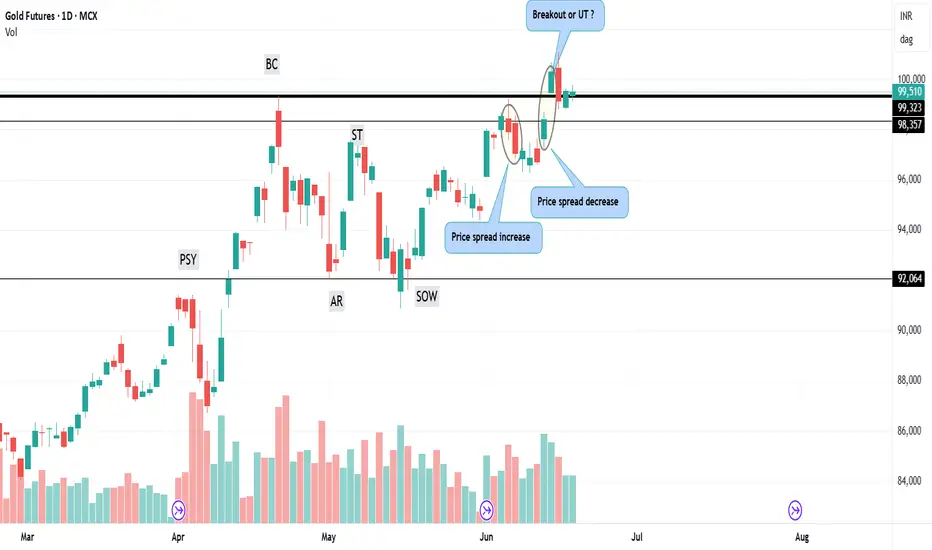
Gold breakout or fake?Gold 99510 - Is it on breakout or fake. Volume suggests no demand. Possibility to drop to 97150
Double Top Breakdown at Resistance ZoneThe chart reveals a classic Double Top pattern formation near the 3,360–3,480 resistance zone, followed by a clear bearish rejection (highlighted with red arrows). This confirms the presence of strong supply pressure in that region.
🔍 Key Technical Highlights:
🔺 Double Top Pattern
The price formed two swing highs near the resistance zone, failing to break above.
After the second peak, the price started declining, confirming the reversal pattern.
📉 Bearish Channel
The recent downtrend is contained within a descending channel, with consistent lower highs and lower lows.
Price broke below the neckline of the double top pattern around 3,270.
🎯 Target Projection
Based on the height of the double top pattern, the projected downside target is near 3,207.5, aligning perfectly with the support zone marked below.
🟠 Historical Support Areas
The large orange circles indicate key reaction points, confirming that the 3,207–3,220 area has acted as support in the past.
📊 Outlook:
If the current bearish momentum continues, price is likely to head towards the support target zone at 3,207.5. Any pullback toward 3,320–3,350 could provide a shorting opportunity with stops above the recent highs.
🔧 Bias: Bearish
📍 Resistance: 3,360–3,480
📍 Support: 3,207–3,220
📍 Target: 3,207.5

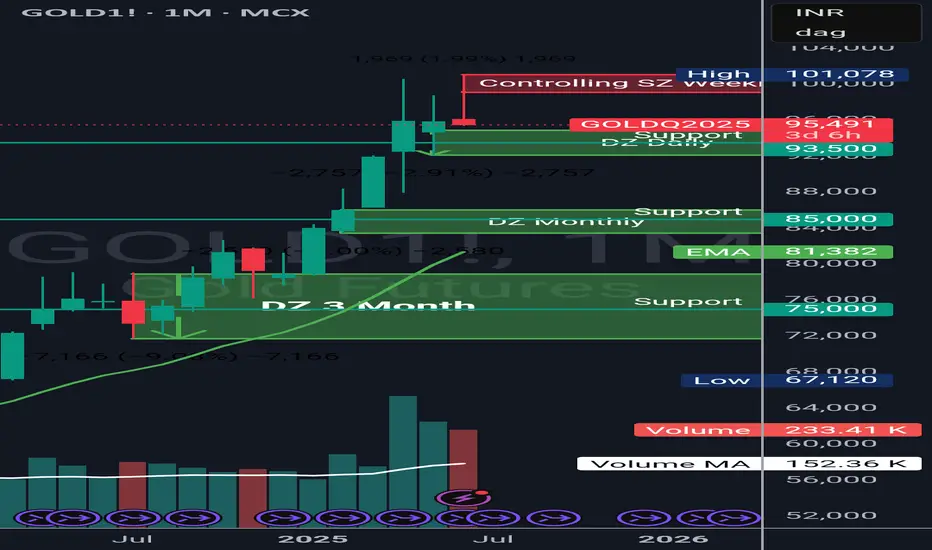
GOLD No more fall seen Gold is suppose to trade slight low but move is up side support lrvrlr is 92000upside target 110000 in comming month

Gold to loose its shine! Let's see how muchAfter a Fantastic Bull run for Gold.
I see it's loosing it shine to some extent.
It's time to kiss EMA20 (Monthly) after 2 Year when Gold last touches EMA 20 of Monthly time frame in OCT 2023 @ 62500. About 2 Years back.
Today Gold Future in MCX is 95500 There is a good support @ 93500 but if it breaks this convincingly it should loose its shine till 85000 where it would meet the EMA20 (Monthly).
This should happen in next 1-2 months.
In case it can't hold 85000 then the next level of support it would find @ 75000 to make it fair and lovely again.
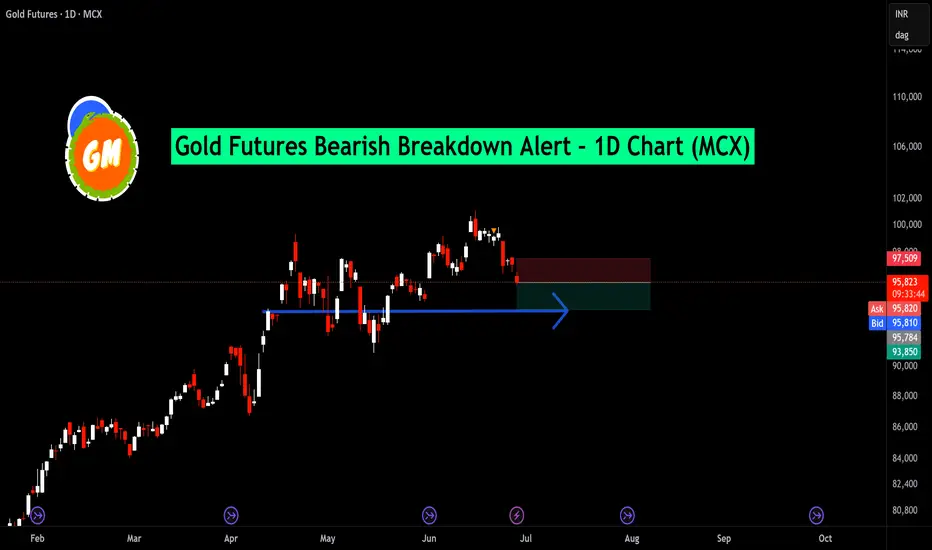
Gold Futures Bearish Breakdown Alert – 1D Chart (MCX)Gold Futures have breached a crucial support level around the ₹96,000–₹95,800 zone, indicating a potential shift in momentum. The breakdown below this horizontal support, confirmed by a strong red candle, opens the gates for a deeper correction.
🔻 Bearish Observations:
Price has broken down from a consolidation range.
The support zone marked by the blue line has failed to hold, triggering selling pressure.
Bearish engulfing structure suggests sellers are gaining control.
📌 Next Key Level to Watch:
Downside target lies near the ₹93,850 zone — marked by the green support block — which may act as the next demand area.
💡 Outlook:
As long as Gold sustains below the ₹96,000 resistance, the bias remains bearish. Traders may look for shorting opportunities on pullbacks with a tight stop-loss above the breakdown zone.
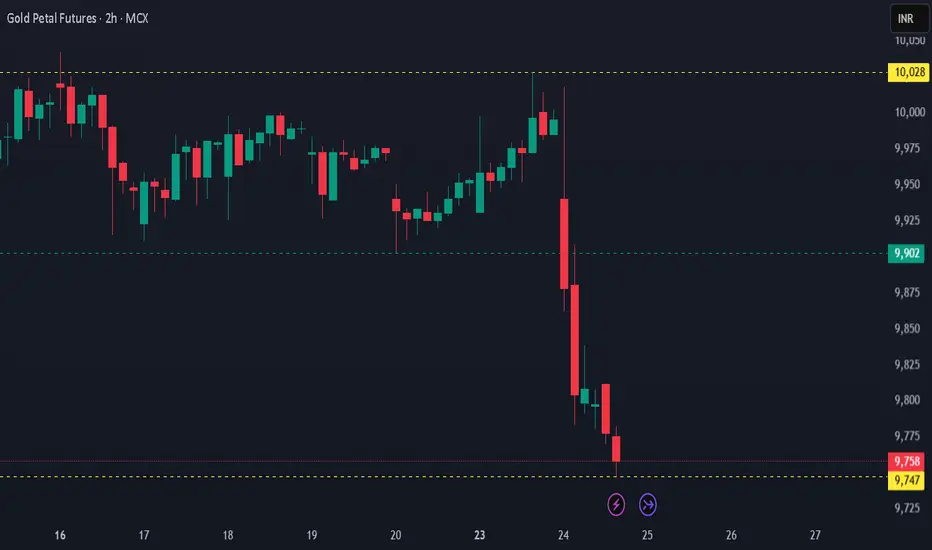
Gold Petal Futures Near Major Demand Zone – BUYING OPPORTUNITYGold Petal Futures (MCX, 2H) continue to trend lower, now hovering around ₹9,752 after a steep decline from the ₹10,028 resistance zone. The price has broken multiple support levels, including the critical ₹9,902 zone, and is now approaching the next major support near ₹9,671. The repeated lower highs and bearish candles reflect strong short-term selling, but the momentum is slowing, and price is nearing a potential accumulation zone. If ₹9,671 holds, it could act as a springboard for a reversal or at least a technical pullback.
From a macro perspective, this dip presents a value-buying opportunity for long-term investors. While the short-term weakness is driven by a stronger U.S. dollar, stable crude prices, and easing geopolitical tensions, the long-term fundamentals for gold remain robust. Central bank gold purchases, persistent inflation concerns, and upcoming festival-driven demand in India add to the bullish outlook. With gold now available at a discount from recent highs, staggered accumulation near ₹9,700–₹9,670 could offer favorable risk-reward for medium- to long-term portfolios.

Gold buy on dip recommended yesterday morning avoid sell trade How My Harmonic pattern projection Indicator work is explained below :
Recent High or Low :
D-0% is our recent low or high
Profit booking zone: D13% -D15% is
range if break them profit booking start on uptrend or downtrend but only profit booking, trend not changed
SL reversal zone : SL 23% and SL 25% is reversal zone if break then trend reverse and we can take reverse trade
Target : T1, T2, T3, T4 and .
Are our Target zone
Learn Institutional Trading Part-10What is Divergence?
Divergence occurs when the price of a stock and an indicator (like RSI, MACD, or momentum indicators) move in opposite directions. It is often considered a warning that the current trend may be losing strength.
Types of Divergence
Regular Divergence:
Indicates potential trend reversal.
Example: Price makes a new high, but RSI makes a lower high.
Hidden Divergence:
Indicates trend continuation.
Example: Price makes a higher low, but RSI makes a lower low.
How to Use Divergence
Combine with support and resistance levels.
Confirm with volume and candlestick patte

Gold avoid any sell trade market expecting fed rate cut, upmove How My Harmonic pattern projection Indicator work is explained below :
Recent High or Low :
D-0% is our recent low or high
Profit booking zone: D13% -D15% is
range if break them profit booking start on uptrend or downtrend but only profit booking, trend not changed
SL reversal zone : SL 23% and SL 25% is reversal zone if break then trend reverse and we can take reverse trade
Target : T1, T2, T3, T4 and .
Are our Target zone

MCX Gold Petal Futures Crash Below Support – Bears Take ControlGold Petal Futures on the 2-hour MCX chart have witnessed a sharp and decisive fall after moving sideways for several sessions. The strong support level at ₹9,902 has been clearly broken, triggering a wave of panic selling. Price has now dropped close to ₹9,747, which is acting as the next support zone. The breakdown is backed by strong red candles, showing heavy bearish momentum. Unless the price bounces back above ₹9,902 soon, sellers are likely to dominate with ₹9,700 as the next target.
This fall is supported by changing fundamentals. Geopolitical fears around the Iran-Israel situation have eased, reducing safe-haven demand for gold. At the same time, the U.S. dollar has strengthened after the Federal Reserve hinted at keeping interest rates high, making gold less attractive globally. A stronger Indian rupee and possible profit-booking before the quarter-end are also putting downward pressure on prices. Unless fresh tensions or inflation triggers emerge, gold may remain weak in the short term.
For investors with a medium- to long-term horizon, this pullback could be a favorable entry point to accumulate at lower levels, especially if fresh global risks or inflationary pressures resurface. Patience and staggered buying near support zones could prove rewarding.
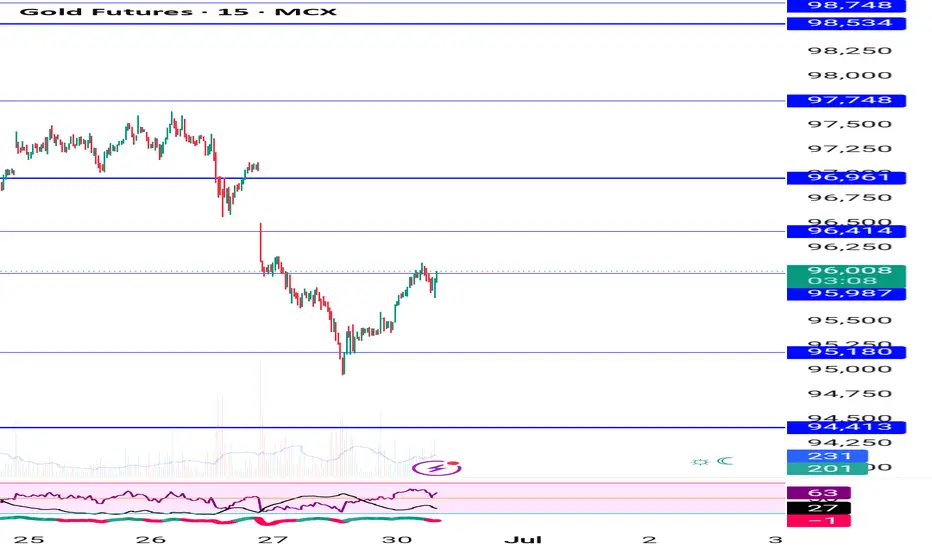
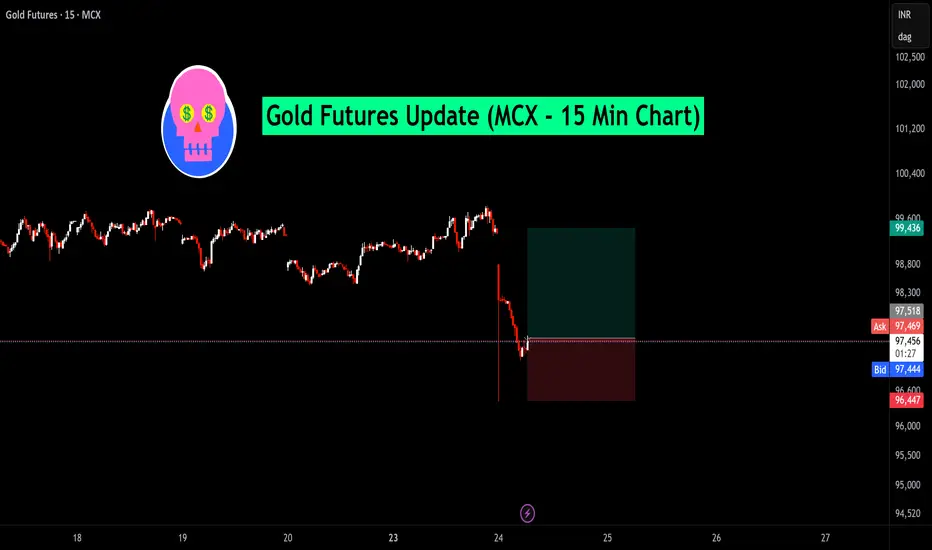
Gold Futures Update (MCX - 15 Min Chart)🔸 Gold is likely to fill the gap successfully, as it has taken support near ₹97,300.
🔸 Once sustained above ₹97,500, we may see a move towards the gap zone of ₹98,300 – ₹99,400.
🔸 Price action suggests a potential reversal and upside momentum building.
📌 Keep a close watch on ₹97,800 for confirmation of bullish strength.
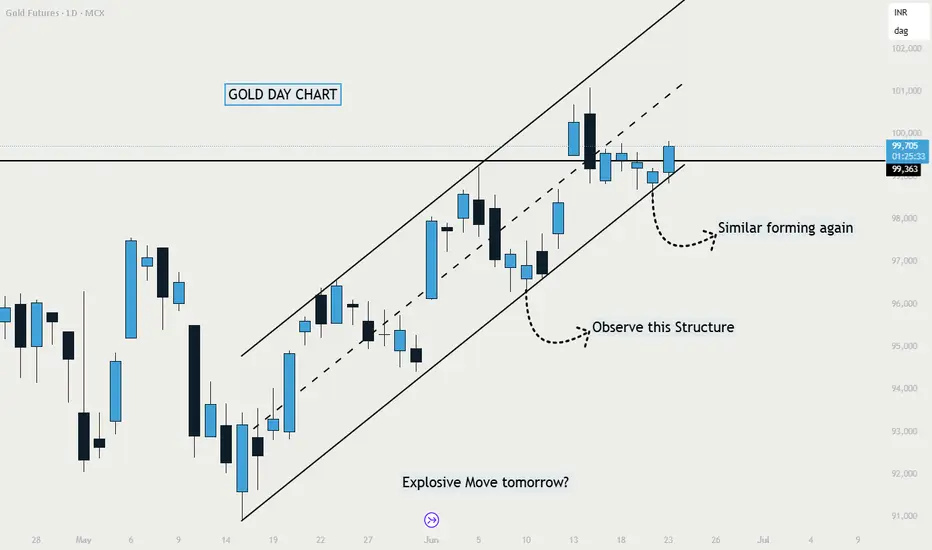
Gold Same Structure Repeating? MCX:GOLD1!
Price still inside the rising channel 📈
Current candles mimicking the previous coil before that sharp move 💥
Same contraction setup visible again — if repeats, an explosive breakout could be around the corner 🚀
Watch for strong follow-up candle above ₹99,800+
Disclaimer: Not a buy/sell recommendation. For educational purposes only. Do your own research.