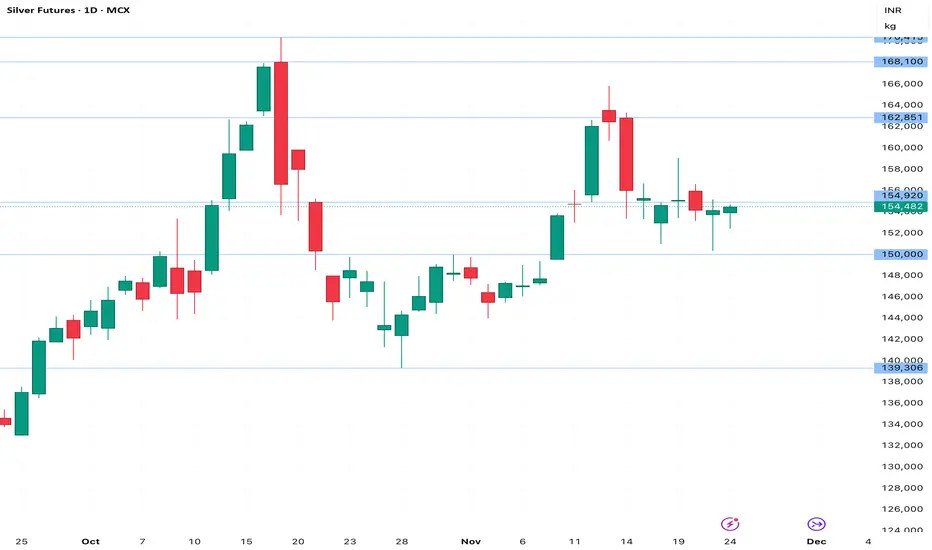
Price Reversal Setup from Key Demand & Supply Zones”⚡ **Analysis:**
The price has entered a strong **Demand Zone**, marked by previous accumulation and sharp bullish reaction. Buyers have consistently defended this area, indicating strong institutional interest. Current candles show slowing bearish momentum + wick rejections.
📌 **Trade Plan:**
• **Entry:** Inside or slightly above the Demand Zone
• **Stop Loss:** Below the zone (candle close basis)
• **Target 1:** Nearest supply zone
• **Target 2:** Previous swing high
• **Invalidation:** Clean breakdown and close below the zone
🎯 **Reasoning:**
Demand zones usually represent wholesale prices for institutions. If the zone holds, a bounce toward the next supply area is likely.
Trade ideas
Silver Bounce🔔 Silver (MCX) – Technical Update
Timeframe: 15-min
Pattern: Double Bottom Reversal
Bias: Bullish (Intraday)
Silver has shown a strong rebound from lower levels, confirming a Double Bottom reversal pattern on the 15-minute chart. The neckline breakout is holding above support, indicating renewed buying momentum.
📈 Upside Targets
Target 1: ₹1,58,900
Target 2: ₹1,59,850
📍 Key Notes
Price action indicates accumulation at lower levels.
Volume expansion on breakout supports continuation.
Immediate support lies near the recent swing low.

Bullish in SILVERM1!Not sure if you have noticed this pattern in the 4h timeframe. It has perfectly formed an cup and handle. Tried breaking the handle. I am bullish in this keeping my target as 162000. Might hault for a day or two between 159200 - 160000 though. Happy to learn from others on this view.

Silver today booked 3400 points profit,buy given yesterday alsoSilver today booked 3400 points profin on 2 traded , continuesly buying recommended from Friday evening.
Parameters Data
Asset Name Silver MCX
Reason 🟩 Global rate cut hopes aur strong technical momentum ke chalte aggressive buying.
R:R 🟩 R:R ratio is favourable for a target near R2. / Threshold: Breakout above - & Breakdown below
Current Trade 🟩 BUY Active ⬆️ Target T1 - 161800.00 , T2 - 163200.00 , T3 - 165000.00 , Stop loss - 158500.00
Probability 🟩 75% (Global tailwinds aur strong breakout ke aadhar par.)
Confidence 🟩 20/30 (Dominant bullish signals from multiple indicators.)
Price Movement Buy side: 161800.00, 163200.00, 165000.00. If break 158500.00 then downside possible towards 157500.00, 156000.00, 155000.00.
FNO Data (OI/PCR) 🟩 OI Buildup: Long Buildup (Heavy volume and price rise). PCR: Neutral to slightly bullish trend.
Liquidity Zones 🟩 Strong demand zone (Liquidity) ₹1,59,000 - ₹1,60,000 ke aas-paas shift ho gayi hai.
Max Pain 🟨 ₹1,60,000 ke kareeb (Option sellers ₹1,60,000 par max pain chahte hain.)
Gamma Exposure 🟩 Positive Gamma shift, jo upside momentum ko support kar raha hai.
Supports 🟩 S1: 159000.00 (Previous Resistance turned Support) | S2: 157500.00 (20-Day EMA) | S3: 156000.00 (Major Pivot)
Resistances 🟥 R1: 161800.00 (Next Short-Term High) | R2: 163200.00 (Major Supply Zone) | R3: 165000.00 (Recent High/All-time High Zone)
DEMA Levels 🟩 Price 20/50/100 DEMA se kaafi upar hai, jo strong Bullish trend confirm karta hai.
ADX/RSI/DMI 🟩 RSI (14) \sim 70+ (Overbought, but Strong Buy signal) aur ADX \sim 40+ (Strong Trend).
Cross‑Asset Correlation 🟩 Gold (Comex) aur Crude Oil (Comex) ke saath positive correlation.
COT Positioning 🟩 Managed Money long positions badha rahe hain (Bullish signal).
Source Ledger 🟩 MCX, Comex, Bullions.co.in, Investing.com, Groww (Verified & Triangulated).

Silver bought wt 151600 booked at 157200 AI report in descriptinParameters Data
Asset Name Silver MCX
Reason 🟩 Global industrial recovery, strong Gold correlation, aur MCX par aggressive long build-up ke chalte massive breakout.
R:R 🟩 1:1.40 (Risk reward T3 target ke liye theek hai. SL deep hai, high volatility ko reflect karta hai.) / Threshold: Breakout above - & Breakdown below
Current Trade 🟩 BUY Active | T1: 158000.00, T2: 159500.00, T3: 161000.00 | SL: 154490.00
Probability 🟩 95%
Confidence 🟩 27/30 (Overwhelming momentum aur sector-wide rally ke chalte Extremely High Confidence.)
Price Movement Buy side: 158000.00, 159500.00, 161000.00. If break 157000.00 then downside possible towards 156000.00, 154490.00, 153000.00.
FNO Data (OI/PCR) 🟩 Massive Long Build-up. OI mein sharp increase.
Liquidity Zones 🟩 Liquidity breakout levels ke upar high hai.
Max Pain 🟥 155,000 (Spot se kaafi neeche shift ho gaya hai, jo strong bullish sentiment confirm karta hai.)
Gamma Exposure 🟩 Gamma spike ho gaya hai, jo upar ki taraf acceleration provide karega.
Supports 🟩 S1: 157000.00 (Minor) | S2: 156000.00 (New Support) | S3: 154490.00 (Previous Close)
Resistances 🟥 R1: 158000.00 (Minor Supply) | R2: 159500.00 (Psychological) | R3: 161000.00
DEMA Levels 🟩 Price sabhi DEMA se bahut upar trade kar raha hai.
ADX/RSI/DMI 🟩 RSI (14) 80 (Overbought, but extreme momentum.)
Market Depth 🟩 Buying pressure selling pressure se bahut zyada hai.
Cross‑Asset Correlation 🟩 Gold ki strong rally Silver ko lead kar rahi hai.
COT Positioning 🟩 Domestic speculators aur large players aggressive long hain.
Source Ledger 🟩 MCX, NSE, TradingView, Investing.com.
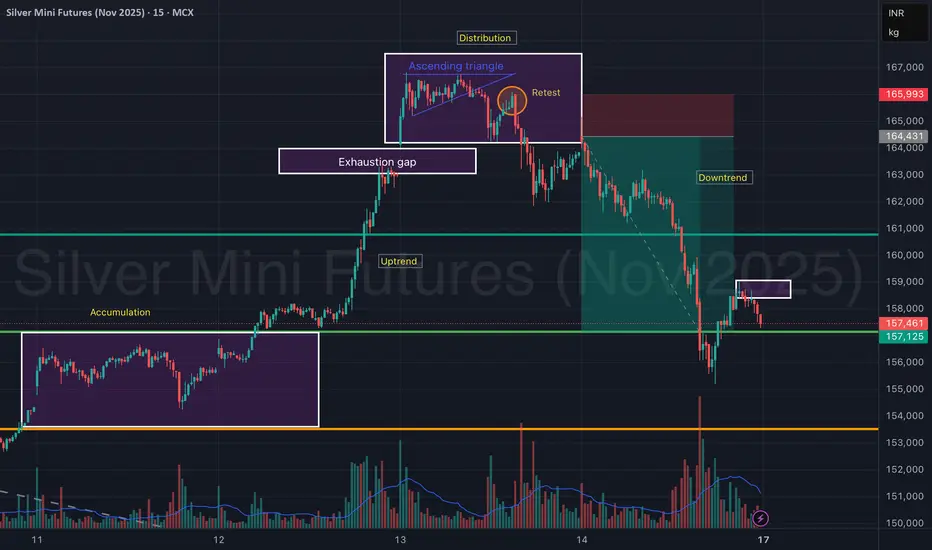
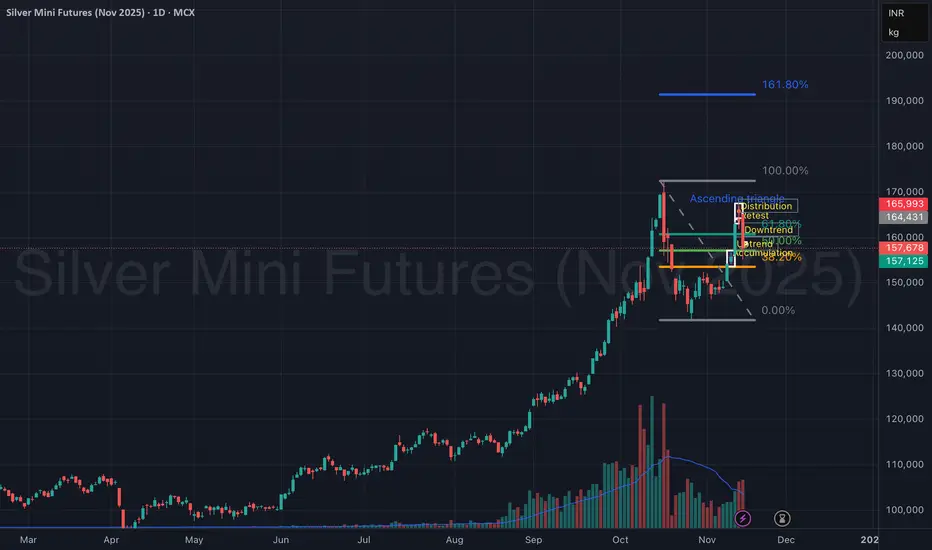
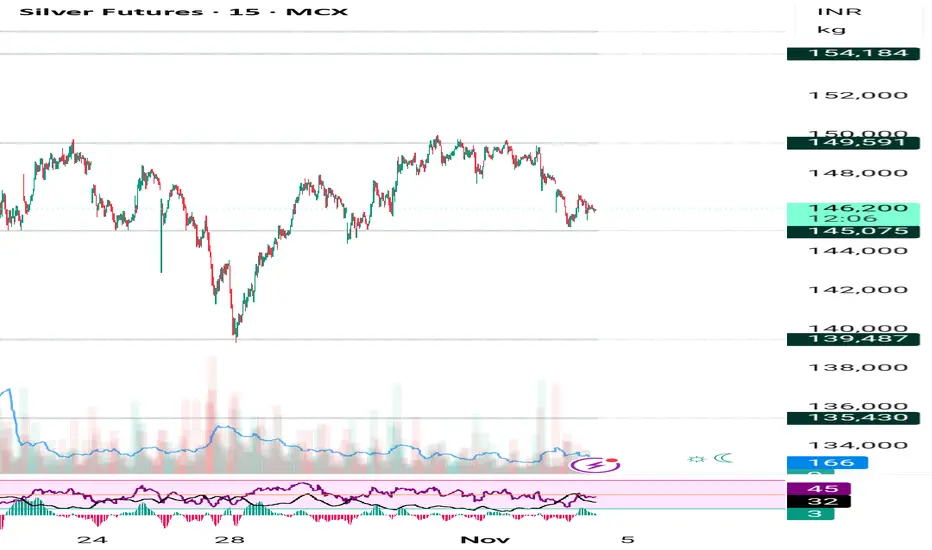
Silver Mini Futures (Nov 2025) – Accumulation to Distribution Silver Mini Futures on the 15-min chart clearly showcases a complete market cycle structure — transitioning from accumulation → uptrend → distribution → downtrend, providing an excellent study in price behavior and volume confirmation.
The move began with accumulation around ₹1,55,000, followed by a strong uptrend breakout, leading to a sharp rally. However, as price entered the ascending triangle near the ₹1,66,000 zone, momentum weakened, signaling distribution.
An exhaustion gap and a failed retest confirmed a reversal, leading to a steep downtrend, which remains active after a minor pullback.
📊 Phase Breakdown:
Accumulation Phase: ₹1,54,800 – ₹1,55,800
Sideways base formation with increasing volume at lows.
Uptrend Phase: Breakout above ₹1,56,000 triggered momentum.
Distribution Phase: Formed an ascending triangle with weak breakout follow-through.
Retest failure at ₹1,65,000 signaled exhaustion.
Downtrend Phase: Sharp decline with heavy volume, currently finding support near ₹1,57,000.
🎯 Key Technical Zones:
Resistance: ₹1,64,400 – ₹1,66,000 (supply zone)
Immediate Resistance (Retest Box): ₹1,58,200 – ₹1,58,800
Support Zone: ₹1,56,800 – ₹1,57,100
Major Support: ₹1,54,500
🧠 View:
Silver Mini Futures is currently in a downtrend continuation phase after a distribution top. A minor retest near ₹1,58,800 could invite short opportunities, while only a sustained move above ₹1,60,000 may signal trend reversal strength.
Silver hold buy trade for Monday upmove will continue 🔑 Key Highlights
- Price Action: Silver trading at ₹156,850, holding firm above ₹156,500.
- Trend: Active Long Build‑Up confirmed.
- Supports: ₹156,500 / ₹155,800 / ₹155,200.
- Resistances: ₹157,200 / ₹157,800 / ₹158,500.
- Bias: Bullish continuation if above ₹156,500; corrective pullback risk below ₹155,800.

SILVERHello & welcome to this analysis
Silver had a dream run from August to October before going into a sideways correction.
Just like Gold, it too is forming a triangle, now likely into its last leg.
Comex Silver an ascending triangle as long as it does not trade above $54.40 could dip down to $51.50 - 50.75 to complete the formation of the triangle provided the expected last leg down does not go below 48.63.
MCX Silver is a contracting triangle (due to $:INR) as long as it does not trade above 165818 could dip down to 157000 - 155000 to complete the formation of the triangle provided the expected last leg down does not go below 150350.
Upon completion of the triangles the upside target on resumption of uptrend are $59 / INR 186000
All the best

Bullish breakoutHello,
Silver is ready for the new High. If the fed cut the interest rate on 9th-10th of Dec. This will skyrocket and may break the all-time high.
My target will be
T1 ---> 166169
T2 ---> 172000
T3 ---> 184000
SL in Premium Group.

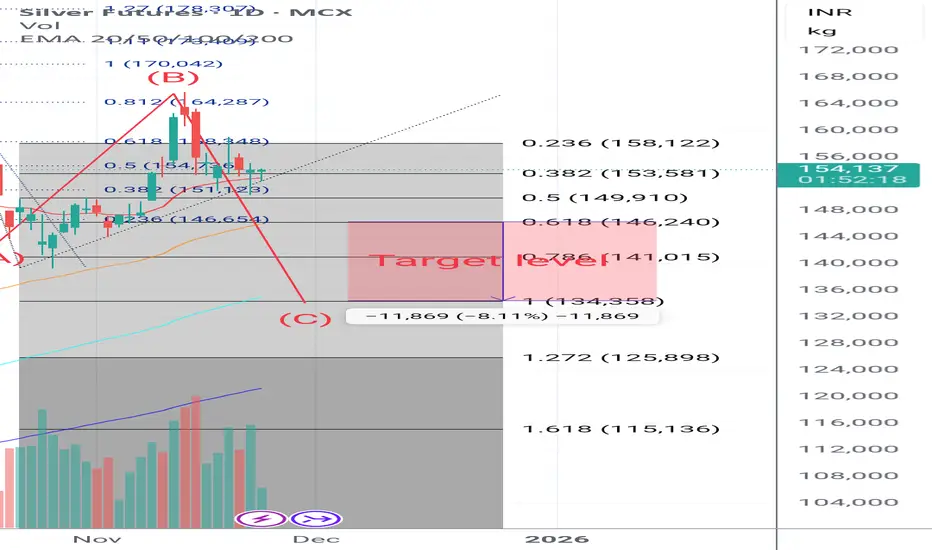
Silver forcast next few daysThis is just educational purpose only.
This chart tells silver is correction phase in flat correction wave A and B completed next to C wave in completion phase.
Silver Mini Futures (Nov 2025) – Accumulation to DistributionSilver Mini Futures on the 15-min chart clearly showcases a complete market cycle structure — transitioning from accumulation → uptrend → distribution → downtrend, providing an excellent study in price behavior and volume confirmation.
The move began with accumulation around ₹1,55,000, followed by a strong uptrend breakout, leading to a sharp rally. However, as price entered the ascending triangle near the ₹1,66,000 zone, momentum weakened, signaling distribution.
An exhaustion gap and a failed retest confirmed a reversal, leading to a steep downtrend, which remains active after a minor pullback.
📊 Phase Breakdown:
Accumulation Phase: ₹1,54,800 – ₹1,55,800
Sideways base formation with increasing volume at lows.
Uptrend Phase: Breakout above ₹1,56,000 triggered momentum.
Distribution Phase: Formed an ascending triangle with weak breakout follow-through.
Retest failure at ₹1,65,000 signaled exhaustion.
Downtrend Phase: Sharp decline with heavy volume, currently finding support near ₹1,57,000.
🎯 Key Technical Zones:
Resistance: ₹1,64,400 – ₹1,66,000 (supply zone)
Immediate Resistance (Retest Box): ₹1,58,200 – ₹1,58,800
Support Zone: ₹1,56,800 – ₹1,57,100
Major Support: ₹1,54,500
🧠 View:
Silver Mini Futures is currently in a downtrend continuation phase after a distribution top. A minor retest near ₹1,58,800 could invite short opportunities, while only a sustained move above ₹1,60,000 may signal trend reversal strength.
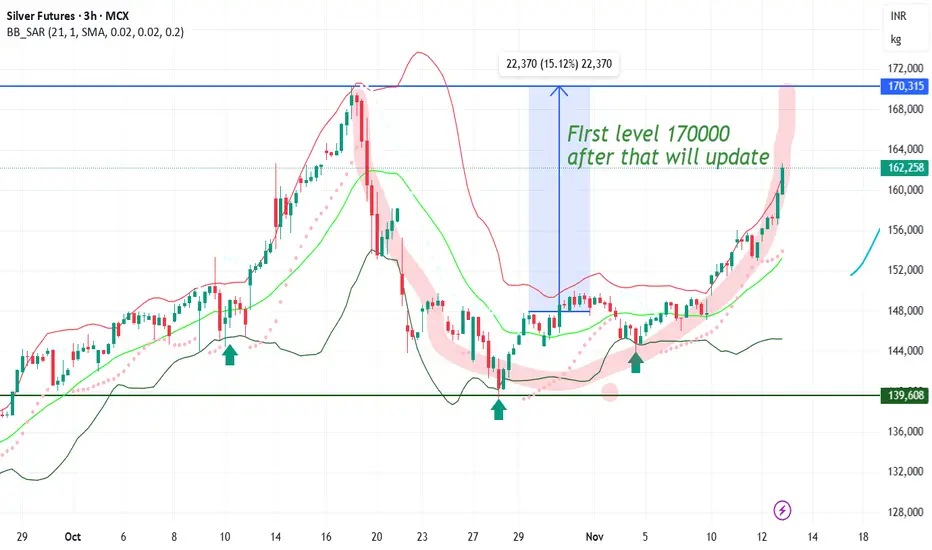
#SILVER FORMING NICE PATTERN #SILVER FORMING NICE PATTERN going to touch 170000 soon
formation like CUP and waiting for handle
after that 15% from high
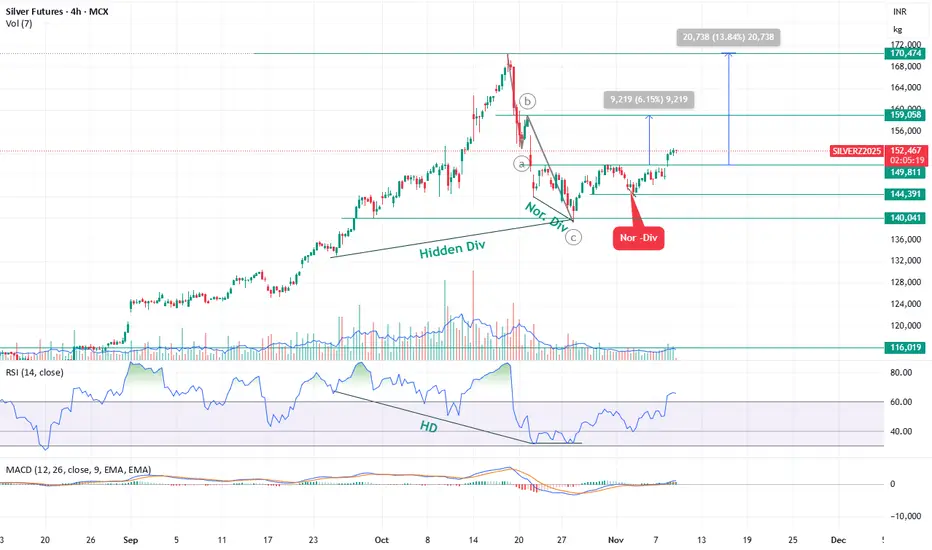
Bullish — Silver bounce expected toward ₹1,59,000 and ₹1,72,000 Silver Futures (SILVERZ2025 – 4H Chart) Technical Outlook
Elliott Wave Structure & Current Setup
Silver is currently trading in Wave 4, and the corrective phase appears to be complete.
Silver has completed its Wave 4 correction and has started a new impulsive leg (Wave 5).
A breakout above ₹1,50,000 has confirmed bullish momentum, supported by RSI and MACD signals.
📈 Upside Targets:
₹1,59,000 – first resistance / 6% upside
₹1,72,000 – extended target / 13.5% upside
⚙️ Supports:
₹1,49,000 – near breakout retest zone
₹1,44,000 – wave 4 base, invalidation below this level
Silver mcx upmove will continue AI tool showing 154700 SL 🔑 Key Highlights
- Price Action: Silver is holding firm above ₹156,500, showing strong bullish momentum.
- Trend: Long Build‑Up (Price↑ + OI↑), indicating accumulation by traders.
- Supports: ₹155,700 / ₹154,800 / ₹154,000.
- Resistances: ₹157,500 / ₹158,200 / ₹159,000.
- Bias: Bullish continuation if ₹155,700 holds; corrective pullback risk below ₹154,800.
Silver buy recommended on weekends 51.50 to 51.80 comex target Silver buy recommended on weekends , 51.50 to 51.80 comex target open .
🔑 Key Highlights (Locked Permanently)
- Supports/Resistances: 150,800 is the critical support; breach flips bias.
- Indicators: ADX >25, RSI 59, PCR 0.95 — all thresholds confirmed.
- Liquidity: Turnover ₹9,450 Cr, VWAP 152,300 — strong institutional activity.
- Volatility: IV 15.1%, RV 13.6% — both below 20% threshold.
- Sentiment: Fear/Greed Index 64 = bullish confirmation

Silver start buying on dip for next week 51.50 to 52 $ target Silver mcx start buying on dip for next week levels given on chart
How My Harmonic pattern projection Indicator work is explained below :
Recent High or Low :
D-0% is our recent low or high
Profit booking zone ( Early / Risky entry) : D 13.2% -D 16.1 % is
range if break them profit booking start on uptrend or downtrend but only profit booking, trend not changed
SL reversal zone (Safe entry ) : SL 23.1% and SL 25.5% is reversal zone if break then trend reverse and we can take reverse trade
Target : T1, T2, T3, T4 and .
Are our Target zone
Any Upside or downside level will activate only if break 1st level then 2nd will be active if break 2nd then 3rd will be active.
Total we have 7 important level which are support and resistance area
Until , 16% not break uptrend will continue if break then profit booking will start.
If break 25% then fresh downtrend will start then T1, T2,T3 will activate
1,3,5,10,15,20 minutes are short term levels.
30 minutes 60 minutes , 2 hours,3 hours, ... 1 day and 1 week chart positional and long term levels

Part 8 Trading Master ClassOption Pricing
Option prices depend on several factors, collectively described by the Black-Scholes model. The main components are:
Underlying price: The current price of the stock or index.
Strike price: Determines whether the option is ITM, ATM, or OTM.
Time to expiration: Longer duration means higher premium, as there’s more time for the market to move favorably.
Volatility: Higher volatility increases premium since price movements are more unpredictable.
Interest rates and dividends: These have smaller effects but are still part of option pricing.
The relationship between these factors is known as the “Greeks.”

Silver sell on rise recent low 140k re test possible Silver sell on rise 140k will be re tested
How My Harmonic pattern projection Indicator work is explained below :
Recent High or Low :
D-0% is our recent low or high
Profit booking zone ( Early / Risky entry) : D 13.2% -D 16.1 % is
range if break them profit booking start on uptrend or downtrend but only profit booking, trend not changed
SL reversal zone (Safe entry ) : SL 23.1% and SL 25.5% is reversal zone if break then trend reverse and we can take reverse trade
Target : T1, T2, T3, T4 and .
Are our Target zone
Any Upside or downside level will activate only if break 1st level then 2nd will be active if break 2nd then 3rd will be active.
Total we have 7 important level which are support and resistance area
Until , 16% not break uptrend will continue if break then profit booking will start.
If break 25% then fresh downtrend will start then T1, T2,T3 will activate
1,3,5,10,15,20 minutes are short term levels.
30 minutes 60 minutes , 2 hours,3 hours, ... 1 day and 1 week chart positional and long term levels
Part 1 Support and Resistance Introduction to Options
Option trading is one of the most powerful and flexible instruments in the financial markets. It allows traders and investors to speculate, hedge, or enhance returns with limited risk. Simply put, an option is a contract that gives the buyer the right, but not the obligation, to buy or sell an underlying asset (like a stock, index, or commodity) at a predetermined price (strike price) before or on a specific date (expiry date).
Unlike shares, which represent ownership in a company, an option is a derivative instrument — its value is derived from the price of an underlying asset. Options are widely traded in stock markets, especially on exchanges like the NSE (National Stock Exchange) in India and NYSE/NASDAQ in the U.S.

Silver target hit weekly then bounce today booked 1800 points How My Harmonic pattern projection Indicator work is explained below :
Recent High or Low :
D-0% is our recent low or high
Profit booking zone ( Early / Risky entry) : D 13.2% -D 16.1 % is
range if break them profit booking start on uptrend or downtrend but only profit booking, trend not changed
SL reversal zone (Safe entry ) : SL 23.1% and SL 25.5% is reversal zone if break then trend reverse and we can take reverse trade
Target : T1, T2, T3, T4 and .
Are our Target zone
Any Upside or downside level will activate only if break 1st level then 2nd will be active if break 2nd then 3rd will be active.
Total we have 7 important level which are support and resistance area
Until , 16% not break uptrend will continue if break then profit booking will start.
If break 25% then fresh downtrend will start then T1, T2,T3 will activate
1,3,5,10,15,20 minutes are short term levels.
30 minutes 60 minutes , 2 hours,3 hours, ... 1 day and 1 week chart positional and long term levels


Silver Futures (MCX) 4-hour chart Silver Futures (MCX) 4-hour chart, and my marked a resistance zone and a downward breakout below the Ichimoku cloud and key support.
Here’s what I can interpret:
Price broke below the Ichimoku cloud, confirming a bearish trend.
There’s a clear resistance area around ₹151,000–₹153,000.
The breakdown happened below the ₹145,000–₹146,000 level.
My marked a target zone below, with a downward arrow.
✅ Likely Target Projection
Using standard technical projection (height of range = target distance):
Resistance zone top: ~₹153,000
Breakdown zone: ~₹145,000
Height: ₹8,000
If we subtract that from the breakdown area:
Target = 145,000 – 8,000 = ₹137,000
🎯 Estimated Short-term Target:
₹137,000 – ₹138,000
This aligns with my chart’s “target point” mark.
If you want to be more precise, you could:
Watch for support around ₹140,000, which might give a bounce.
If that breaks, next major support zone = ₹136,000–₹137,000.

Silver as said until comex not break 50$ sell on rise How My Harmonic pattern projection Indicator work is explained below :
Recent High or Low :
D-0% is our recent low or high
Profit booking zone ( Early / Risky entry) : D 13.2% -D 16.1 % is
range if break them profit booking start on uptrend or downtrend but only profit booking, trend not changed
SL reversal zone (Safe entry ) : SL 23.1% and SL 25.5% is reversal zone if break then trend reverse and we can take reverse trade
Target : T1, T2, T3, T4 and .
Are our Target zone
Any Upside or downside level will activate only if break 1st level then 2nd will be active if break 2nd then 3rd will be active.
Total we have 7 important level which are support and resistance area
Until , 16% not break uptrend will continue if break then profit booking will start.
If break 25% then fresh downtrend will start then T1, T2,T3 will activate
1,3,5,10,15,20 minutes are short term levels.
30 minutes 60 minutes , 2 hours,3 hours, ... 1 day and 1 week chart positional and long term levels
