Due to technical way remains volatile Comex GOLD today's fully volatile due to Geopolitical situations & Technical way, so only SHORT near $3410 but BUY near $3370 for small SL & Big TARGET O know more join +91 nine seven six eight eight 15091
Gold (Mini) Futures
No trades
Market insights

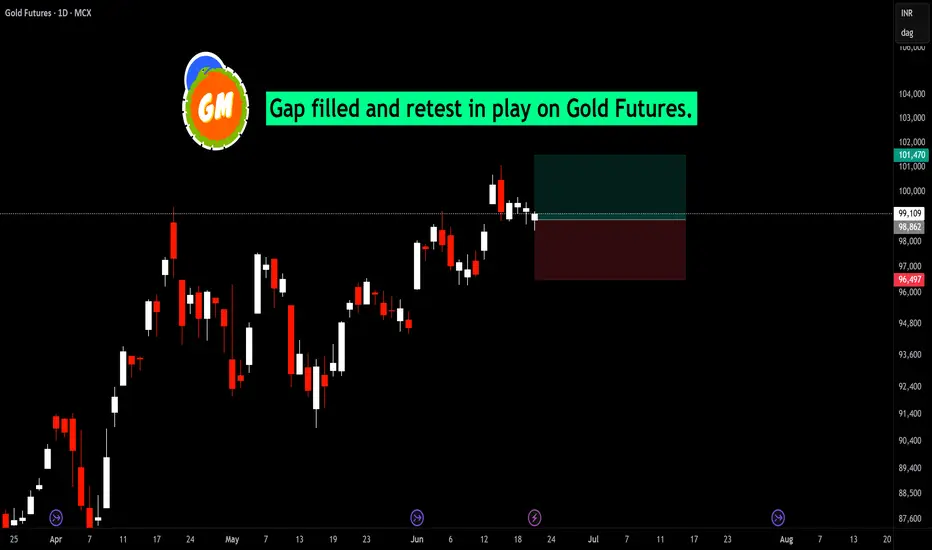
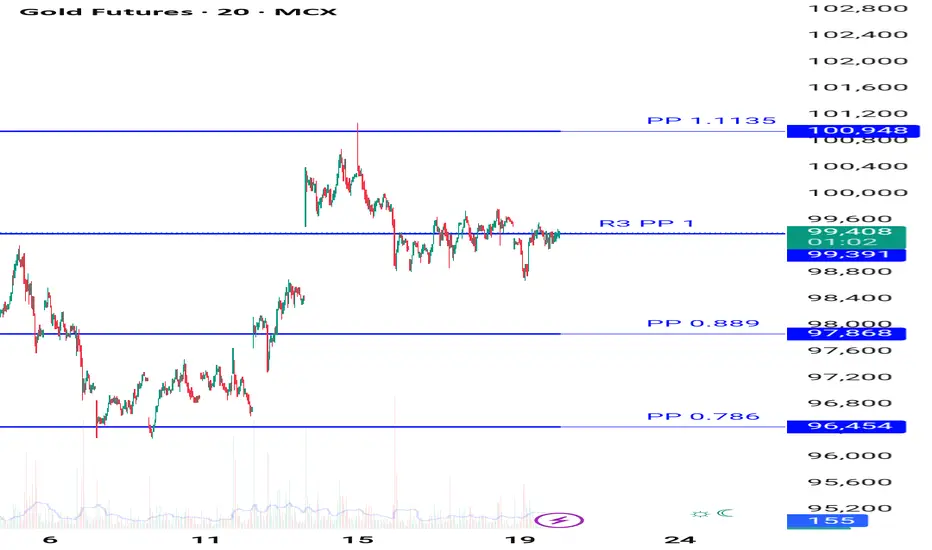
Gap filled and retest in play on Gold FuturesGold Futures has filled the recent gap on the daily chart, and with a successful retest, we may now anticipate a potential upward momentum toward.
Entry Zone – Near current price (~₹99,100).
Target Zone – At the top of the green box (~₹101,470).
Stop Loss Zone – At the bottom of the red box (~₹96,497).
Gold mcx updated levels this week again get huge profit How My Harmonic pattern projection Indicator work is explained below :
Recent High or Low :
D-0% is our recent low or high
Profit booking zone: D13% -D15% is
range if break them profit booking start on uptrend or downtrend but only profit booking, trend not changed
SL reversal zone : SL 23% and SL 25% is reversal zone if break then trend reverse and we can take reverse trade
Target : T1, T2, T3, T4 and .
Are our Target zone
Institutions Option Database Trading Part-5 Risk Management in Option Trading
Even with data, risk control is key:
Max 2% capital risk per trade.
Hedge with opposite option.
Avoid low liquidity options.
Always track IV, PCR, OI live.
Building a Custom Option Scanner
With databases and logic, you can create a personal scanner for:
High IV options
OI breakout zones
PCR + Max Pain alert
Theta-rich expiry trades

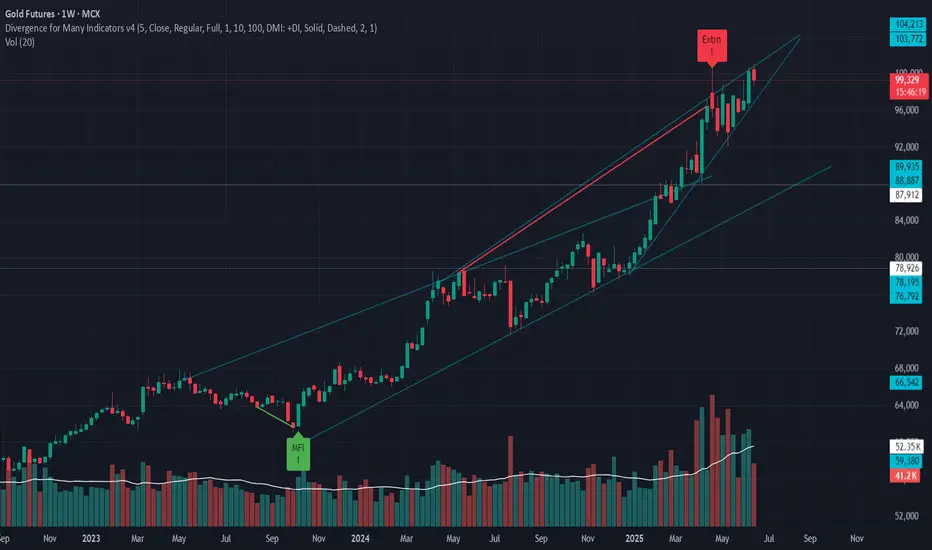
Gold Futures is forming a rising wedge with weakening momentum.
Gold is currently testing a rising trendline on the daily/weekly chart.
A trendline breakdown could signal a shift from bullish to corrective phase.
If the trendline breaks, the structure suggests:
Stop-loss: ₹101,000
Target 1: ₹90,000
Target 2: ₹86,000
This aligns with a potential retracement before the next macro wave (e.g., Fed rate cut cycle or global risk-off).
Gold mcx until 100300 not break sell on rise will continue How to take trades using Harmonic pattern projection Trade setup is explained below :-
Entry : 1st SL point : 0% is recent top or bottom.
Trailing D: 15.1% is work as trailing SL of buy or sell trade if hit then we have to book profit
.If price goes below 2nd D 22.5% to 24.5% range then early traders can make fresh reversals trade after breaking 1st D 15.1% safe traders can reversal trade after breaking Point D 22.5.4% to 24.5% range
Targets :
Target T1 : 36.1% to 38.3%
Target T3 : 49.1% to 52.5%
T3: 60.9% to 64.8% is our 3rd Target since this is reversal zone so must book profit if break then take fresh trade again
Target T4 : 76.4% to 79.7%
Next Targets are 100% , 127.2% ,141.4% and final Target 161.8%.
How to take reversal trade :
If price going upside/ downside then then buy or sell levels appear on Chart ( Automatically show when price reach any reversal zone of harmonic projection ).
Trailing SL:
After reach 1st Target trail SL to just above or below cost ( for example we are holding sell trade from 100 1st Target 110 hit then move trailing sl to 104-105 and move SL as price move upside or Downside)
Re- Entry :
For Re-entry in any pull back Point D ( 15.1% ) is used for re-entry then SL recent high or low Point SL ( 0% ) .
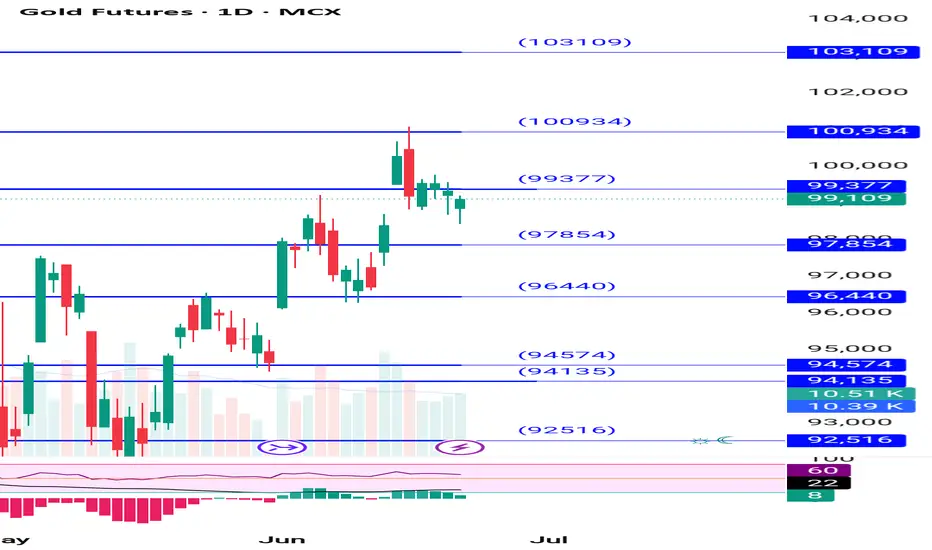
Blue Line is 1st support/ Resistance
Green line is 2nd support/ resistance
Red line is 3rd Support/ resistance
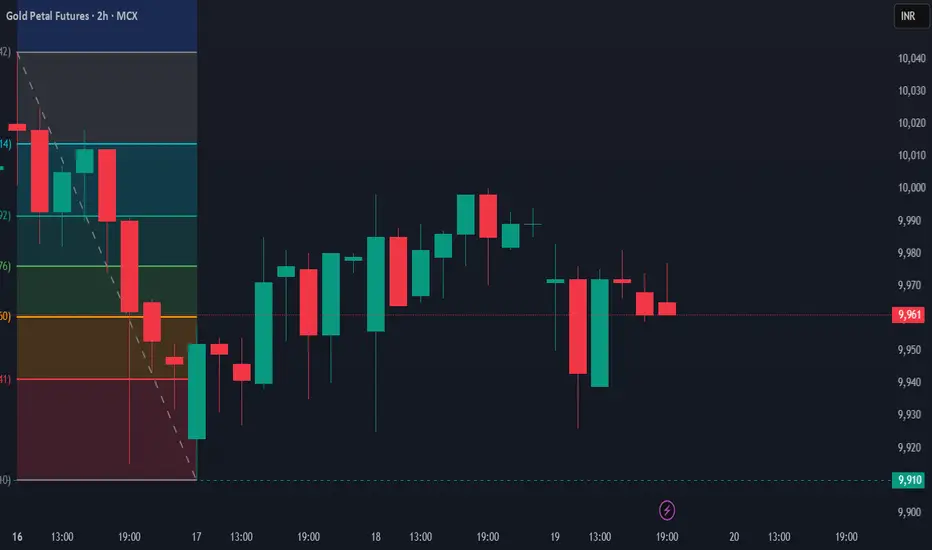
Range Compression After Recovery – MCX Gold Petal FuturesAfter a steep drop from the ₹10,014 zone, Gold Petal Futures found strong support around ₹9,910, where a long lower wick shows rejection of further downside. This initiated a bullish recovery, forming a steady sequence of higher closes. However, the recent candles show loss of momentum, with small-bodied candles and lower highs around ₹9,974.
Price is now consolidating between ₹9,960 and ₹9,910, indicating indecision. Sellers are defending the ₹9,970 zone, while buyers are holding the ₹9,910 base. A breakout from this tightening range will decide the next trend leg—watch ₹9,974 for upside and ₹9,910 for breakdown cues.
Advanced Institutions Option Trading - Part 10Option Pricing Models
Institutions rely on theoretical models to value options precisely.
Models Used:
Black-Scholes Model: Most common for European Options
Binomial Model: For American options
Monte Carlo Simulations: For complex path-dependent options
Bachelier Model: For negative rate scenarios
These models help forecast fair value, hedge ratios, and profit probabilities.
🔹 17. Algorithmic and Quant Option Trading
Institutional desks often use automation for efficiency.
Tools & Techniques:
Python, R, C++ for strategy coding
Machine Learning for volatility prediction
Option Flow Analysis (Unusual Orders)
Real-time Gamma Exposure Mapping
Quant desks track Volga, Vanna, Charm, and other second-order Greeks for precise hedging.

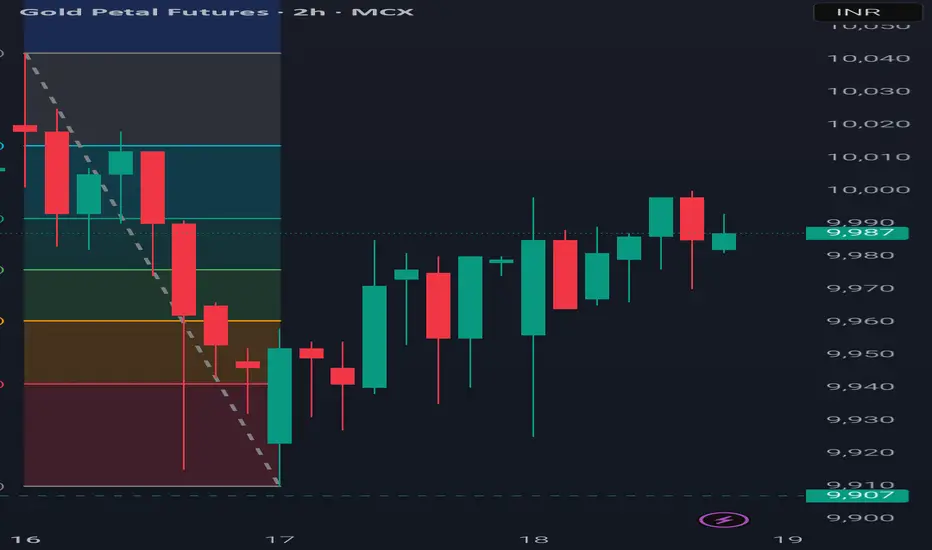
From Panic to Power: Gold Petal’s Bullish Reversal UnfoldsMCX Gold Petal Futures has staged a notable bullish reversal after a steep fall, bottoming out near the ₹9,907 support zone. The price formed a reversal base with long lower wicks and indecisive candles, signaling demand absorption. What followed is a classic sequence of higher highs and higher lows, confirming renewed buyer strength. The breakout above ₹9,980 shows bullish momentum, with current consolidation just below ₹9,990. If this level is breached with volume, the bulls could push toward ₹10,020–₹10,040, while ₹9,950 now acts as the critical support for trend validation.
Gold 400 points profit booked no holding buy trade How to take trades using Harmonic pattern projection Trade setup is explained below :-
Entry : 1st SL point : 0% is recent top or bottom.
Trailing D: 15.1% is work as trailing SL of buy or sell trade if hit then we have to book profit
.If price goes below 2nd D 22.5% to 24.5% range then early traders can make fresh reversals trade after breaking 1st D 15.1% safe traders can reversal trade after breaking Point D 22.5.4% to 24.5% range
Targets :
Target T1 : 36.1% to 38.3%
Target T3 : 49.1% to 52.5%
T3: 60.9% to 64.8% is our 3rd Target since this is reversal zone so must book profit if break then take fresh trade again
Target T4 : 76.4% to 79.7%
Next Targets are 100% , 127.2% ,141.4% and final Target 161.8%.
How to take reversal trade :
If price going upside/ downside then then buy or sell levels appear on Chart ( Automatically show when price reach any reversal zone of harmonic projection ).
Trailing SL:
After reach 1st Target trail SL to just above or below cost ( for example we are holding sell trade from 100 1st Target 110 hit then move trailing sl to 104-105 and move SL as price move upside or Downside)
Re- Entry :
For Re-entry in any pull back Point D ( 15.1% ) is used for re-entry then SL recent high or low Point SL ( 0% ) .
Blue Line is 1st support/ Resistance
Green line is 2nd support/ resistance
Red line is 3rd Support/ resistance

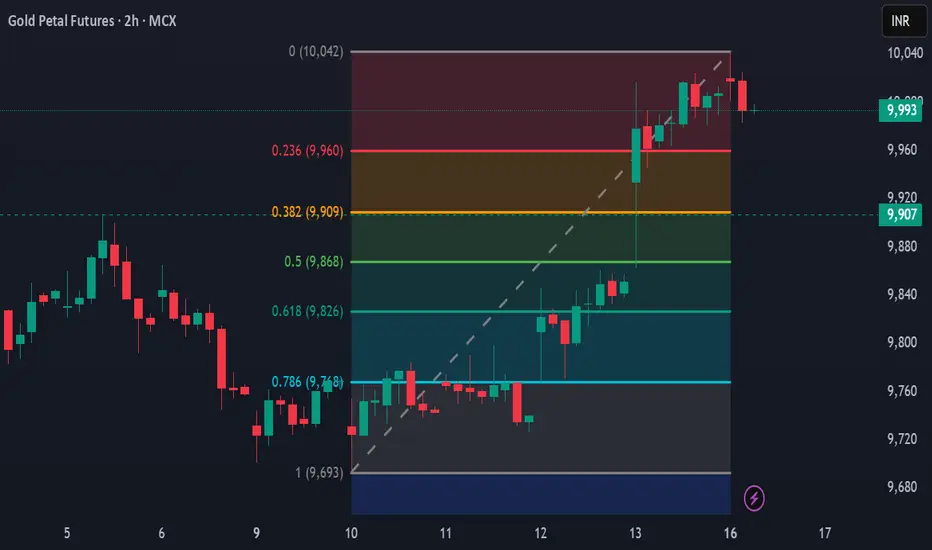
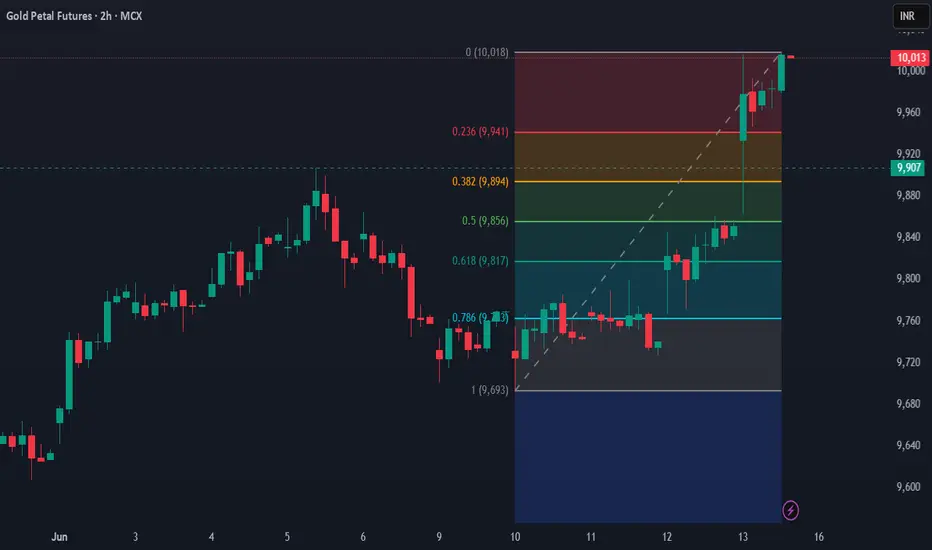
MCX Gold Petal in Consolidation ModePrice action shows a strong bullish rally from ₹9,693 to ₹10,042, marking a higher high. However, the momentum is slowing near the top, with small-bodied candles indicating indecision. Minor rejection hints at possible consolidation or a short pullback before the next move. Bulls must defend ₹9,960 to maintain control.
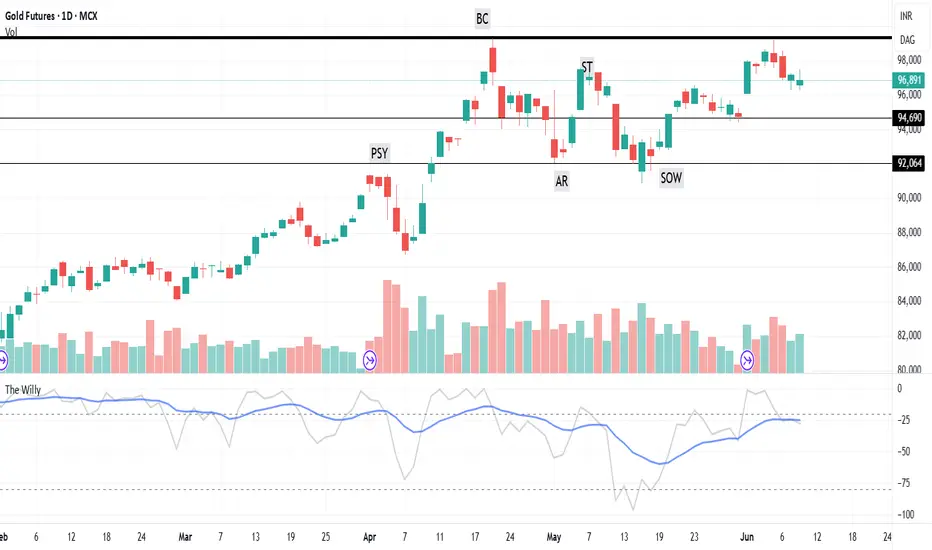
Gold breakout or fakeGold 100214 is showing breakout but as price move not matched to volume we expect this could be a fake breakout and possible formation of UT . 97323 is the support.

Technical Analysis of GOLDI have tried to analyse GOLD on futures chart. It is making head and shoulder pattern whose target is around 105000 and alslo rounding pattern (May convert into cup and handle pattern), whose target comes around 109000.

Gold this week booked 2900 points profit holding buy for Monday How to take trades using Harmonic pattern projection Trade setup is explained below :-
Entry : 1st SL point : 0% is recent top or bottom.
Trailing D: 15.1% is work as trailing SL of buy or sell trade if hit then we have to book profit
.If price goes below 2nd D 22.5% to 24.5% range then early traders can make fresh reversals trade after breaking 1st D 15.1% safe traders can reversal trade after breaking Point D 22.5.4% to 24.5% range
Targets :
Target T1 : 36.1% to 38.3%
Target T3 : 49.1% to 52.5%
T3: 60.9% to 64.8% is our 3rd Target since this is reversal zone so must book profit if break then take fresh trade again
Target T4 : 76.4% to 79.7%
Next Targets are 100% , 127.2% ,141.4% and final Target 161.8%.
How to take reversal trade :
If price going upside/ downside then then buy or sell levels appear on Chart ( Automatically show when price reach any reversal zone of harmonic projection ).
Trailing SL:
After reach 1st Target trail SL to just above or below cost ( for example we are holding sell trade from 100 1st Target 110 hit then move trailing sl to 104-105 and move SL as price move upside or Downside)
Re- Entry :
For Re-entry in any pull back Point D ( 15.1% ) is used for re-entry then SL recent high or low Point SL ( 0% ) .
Blue Line is 1st support/ Resistance
Green line is 2nd support/ resistance
Red line is 3rd Support/ resistance

Gold 2600 points booked holding buy 100100 new ATH come in comexHow to take trades using Harmonic pattern projection Trade setup is explained below :-
Entry : 1st SL point : 0% is recent top or bottom.
Trailing D: 15.1% is work as trailing SL of buy or sell trade if hit then we have to book profit
.If price goes below 2nd D 22.5% to 24.5% range then early traders can make fresh reversals trade after breaking 1st D 15.1% safe traders can reversal trade after breaking Point D 22.5.4% to 24.5% range
Targets :
Target T1 : 36.1% to 38.3%
Target T3 : 49.1% to 52.5%
T3: 60.9% to 64.8% is our 3rd Target since this is reversal zone so must book profit if break then take fresh trade again
Target T4 : 76.4% to 79.7%
Next Targets are 100% , 127.2% ,141.4% and final Target 161.8%.
How to take reversal trade :
If price going upside/ downside then then buy or sell levels appear on Chart ( Automatically show when price reach any reversal zone of harmonic projection ).
Trailing SL:
After reach 1st Target trail SL to just above or below cost ( for example we are holding sell trade from 100 1st Target 110 hit then move trailing sl to 104-105 and move SL as price move upside or Downside)
Re- Entry :
For Re-entry in any pull back Point D ( 15.1% ) is used for re-entry then SL recent high or low Point SL ( 0% ) .
Blue Line is 1st support/ Resistance
Green line is 2nd support/ resistance
Red line is 3rd Support/ resistance

MCX GOLD PETAL - Hits all Time High of 10,000 - Bulls on FireGold Petal Futures just burst through the ₹10,000 roof like it forgot gravity exists! After days of sideways chill, the bulls woke up with energy, smashing resistance and holding strong above key zones without flinching. The candles are climbing step-by-step, showing no signs of slowing down. Momentum is solid, and dips are being bought like hot samosas in the rain!
So buckle up, traders— we are sitting on the rocket, it just lit its boosters... and it's not stopping for snacks! 🚀🔥💰
MCX Gold Petal powerful bullish candleGold Petal has triggered a sharp breakout with a powerful bullish candle (+₹133 | +1.35%), breaking clean above the swing high at ₹9,861, confirming a continuation of the uptrend from the 9,700 base.
Momentum is strong, but overextension risk exists. A brief sideways consolidation or pullback is healthy.
Look for price acceptance above ₹9,900 to confirm the strength of this move.
As long as ₹9,861 holds, the trend favors buy-on-dips setups.
Attention! Attention!
Stay Tight with your Seatbelts GOLD Traders

MCX GOLDPETAL Traders are Requested to Fasten Their Seat Belts!Gold Petal Futures have shown a strong bullish breakout on the 2-hour chart, moving above the key resistance level of ₹9,861 after a steady climb from the 78.6% Fibonacci retracement zone at ₹9,729. The recent candles indicate strong buying momentum with higher lows and a solid bullish candle confirming the breakout. This suggests the uptrend is likely to continue, with possible targets around ₹9,885 and ₹9,920. As long as the price holds above ₹9,797, the bullish sentiment remains strong, and traders should stay alert for further upward movement.
Follow and comment for more Updates

MCX GOLD PETAL bulls are trying to regain controlCurrently, the price is hovering near the ₹9,775, which is acting as a near-term resistance. The market has shown multiple small-bodied candles and wicks, indicating indecision and consolidation. The recent candles suggest that the selling pressure may be easing, and the bulls are trying to regain control.
Its time for the Run UP
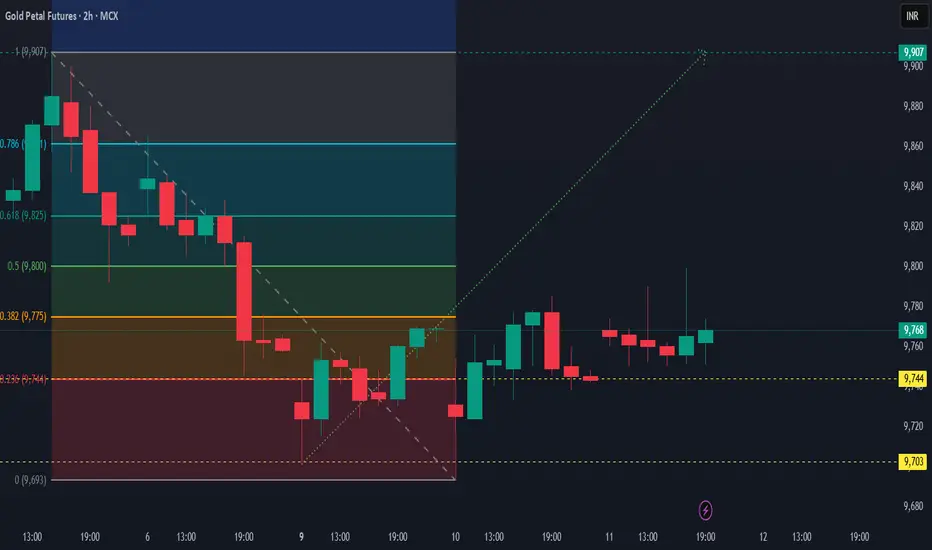
MCX GOLD PETAL Price Dancing at 9744Gold is currently holding above the key level of ₹9744, indicateddemand pressure.
The longer it consolidates at this level, the stronger the potential for an upward breakout in prices.
All eyes on this move.
BUT SURGE Upward is sure
America’s influence remains a key factor.

XAUUSD Bearish Rejection Setup Unfolding – June 11, 2025XAUUSD Bearish Rejection Setup Unfolding – June 11, 2025 🧠🔍
📊 Technical Breakdown:
🔴 Resistance Rejection Zone (Supply Area)
Price recently tested the $3,440 - $3,460 resistance zone, marked with red arrows. This zone previously acted as a strong supply area, leading to aggressive sell-offs.
📉 Bearish Rejection Candle
A rejection occurred near the same supply zone again, hinting at a potential double top or failure to break structure. Sellers seem to defend this area aggressively.
📍 Current Price: $3,338.6
Price is hovering below mid-range resistance at $3,396.5, indicating weakness after a failed breakout.
📉 Bearish Plan in Motion:
🔁 Scenario Highlighted:
Price might retest the $3,396.5 level (purple line) before resuming the downward move (illustrated by the blue and black arrows).
A breakdown below the $3,290.3 support zone will likely trigger further downside.
🎯 Target Levels:
1st Target: $3,290.3 – Key structural support. A close below this level will confirm the bearish momentum.
2nd Target: $3,207.0 – Final support area aligned with previous accumulation zone.
🛑 Invalidation Point:
A sustained breakout above $3,460 would invalidate the bearish bias and suggest continuation to the upside.
✅ Summary:
Bias: Bearish 📉
Strategy: Sell on pullback to $3,396.5 with stops above $3,460.
Targets: 🎯 $3,290.3 ➡️ $3,207.0
Watch for a strong bearish confirmation candle below $3,290.3 to load in shorts.
🔔 Stay alert for volume spikes and lower time-frame breakdowns to fine-tune entries! 💼📊

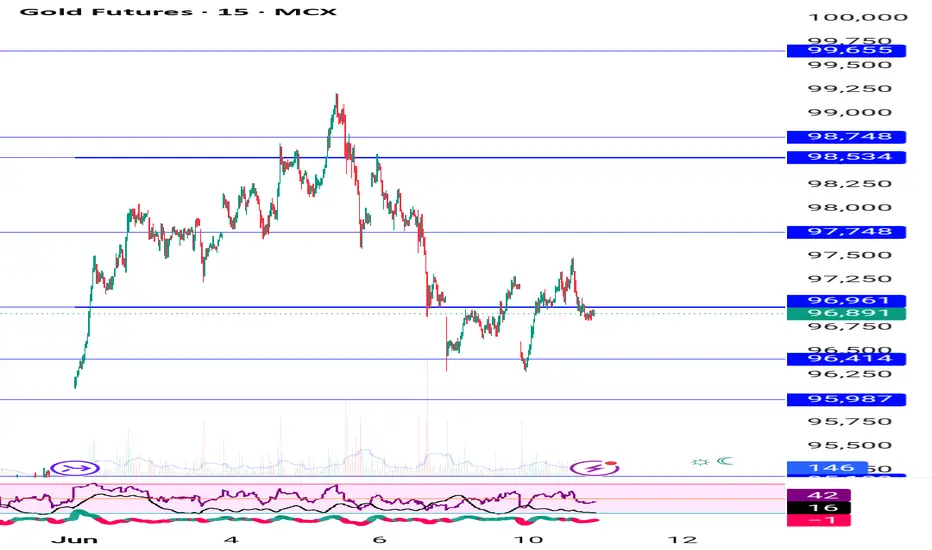
Gold bearishGold 96891 is showing bearish signals.
As long as close is below 97272 we expect Gold will be move moved to its support 94750.
Gold mcx until 97500 not. Break avoid any buy trade How to take trades using Harmonic pattern projection Trade setup is explained below :-
Entry : 1st SL point : 0% is recent top or bottom.
Trailing D: 15.1% is work as trailing SL of buy or sell trade if hit then we have to book profit
.If price goes below 2nd D 22.5% to 24.5% range then early traders can make fresh reversals trade after breaking 1st D 15.1% safe traders can reversal trade after breaking Point D 22.5.4% to 24.5% range
Targets :
Target T1 : 36.1% to 38.3%
Target T3 : 49.1% to 52.5%
T3: 60.9% to 64.8% is our 3rd Target since this is reversal zone so must book profit if break then take fresh trade again
Target T4 : 76.4% to 79.7%
Next Targets are 100% , 127.2% ,141.4% and final Target 161.8%.
How to take reversal trade :
If price going upside/ downside then then buy or sell levels appear on Chart ( Automatically show when price reach any reversal zone of harmonic projection ).
Trailing SL:
After reach 1st Target trail SL to just above or below cost ( for example we are holding sell trade from 100 1st Target 110 hit then move trailing sl to 104-105 and move SL as price move upside or Downside)
Re- Entry :
For Re-entry in any pull back Point D ( 15.1% ) is used for re-entry then SL recent high or low Point SL ( 0% ) .
Blue Line is 1st support/ Resistance
Green line is 2nd support/ resistance
Red line is 3rd Support/ resistance