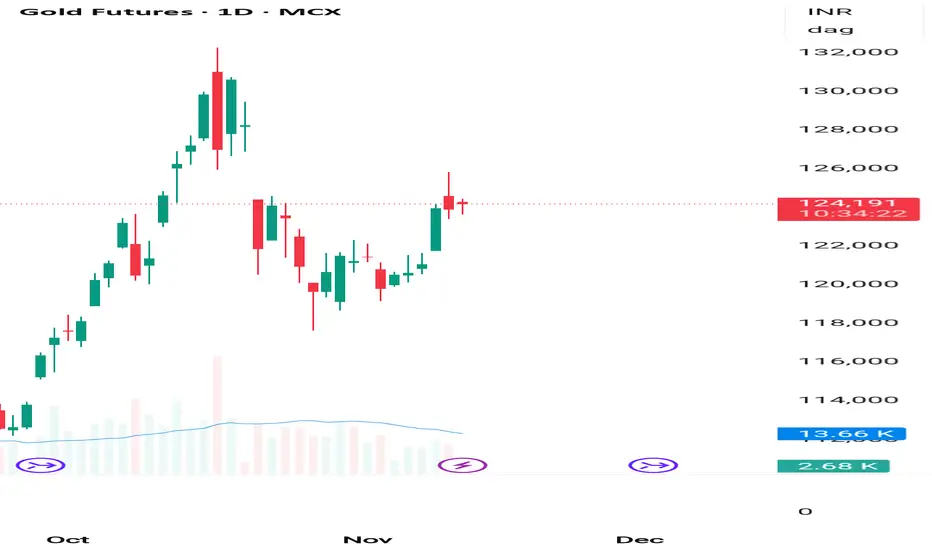
Gold mcx hold buy trade for Monday upmove will continue 🔑 Key Highlights
- Price Action: Gold trading at ₹124,090, holding firm above ₹124,000.
- Trend: Active Long Build‑Up confirmed.
- Supports: ₹124,000 / ₹123,600 / ₹123,200.
- Resistances: ₹124,300 / ₹124,700 / ₹125,200.
- Bias: Bullish continuation if above ₹124,000; corrective pullback risk below ₹123,6
Trade ideas

Part 2 Candle Stick PatternsThe Role of Time in Options
Time value is one of the most important elements.
Unlike stocks, options lose value as they approach expiry. This is known as time decay (theta).
Option BUYERS are hurt by time decay.
Option SELLERS benefit from it.
This is one reason why selling options is a common strategy for generating income.

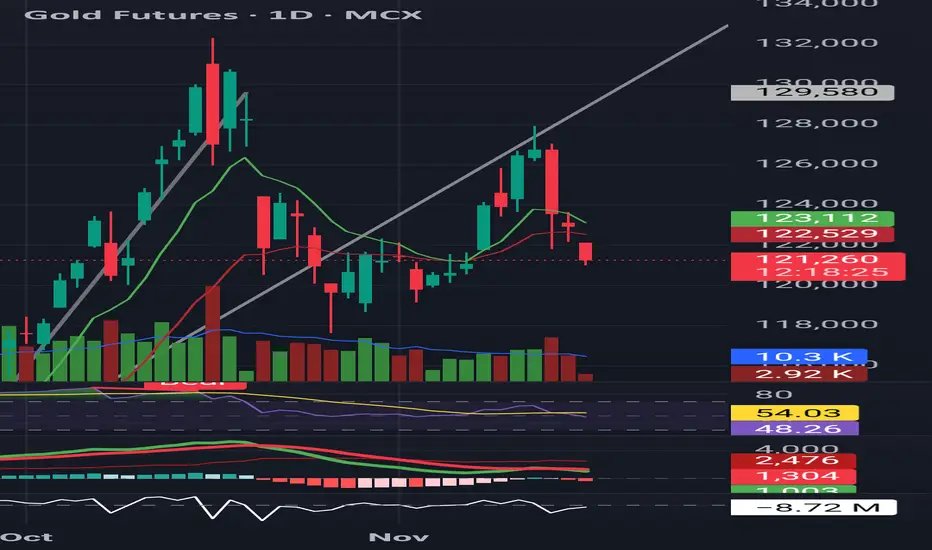
Gold mcx AI tool report showing upmove will continue buy on dip🔑 Key Highlights
- Price Action: Gold is holding firm above ₹124,000, showing steady bullish momentum.
- Trend: Long Build‑Up (Price↑ + OI↑), indicating accumulation by institutions.
- Supports: ₹123,700 / ₹123,200 / ₹122,600.
- Resistances: ₹124,500 / ₹125,000 / ₹125,600.
- Bias: Bullish continuation if ₹123,700 holds; corrective pullback risk below ₹123,200.
Part 6 Institutional Trading Option Trading in India
In India, option trading is available on major exchanges like NSE and BSE, primarily for:
Equity Options (Stocks)
Index Options (NIFTY, BANK NIFTY, FINNIFTY)
Contracts are settled in cash, and trading happens in defined lot sizes. Most retail traders prefer index options due to liquidity and low margin requirements.

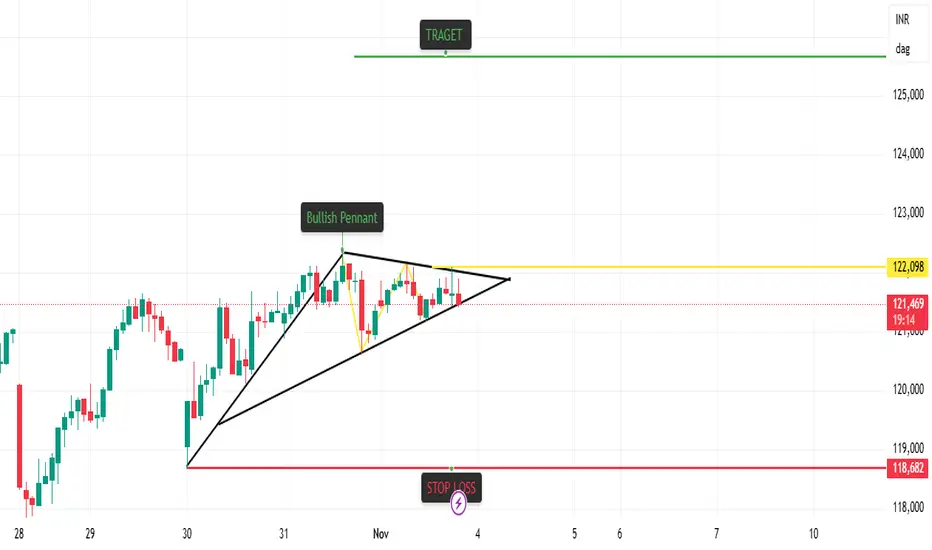
Bullish Pennant Breakout Strategy in GoldBullish Pennant Breakout in Gold MCX
📊 Pattern Overview:
A Bullish Pennant pattern has formed after a strong upward move, signaling a potential continuation of the trend. The pattern is characterized by converging trendlines during consolidation, followed by a breakout to the upside.
📈 Strategy Setup:
Pattern: Bullish Pennant
Breakout Confirmation: Price closing above pennant resistance line
Entry Zone: Near breakout candle close
Target (T1): ₹125,635
Stop Loss (SL): ₹118,682
Risk–Reward Ratio: Approximately 1:2
📊 Indicator Confluence:
T-K Cross: Bullish Cross
Price vs Kijun: Bullish
Cloud Trend: Up
VWMA: Up
RSI: Up
VWAP: Up
SuperTrend: Down (short-term resistance, to be monitored)
🧠 Trading Logic:
The Bullish Pennant indicates a temporary consolidation within an existing uptrend. A confirmed breakout with indicator support (Ichimoku, RSI, VWMA, and VWAP in alignment) strengthens the bullish momentum. Traders may look for sustained candles above the upper trendline with volume confirmation.
⚠️ Disclaimer:
This content is shared for educational purposes only and does not constitute investment or trading advice. Market conditions can change rapidly — always conduct your own analysis and use proper risk management before making any trading decisions.
mcx gold updatemcx gold fire boom near 1.50% due to rate cut bets fuel rally.
now if mkt sustain abv 123000 looks up side 123590-124000++++in coming session where hurdel 122700 again close blw looks some dwn correction till 122300-121890++++
trading ideas -- buy gold any dips near 123000-123100 with sl 122700 tgt 123590--124000++

Gold start buying on dip again if comex break 4060 then 4150-80 Gold mcx start buying on dip if comex break 4060 the. 4150-4180 will come
How My Harmonic pattern projection Indicator work is explained below :
Recent High or Low :
D-0% is our recent low or high
Profit booking zone ( Early / Risky entry) : D 13.2% -D 16.1 % is
range if break them profit booking start on uptrend or downtrend but only profit booking, trend not changed
SL reversal zone (Safe entry ) : SL 23.1% and SL 25.5% is reversal zone if break then trend reverse and we can take reverse trade
Target : T1, T2, T3, T4 and .
Are our Target zone
Any Upside or downside level will activate only if break 1st level then 2nd will be active if break 2nd then 3rd will be active.
Total we have 7 important level which are support and resistance area
Until , 16% not break uptrend will continue if break then profit booking will start.
If break 25% then fresh downtrend will start then T1, T2,T3 will activate
1,3,5,10,15,20 minutes are short term levels.
30 minutes 60 minutes , 2 hours,3 hours, ... 1 day and 1 week chart positional and long term levels

Silver Mcx After the sharp decline from the October highs, silver has been holding its October low and is now consolidating within a tight range. A breakout and close above this consolidation box would indicate that the next leg of the uptrend may resume. The October closing low is acting as key support. If the breakout holds, price can attempt to move toward the rising trendline resistance zone, which is currently around 135,000 in the coming weeks.

Gold Bullish Till 127000Gold have pending liquidity above 127000
after that it may fall towards 110000

GOLD next move 83000 to 85000 as per technical breakout gold can be going up near 83000 and 85000 trade on your own analysis , trade with stoploss , share and like,

GOLD 1ST TGT DONE 83000 NOW READY FOR 85000gold 1st tgt 83000 was done, ready for next tgt 85000
please check my previous post

Gold Futures – Bearish Continuation Developing 🟡⬇ Gap-down open = breakdown continuation
Price below 9 EMA and 21 EMA
Evening Star pattern confirmed
RSI falling → momentum weakening
MACD below signal → bearish pressure
📌 Short Setup:
Below 121,800–121,900
🎯 Targets: 117,500 → 116,000
🛑 Stoploss: 123,650
Weak trend until gold closes back above 21 EMA.
Gold mcx buy recommended during weekend1300-1400 profit running
🔑 Key Highlights (Locked Permanently)
- Supports/Resistances: 122,800 is the critical support; breach flips bias.
- Indicators: ADX >25, RSI 60, PCR 0.93 — all thresholds confirmed.
- Liquidity: Turnover ₹11,200 Cr, VWAP 123,700 — strong institutional activity.
- Volatility: IV 14.5%, RV 13.4% — both below 20% threshold.
- Sentiment: Fear/Greed Index 67 = bullish confirmation.

Institutional Option Writing Strategies1. Understanding Option Writing
In simple terms, option writing involves selling call or put options to another party.
A call option writer agrees to sell an asset at a specified strike price if the buyer exercises the option.
A put option writer agrees to buy the asset at the strike price if exercised.
The writer receives the option premium upfront. If the option expires worthless, the writer keeps the entire premium as profit. Institutions, with their deep capital bases and risk management tools, leverage this structure to earn steady income streams while controlling exposure to extreme price moves.
2. Institutional Objectives Behind Option Writing
Institutions pursue option writing strategies for several key reasons:
Income Generation: Writing options generates regular cash inflows through premiums, especially during low-volatility market phases.
Portfolio Enhancement: Option writing can supplement portfolio returns without requiring additional capital allocation.
Hedging and Risk Management: Institutions may write options to hedge against downside or upside risks in their existing equity or fixed-income portfolios.
Volatility Harvesting: Many institutional traders exploit the difference between implied volatility (reflected in option prices) and realized volatility (actual market movement). When implied volatility is higher, writing options becomes more profitable.
3. Core Institutional Writing Strategies
Institutions employ a range of structured option writing techniques. Below are some of the most common and powerful institutional approaches:
A. Covered Call Writing
Description:
This is one of the most widely used strategies by institutional investors holding long positions in equities or indices. A call option is written against an existing holding.
Example:
If a fund owns 1 million shares of Reliance Industries and expects the price to remain stable or rise moderately, it might sell call options at a higher strike price.
Objective:
Earn option premiums while retaining upside potential (limited to the strike price).
Improve portfolio yield in sideways markets.
Institutional Use Case:
Large mutual funds, ETFs, and pension funds employ systematic covered call writing programs (e.g., the CBOE BuyWrite Index) to generate incremental yield.
B. Cash-Secured Put Writing
Description:
Here, an institution writes put options on securities it is willing to buy at lower prices.
Example:
If an institutional investor wants to purchase Infosys at ₹1,400 while the current market price is ₹1,500, it may sell a ₹1,400 put option. If the price drops, the institution buys the shares effectively at a discounted rate (strike price minus premium).
Objective:
Acquire desired stocks at a lower effective price.
Earn premiums if the option expires worthless.
Institutional Use Case:
Hedge funds and asset managers use this as a buy-entry strategy to accumulate equities in a disciplined manner.
C. Short Straddles and Strangles
Description:
These are non-directional premium harvesting strategies.
A short straddle involves selling both a call and a put at the same strike price.
A short strangle involves selling out-of-the-money (OTM) calls and puts at different strike prices.
Objective:
Profit from time decay and low realized volatility, as the position benefits when the underlying remains range-bound.
Institutional Use Case:
Market-making firms and volatility funds often employ delta-neutral short volatility trades, dynamically hedging exposure with futures or underlying assets to capture theta (time decay).
D. Covered Put Writing (or Reverse Conversion)
Description:
Institutions short the underlying asset and sell a put option simultaneously. This is effectively a synthetic short call position.
Objective:
Generate income from premium while holding a bearish outlook.
Institutional Use Case:
Used by proprietary desks to benefit from short-term bearish sentiment in overvalued stocks or indices.
E. Iron Condors and Iron Butterflies
Description:
These are advanced multi-leg strategies combining short straddles/strangles with long options for limited risk exposure.
Example:
An iron condor involves selling a short strangle and buying further OTM options as protection.
Objective:
Collect premium in range-bound markets while capping potential losses.
Institutional Use Case:
Quantitative hedge funds and volatility arbitrage desks often implement automated iron condor portfolios to capture small, consistent returns.
4. Risk Management in Institutional Option Writing
Unlike retail traders who often underestimate risk, institutions deploy rigorous frameworks to manage exposure. Some key practices include:
Delta Hedging: Institutions continuously adjust their underlying asset positions to maintain a neutral delta, reducing directional risk.
Value-at-Risk (VaR) Modeling: Quantitative models assess potential losses from adverse market movements.
Portfolio Diversification: Writing options across multiple securities, expirations, and strikes reduces concentration risk.
Volatility Analysis: Institutions track implied vs. realized volatility spreads to identify favorable conditions for selling options.
Position Limits: Regulatory and internal risk limits prevent overexposure to specific assets or strikes.
Dynamic Adjustments: Algorithms monitor changing market conditions to rebalance or exit positions.
5. Quantitative and Algorithmic Enhancements
Modern institutions integrate machine learning, data analytics, and algorithmic trading into their option writing programs. Some methods include:
Statistical Arbitrage Models: Exploit mispricing between options and underlying securities.
Volatility Forecasting: AI-driven models predict short-term volatility to optimize strike and expiration selection.
Automated Execution: Algorithms manage large-scale multi-leg option portfolios efficiently.
Gamma Scalping: Automated hedging against volatility swings ensures steady theta profits.
These advanced systems allow institutions to operate with precision and scalability impossible for manual traders.
6. Market Conditions Favorable for Option Writing
Institutional writers thrive under certain market conditions:
Stable or Sideways Markets: Time decay (theta) works in favor of sellers.
High Implied Volatility: Premiums are inflated, offering better reward-to-risk ratios.
Interest Rate Stability: Predictable macroeconomic conditions help maintain market equilibrium.
However, during periods of high market uncertainty—such as financial crises or unexpected geopolitical shocks—institutions may reduce or hedge their short volatility exposure aggressively.
7. Regulatory and Compliance Considerations
Institutions are subject to stringent SEBI, CFTC, and exchange-level regulations when engaging in derivatives trading. They must maintain adequate margin requirements, adhere to risk disclosure norms, and report large open positions. Compliance systems automatically monitor exposure to ensure adherence to capital adequacy and position limits.
8. Advantages of Institutional Option Writing
Consistent Income Generation through premium collection.
Portfolio Stability by offsetting volatility.
Improved Capital Efficiency through margin optimization.
Systematic and Scalable execution via automation.
Enhanced Long-Term Returns through disciplined risk-managed exposure.
9. Risks and Challenges
Despite its appeal, option writing carries notable risks:
Unlimited Loss Potential: Particularly in uncovered call writing.
Volatility Spikes: Sudden market swings can cause large mark-to-market losses.
Liquidity Risk: Difficulties in adjusting large positions in fast-moving markets.
Margin Pressure: Rising volatility increases margin requirements, straining liquidity.
Execution Complexity: Requires sophisticated systems and continuous monitoring.
Institutions mitigate these risks through diversified, hedged, and dynamically managed portfolios.
10. Conclusion
Institutional option writing strategies represent a disciplined, risk-controlled approach to generating consistent returns in both bullish and neutral markets. Unlike speculative option buyers, institutional writers rely on probability, volatility analysis, and quantitative precision to achieve a long-term edge.
Through methods like covered calls, put writing, iron condors, and straddles, institutions systematically capture time decay and volatility premiums. Supported by advanced risk models and algorithmic execution, these strategies transform options from speculative instruments into powerful tools for income generation and portfolio optimization.
When executed with prudence and robust risk management, institutional option writing can serve as a cornerstone of stable, repeatable performance in modern financial markets.
Explain: Candle PatternWhat is a Candlestick Pattern?
A candlestick pattern represents the price movement of an asset (like a stock) during a specific time frame. It shows open, high, low, and close prices in one candle.
Structure of a Candle
Each candle has:
Body: The range between open and close price.
Wick (or shadow): The lines above and below the body showing high and low prices.
Color: Green (bullish – price up) or Red (bearish – price down).

Gold mcx sell on rise until 4050 not break in comexGold sell on rise until 4050 not break on comex
How My Harmonic pattern projection Indicator work is explained below :
Recent High or Low :
D-0% is our recent low or high
Profit booking zone ( Early / Risky entry) : D 13.2% -D 16.1 % is
range if break them profit booking start on uptrend or downtrend but only profit booking, trend not changed
SL reversal zone (Safe entry ) : SL 23.1% and SL 25.5% is reversal zone if break then trend reverse and we can take reverse trade
Target : T1, T2, T3, T4 and .
Are our Target zone
Any Upside or downside level will activate only if break 1st level then 2nd will be active if break 2nd then 3rd will be active.
Total we have 7 important level which are support and resistance area
Until , 16% not break uptrend will continue if break then profit booking will start.
If break 25% then fresh downtrend will start then T1, T2,T3 will activate
1,3,5,10,15,20 minutes are short term levels.
30 minutes 60 minutes , 2 hours,3 hours, ... 1 day and 1 week chart positional and long term levels
Part 8 Trading Master Class With ExpertsHow Option Premium Is Determined
The option premium is influenced by several factors, collectively known as the “Greeks.” These include:
Intrinsic Value – The actual value if exercised immediately (difference between market price and strike price).
Time Value – Extra premium paid for the time left before expiration.
Volatility (Vega) – The higher the market volatility, the higher the option premium.
Delta – Measures how much the option’s price changes with a change in the underlying price.
Theta – Indicates how much the option’s value erodes as time passes (time decay).
Rho – Measures sensitivity to interest rate changes.
For example, an option closer to expiry loses time value faster due to Theta decay.

Pattern Unfolding Hello Friends I just explained what i am looking the in Gold Futures
I request you to take notes as study materials and analyze before taking live trade
This is education content
Good luck

Gold looking bullish in 1HGold is taking support near its support zone and clearly making triangle pattern if it sustain and gave a breakout it will be great opportunity
Entry:-121700
Profit -1:- 122823
Profit -2:- 124220
Stoploss:- 120270

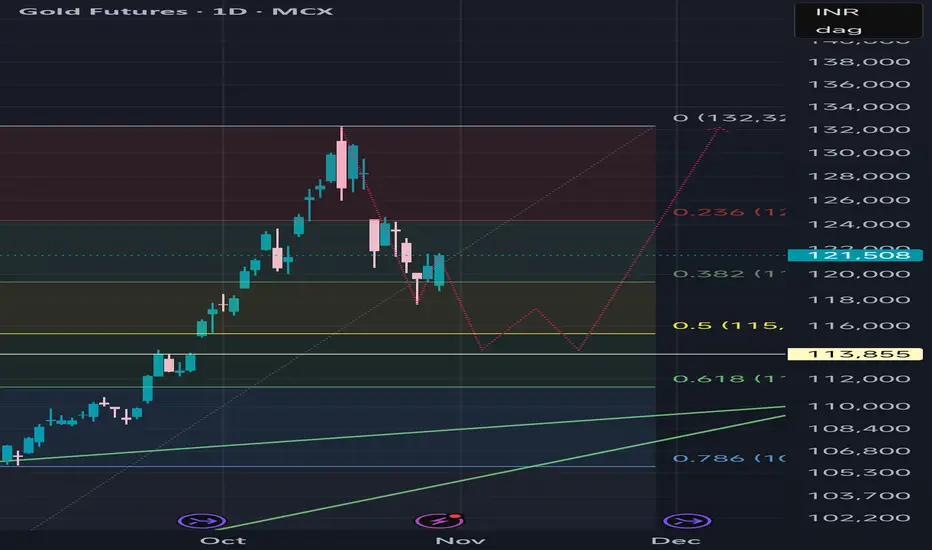
Gold Futures MCX-2H — A Possible Double Zigzag at PlayThe decline from 132,294 unfolded into a clean 5-wave impulse, with Wave 3 extending 1.618 × Wave 1 and Wave 5 measuring nearly equal to Wave 1 — a classic Fibonacci rhythm confirming the completion of Wave W at 117,628.
The ongoing rebound appears corrective, unfolding as an A-B-C structure for Wave X. A move toward the 124–125 k zone could complete Wave C, setting the stage for another 5-3-5 leg lower as Wave Y — potentially mirroring Wave W.
Gold might just be correcting a bit more before it gleams brighter.
Disclaimer: This analysis is for educational purposes only and does not constitute investment advice. Please do your own research (DYOR) before making any trading decisions.

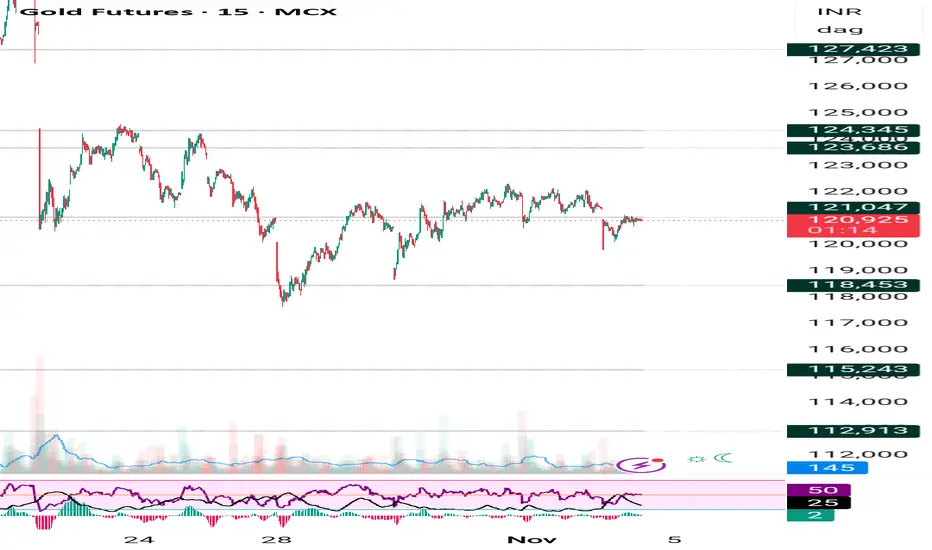
Gold today booked 2000 points on sell and 800 points on buy sideGold mcx Sold yesterday at 120900 today booked at 118880 , 2000 points
Again bought at 120100 and booked 120950
How My Harmonic pattern projection Indicator work is explained below :
Recent High or Low :
D-0% is our recent low or high
Profit booking zone ( Early / Risky entry) : D 13.2% -D 16.1 % is
range if break them profit booking start on uptrend or downtrend but only profit booking, trend not changed
SL reversal zone (Safe entry ) : SL 23.1% and SL 25.5% is reversal zone if break then trend reverse and we can take reverse trade
Target : T1, T2, T3, T4 and .
Are our Target zone
Any Upside or downside level will activate only if break 1st level then 2nd will be active if break 2nd then 3rd will be active.
Total we have 7 important level which are support and resistance area
Until , 16% not break uptrend will continue if break then profit booking will start.
If break 25% then fresh downtrend will start then T1, T2,T3 will activate
1,3,5,10,15,20 minutes are short term levels.
30 minutes 60 minutes , 2 hours,3 hours, ... 1 day and 1 week chart positional and long term levels
Gold mcx sell on rise goven until 4160 not break in comex Gold sell on rise recommended until 4160 not break in comex
How My Harmonic pattern projection Indicator work is explained below :
Recent High or Low :
D-0% is our recent low or high
Profit booking zone ( Early / Risky entry) : D 13.2% -D 16.1 % is
range if break them profit booking start on uptrend or downtrend but only profit booking, trend not changed
SL reversal zone (Safe entry ) : SL 23.1% and SL 25.5% is reversal zone if break then trend reverse and we can take reverse trade
Target : T1, T2, T3, T4 and .
Are our Target zone
Any Upside or downside level will activate only if break 1st level then 2nd will be active if break 2nd then 3rd will be active.
Total we have 7 important level which are support and resistance area
Until , 16% not break uptrend will continue if break then profit booking will start.
If break 25% then fresh downtrend will start then T1, T2,T3 will activate
1,3,5,10,15,20 minutes are short term levels.
30 minutes 60 minutes , 2 hours,3 hours, ... 1 day and 1 week chart positional and long term levels
