Gold mcx holding buy from 83050 , 1000 points profit running How to take trades using Harmonic pattern projection Trade setup is explained below :-
1st D point : 0% is recent top or bottom.
2nd D Point : 13.5% is work as trailing SL of buy or sell trade if hit then we have to book profit
.If price goes below 13.5% then early or risky traders can reversal trade ,
Safe traders can wait for 27% levels break
Targets :
Target T1 is 27.3% if you are taken entry from 13.5% if taken entry from 27.3 then Target T1: 38.2 % level is our 1st Target
( 38.2% if also a reversal zone so if price reverse then we can make fresh entry also).
T2: 50% level is our 2nd Target
T3: 61.8% to 65 % is our 3rd Target
( This is also reversal zone so we have to book profit at this area and if break then take fresh entry with SL of 2nd Target 50% .)
Next Targets are 78.6 % , 88.9 % 100% , 113.5 % , 127.2% , 141.5% and 161.8% to 165%.
161.8 to 165% if profit booking area so book full profit and wait for reversal.
How to take reversal trade :
If price going upside/ downside then then buy or sell levels appear on Chart ( Automatically show when price reach any reversal zone of harmonic projection pattern based .
After showing reversal levels wait for confirmation until 13.5 % or 27 .6 % level not break if break then exit from current buy / sell trade and take fresh reverse trade buy/ sell .
Trailing SL:
After reach 1st Target trail SL to just above or below cost ( for example we are holding sell trade from 100 1st Target 110 hit then move trailing sl to 104-105 and move SL as price move upside or Downside)
Blue Line is 1st support/ Resistance
Green line is 2nd support/ resistance
Red line is 3rd Support/ resistance
Gold (Mini) Futures
No trades
Market insights

Holding buy trade on gold mcx from 83050 , final Target 84830How to take trades using Harmonic pattern projection Trade setup is explained below :-
1st D point : 0% is recent top or bottom.
2nd D Point : 13.5% is work as trailing SL of buy or sell trade if hit then we have to book profit
.If price goes below 13.5% then early or risky traders can reversal trade ,
Safe traders can wait for 27% levels break
Targets :
Target T1 is 27.3% if you are taken entry from 13.5% if taken entry from 27.3 then Target T1: 38.2 % level is our 1st Target
( 38.2% if also a reversal zone so if price reverse then we can make fresh entry also).
T2: 50% level is our 2nd Target
T3: 61.8% to 65 % is our 3rd Target
( This is also reversal zone so we have to book profit at this area and if break then take fresh entry with SL of 2nd Target 50% .)
Next Targets are 78.6 % , 88.9 % 100% , 113.5 % , 127.2% , 141.5% and 161.8% to 165%.
161.8 to 165% if profit booking area so book full profit and wait for reversal.
How to take reversal trade :
If price going upside/ downside then then buy or sell levels appear on Chart ( Automatically show when price reach any reversal zone of harmonic projection pattern based .
After showing reversal levels wait for confirmation until 13.5 % or 27 .6 % level not break if break then exit from current buy / sell trade and take fresh reverse trade buy/ sell .
Trailing SL:
After reach 1st Target trail SL to just above or below cost ( for example we are holding sell trade from 100 1st Target 110 hit then move trailing sl to 104-105 and move SL as price move upside or Downside)
Blue Line is 1st support/ Resistance
Green line is 2nd support/ resistance
Red line is 3rd Support/ resistance

gold correction side updategold mcx stya blw 83150 looks dwn fall till 82920--770 expect where hurdel for interday base 83319@ in spot gold 2832 abv only rock or blw 2810 more dwn fall possible 2790-70$

As said yesterday gold will fall , less because Rupee weakHow to take trades using Harmonic pattern projection Trade setup is explained below :-
1st D point : 0% is recent top or bottom.
2nd D Point : 13.5% is work as trailing SL of buy or sell trade if hit then we have to book profit
.If price goes below 13.5% then early or risky traders can reversal trade ,
Safe traders can wait for 27% levels break
Targets :
Target T1 is 27.3% if you are taken entry from 13.5% if taken entry from 27.3 then Target T1: 38.2 % level is our 1st Target
( 38.2% if also a reversal zone so if price reverse then we can make fresh entry also).
T2: 50% level is our 2nd Target
T3: 61.8% to 65 % is our 3rd Target
( This is also reversal zone so we have to book profit at this area and if break then take fresh entry with SL of 2nd Target 50% .)
Next Targets are 78.6 % , 88.9 % 100% , 113.5 % , 127.2% , 141.5% and 161.8% to 165%.
161.8 to 165% if profit booking area so book full profit and wait for reversal.
How to take reversal trade :
If price going upside/ downside then then buy or sell levels appear on Chart ( Automatically show when price reach any reversal zone of harmonic projection pattern based .
After showing reversal levels wait for confirmation until 13.5 % or 27 .6 % level not break if break then exit from current buy / sell trade and take fresh reverse trade buy/ sell .
Trailing SL:
After reach 1st Target trail SL to just above or below cost ( for example we are holding sell trade from 100 1st Target 110 hit then move trailing sl to 104-105 and move SL as price move upside or Downside)
Blue Line is 1st support/ Resistance
Green line is 2nd support/ resistance
Red line is 3rd Support/ resistance

gold crucial update after budget gold spot stya abv 2800$ looks 2810--20 than after 2840--60$ possiblw where support 2766$ in mcx 82900 abv gold heading towards till 83300-700++++ support 82660@ yes looks zoom up only

Tarrif will impact negative on gold sell on rise sl recent high How to take trades using Harmonic pattern projection Trade setup is explained below :-
1st D point : 0% is recent top or bottom.
2nd D Point : 13.5% is work as trailing SL of buy or sell trade if hit then we have to book profit
.If price goes below 13.5% then early or risky traders can reversal trade ,
Safe traders can wait for 27% levels break
Targets :
Target T1 is 27.3% if you are taken entry from 13.5% if taken entry from 27.3 then Target T1: 38.2 % level is our 1st Target
( 38.2% if also a reversal zone so if price reverse then we can make fresh entry also).
T2: 50% level is our 2nd Target
T3: 61.8% to 65 % is our 3rd Target
( This is also reversal zone so we have to book profit at this area and if break then take fresh entry with SL of 2nd Target 50% .)
Next Targets are 78.6 % , 88.9 % 100% , 113.5 % , 127.2% , 141.5% and 161.8% to 165%.
161.8 to 165% if profit booking area so book full profit and wait for reversal.
How to take reversal trade :
If price going upside/ downside then then buy or sell levels appear on Chart ( Automatically show when price reach any reversal zone of harmonic projection pattern based .
After showing reversal levels wait for confirmation until 13.5 % or 27 .6 % level not break if break then exit from current buy / sell trade and take fresh reverse trade buy/ sell .
Trailing SL:
After reach 1st Target trail SL to just above or below cost ( for example we are holding sell trade from 100 1st Target 110 hit then move trailing sl to 104-105 and move SL as price move upside or Downside)
Blue Line is 1st support/ Resistance
Green line is 2nd support/ resistance
Red line is 3rd Support/ resistance

Gold mcx fall after Budget as expected, tarrif is negative alsoHow to take trades using Harmonic pattern projection Trade setup is explained below :-
To take Fresh trade : EARLY etry willl be above/ below 13.5% level . Safe traders can enter above or below 27.3% level
Targets :
Target T1 is 27.3% if you are taken entry from 13.5% if taken entry from 27.3 then Target T1: 38.2 % level is our 1st Target
( 38.2% if also a reversal zone so if price reverse then we can make fresh entry also).
T2: 50% level is our 2nd Target
T3: 61.8% to 65 % is our 3rd Target
( This is also reversal zone so we have to book profit at this area and if break then take fresh entry with SL of 2nd Target 50% .)
Next Targets are 78.6 % , 88.9 % 100% , 113.5 % , 127.2% , 141.5% and 161.8% to 165%.
161.8 to 165% if profit booking area so book full profit and wait for reversal.
How to take reversal trade :
If price going upside/ downside then then buy or sell levels appear on Chart ( Automatically show when price reach any reversal zone of harmonic projection pattern based .
After showing reversal levels wait for confirmation until 13.5 % or 27 .6 % level not break if break then exit from current buy / sell trade and take fresh reverse trade buy/ sell .
Trailing SL:
After reach 1st Target trail SL to just above or below cost ( for example we are holding sell trade from 100 1st Target 110 hit then move trailing sl to 104-105 and move SL as price move upside or Downside)
Blue Line is 1st support/ Resistance
Green line is 2nd support/ resistance
Red line is 3rd Support/ resistance

Gold MCX levels avoid buy trade at cmp will fall after BudgetHow to take trades using Harmonic pattern projection Trade setup is explained below :-
To take Fresh trade : EARLY etry willl be above/ below 13.5% level . Safe traders can enter above or below 27.3% level
Targets :
Target T1 is 27.3% if you are taken entry from 13.5% if taken entry from 27.3 then Target T1: 38.2 % level is our 1st Target
( 38.2% if also a reversal zone so if price reverse then we can make fresh entry also).
T2: 50% level is our 2nd Target
T3: 61.8% to 65 % is our 3rd Target
( This is also reversal zone so we have to book profit at this area and if break then take fresh entry with SL of 2nd Target 50% .)
Next Targets are 78.6 % , 88.9 % 100% , 113.5 % , 127.2% , 141.5% and 161.8% to 165%.
161.8 to 165% if profit booking area so book full profit and wait for reversal.
How to take reversal trade :
If price going upside/ downside then then buy or sell levels appear on Chart ( Automatically show when price reach any reversal zone of harmonic projection pattern based .
After showing reversal levels wait for confirmation until 13.5 % or 27 .6 % level not break if break then exit from current buy / sell trade and take fresh reverse trade buy/ sell .
Trailing SL:
After reach 1st Target trail SL to just above or below cost ( for example we are holding sell trade from 100 1st Target 110 hit then move trailing sl to 104-105 and move SL as price move upside or Downside)
Blue Line is 1st support/ Resistance
Green line is 2nd support/ resistance
Red line is 3rd Support/ resistance

Gold Next Move SL 1Hr candle close only, Target Trigger Price
All detail for chat. good entry at mark price only. and must stoploss minimum risk and good profit. risk ratio 1:1 to manage modified SL. This is not call, Just my idea. Please understand your risk and take full responsibility of your actions

GOLD MAY BREAK UPSIDEIf gold cross it;s all time high there is possibility to catch next resistance(target) otherwise retracement may be seen from here or from next target which is shown i red color here i mentioning that all this analysis is based on gann fan and trend the supports and resistances mentioned here are intersected zone of two or more gann fan lines.Please don't consider it as my buy/sell call.

gold mcx interday update edu pur.after hit 80300++ gold interday----looking some profit booking till 80110++++ yes one can sell on rise with tight sl 80343 or let seee----- over all gold up only

gold mcx crucial update near expiry zonesupport find 78700@ if mkt trades blw thna more dwn correction expect 78580—330++ where find strong demand zone7 8250 if trade blw than more dwn 780060—77940++------ or hurdel 79270 styaa bv thna mkt looks big move till 79750-80000+++++ if find near support than try to buy with sl or let see-- over all looks gold still up side if any news no comes to dwn

Gold Next Move SL 1Hr candle close only, Target Trigger Price
All detail for chat. good entry at mark price only. and must stoploss minimum risk and good profit. risk ratio 1:1 to manage modified SL. This is not call, Just my idea. Please understand your risk and take full responsibility of your actions
Gold long term opportunity - 15% from current priceGold has been travelling in an ascending channel since July 2024, when China started buying in large amounts.
It has formed a textbook cup-and-handle pattern by taking support from its previous resistance of 73800, by forming the cup's bottom. Cup and handle range of approx 7.2% might take it to the channel's top, which co-incides with Fib 1.6 level of 84000.
When it breaks the channel, the channel's range of 8.5% might take it above Fib 2.6 level of 90000.
So far buying opportunities might present itself at following intervals:
78900, when it takes support from the cup and handle resistance
79800, when it takes rejection from Fib 1 level
Again at around 80000 when it breaks above the Fib 1 level and takes support from it.

MCX Gold: Elliott Wave Insights on Ascending ChannelTimeframe: Daily
MCX Gold has been trading within an ascending parallel channel for over 65 weeks . The value area highlights zones of supply and demand, with the control line exerting a gravitational pull on the current price. Within this structure, there are four zones of no trading activity and two neutral zones.
A triangle pattern is forming around the control price, indicating a potential price movement. If the price closes above the control line, it could potentially reach the following targets: 77660 – 78560 – 79600+ . On the other hand, if the price breaks and closes below the strong support level, we may witness a short decline, possibly reaching the lower band of the parallel channel.
We will update further information soon.

GOLD Triangle BreakoutGold has given a breakout from Triangle Pattern on 1D timeframe. It had been consolidating since November 2024.

after hit tgt next update gold spot or mcx edu pur.gold spot hit almost 2700 high made near 2699@-- now esy on 2703--2705 if mkt styaa bv thna nxt up side only 2727--2745++++ where support 2675$ blw mkt may test 2670--2666++++-- in mcx support find 78200@ blw mkt more correction or if mkt stya abv 78900 thna soon 79130--470+++++

Gold Next MoveSL 1Hr candle close only, Target Trigger Price
All detail for chat. good entry at mark price only. and must stoploss minimum risk and good profit. risk ratio 1:1 to manage modified SL. This is not call, Just my idea. Please understand your risk and take full responsibility of your actions

Gold Next Move SL 1Hr candle close only, Target Trigger Price
All detail for chat. good entry at mark price only. and must stoploss minimum risk and good profit. risk ratio 1:1 to manage modified SL. This is not call, Just my idea. Please understand your risk and take full responsibility of your actions

Gold mcx 125 points profit booked on sell , 150 points on buy Disclaimer -
This information is only for educational purposes, this is not for any buy or sell recommendations .
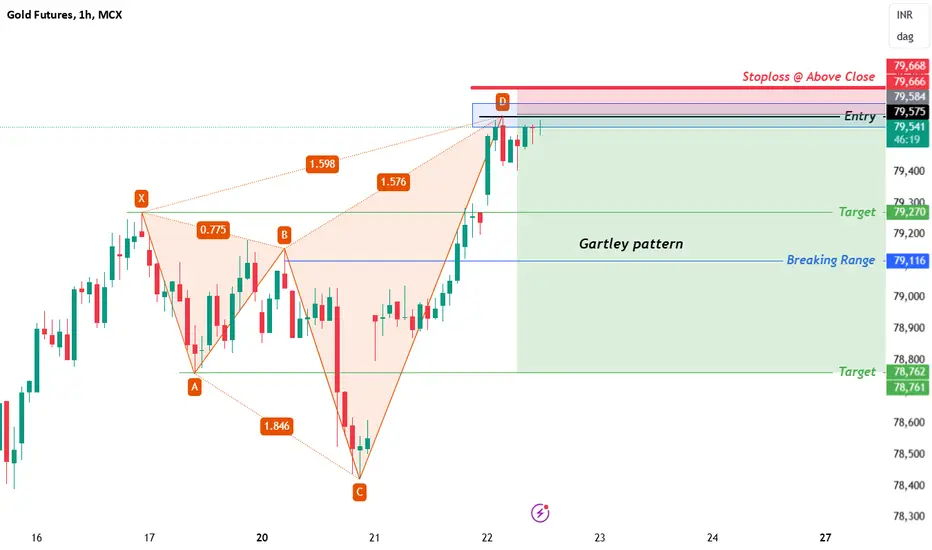
On Our Harmonic pattern indicator
based trade setup take trade as explained below :-
Orange/ Green / lines are work as support/Resistance.
Blacks lines are Support/ resistance based on previous important low and High level
ENTRY -
When price breaks Trailing SL (risky traders can take entry after breaking SL 15 % ,safe traders can take entry after breaking SL 30 % )retracement Which is SL points then take Entry on Buy or Sell Trade
SL -
D points Which is recent High / Low mentioned in Chart is our SL
TARGET -
Target 1- (T1 : 38.2)
Target 2- (T2 : 50 %)
Target 3- (T3 : 61.8%)
Target 4- (T4 : 78.6%)
Please note:-
It's working on news based and volitile market very well so exit if SL hit

Bat pattern complete in Gold Bat pattern complete in Gold
expect price to hit 77500/77200
we will review if further downside opens from those levels , till than clear short

Gold mcx levels until 78800 not break avoid buy Disclaimer -
This information is only for educational purposes, this is not for any buy or sell recommendations .
On Our Harmonic pattern indicator
based trade setup take trade as explained below :-
Orange/ Green / lines are work as support/Resistance.
Blacks lines are Support/ resistance based on previous important low and High level
ENTRY -
When price breaks Trailing SL (risky traders can take entry after breaking SL 15 % ,safe traders can take entry after breaking SL 30 % )retracement Which is SL points then take Entry on Buy or Sell Trade
SL -
D points Which is recent High / Low mentioned in Chart is our SL
TARGET -
Target 1- (T1 : 38.2)
Target 2- (T2 : 50 %)
Target 3- (T3 : 61.8%)
Target 4- (T4 : 78.6%)
Please note:-
It's working on news based and volitile market very well so exit if SL hit

Gold MCX if break 78000 then profit booking will start Disclaimer -
This information is only for educational purposes, this is not for any buy or sell recommendations .
On Our Harmonic pattern indicator
based trade setup take trade as explained below :-
Orange/ Green / lines are work as support/Resistance.
Blacks lines are Support/ resistance based on previous important low and High level
ENTRY -
When price breaks Trailing SL (risky traders can take entry after breaking SL 15 % ,safe traders can take entry after breaking SL 30 % )retracement Which is SL points then take Entry on Buy or Sell Trade
SL -
D points Which is recent High / Low mentioned in Chart is our SL
TARGET -
Target 1- (T1 : 38.2)
Target 2- (T2 : 50 %)
Target 3- (T3 : 61.8%)
Target 4- (T4 : 78.6%)
Please note:-
It's working on news based and volitile market very well so exit if SL hit
